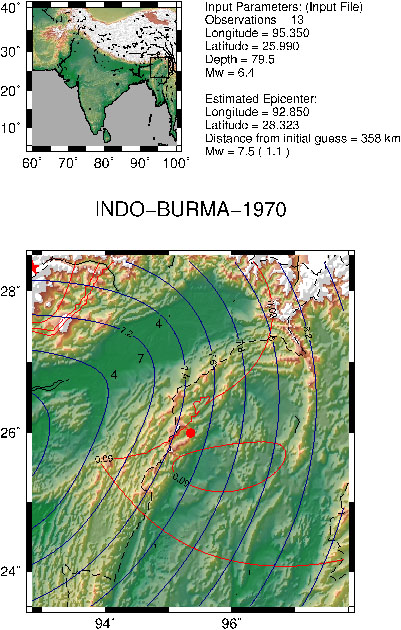
| Figure 123. Epicentral location of the Indo-Burma-1970 earthquake. Arabic numerals indicate all the intensity observations within the map region. The red contours indicate the 95%, 80% and 50% confidence intervals using the values published in Bakun and Wentworth (1999)Bakun, W. H. and Wentworth, C. M. (1999). Erratum: Estimating Earthquake Location and Magnitude from Seismic Intensity Data. Bull. Seismol. Soc. Am., 89(2), 557. while the blue contours indicate the mean magnitude inferred at each location from the data and attenuation relationship developed in the paper. The red star indicates the minimum deviation location and where instrumental epicenters are available, they are marked by a red circle. Both the input and output parameters used in the epicentral estimation algorithm are listed in the upper right corner of each figure. |