This electronic supplement includes figures of the examined regions, earthquake epicenters, and joint distributions of the time and space components of the nearest-neighbor distance. Figure S1 shows the locations of the five examined regions from California: The Geysers geothermal field; Coso region, including the Coso geothermal field; San Jacinto fault zone; and Salton Sea geothermal field. Figure S2 shows the epicenters of earthquakes from the six examined regions from California and South Africa. Figure S3 shows the cluster style of the six examined regions according to Δ analysis with Δ = 1, and Figure S4 illustrates the earthquake clustering in the Parkfield area, which is not among the principal six regions studied in the main article but is used for discussion.
Figure S1. The examined regions in California are The Geysers geothermal field; Coso region, including the Coso geothermal field; San Jacinto fault zone; and Salton Sea geothermal field. Detailed maps of the examined seismicity are shown in Figure S2.
Figure S2. The earthquake epicenters in the six examined regions are (a) The Geysers geothermal field, (b) TauTona gold mine with the mine location depicted by rectangle, (c) Coso geothermal field, (d) Salton Sea geothermal field, (e) Coso region (the events from the Coso geothermal field are shown in gray and are excluded from analysis), and (f) San Jacinto fault zone.
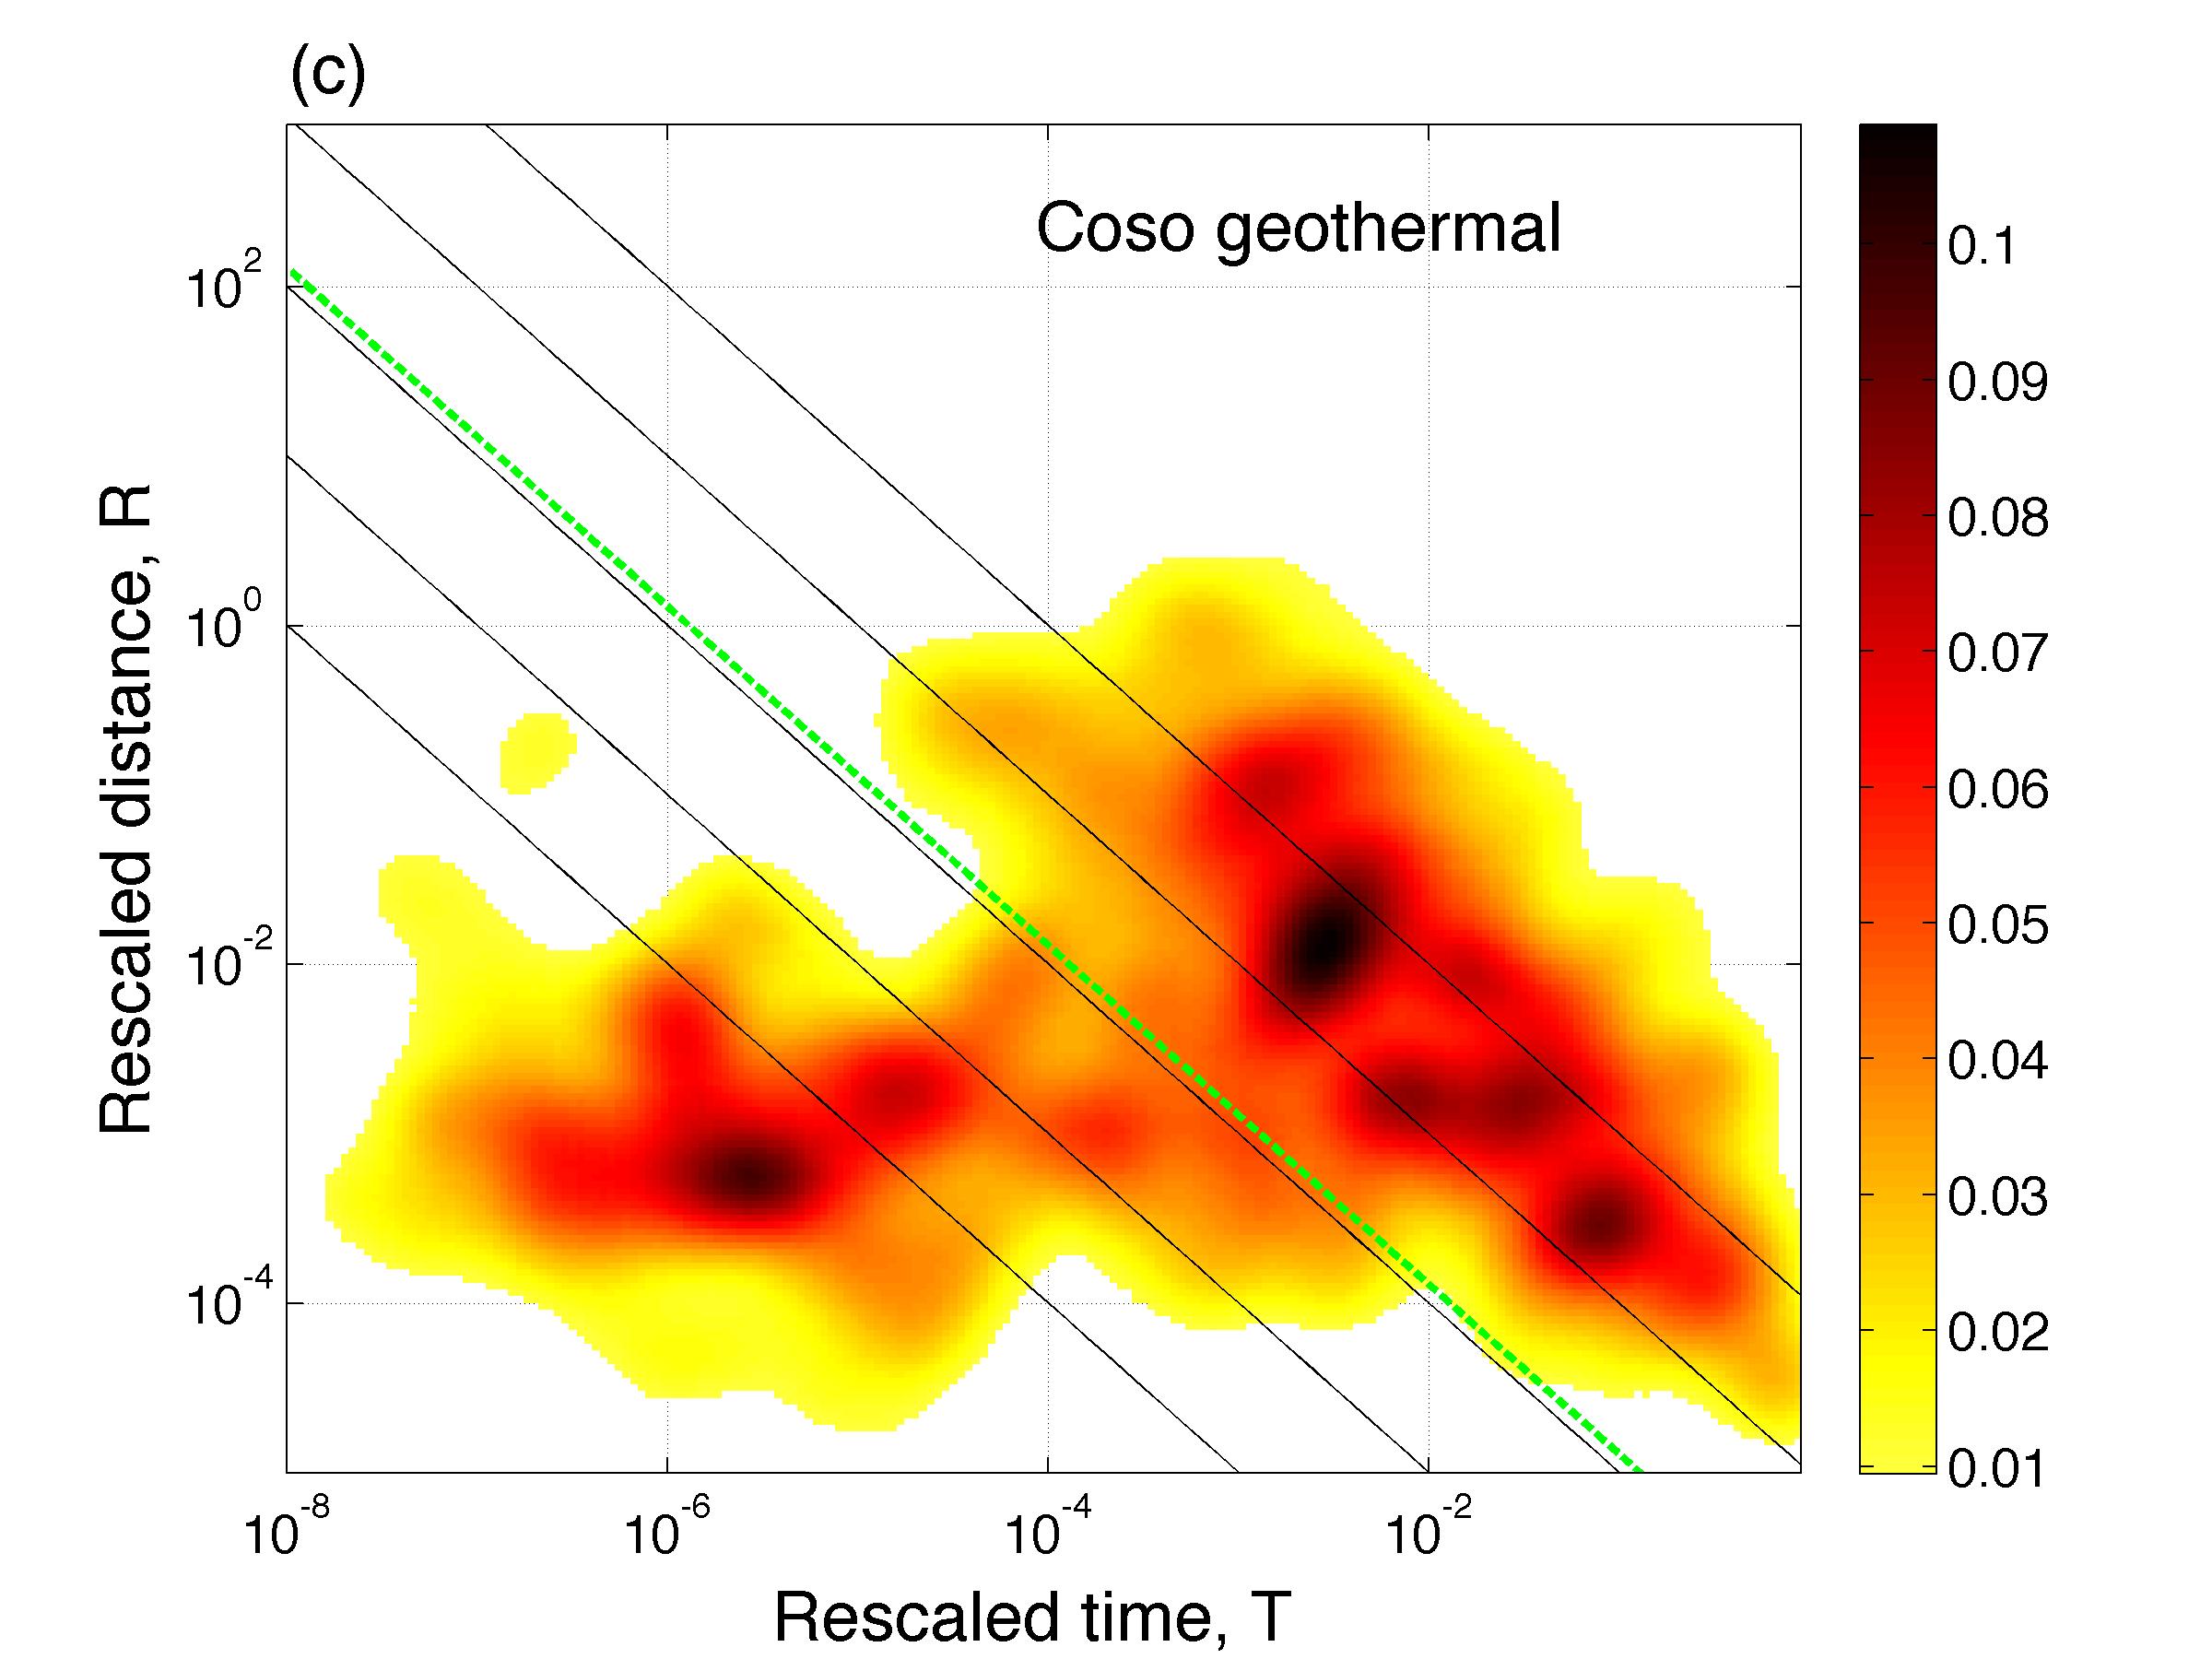
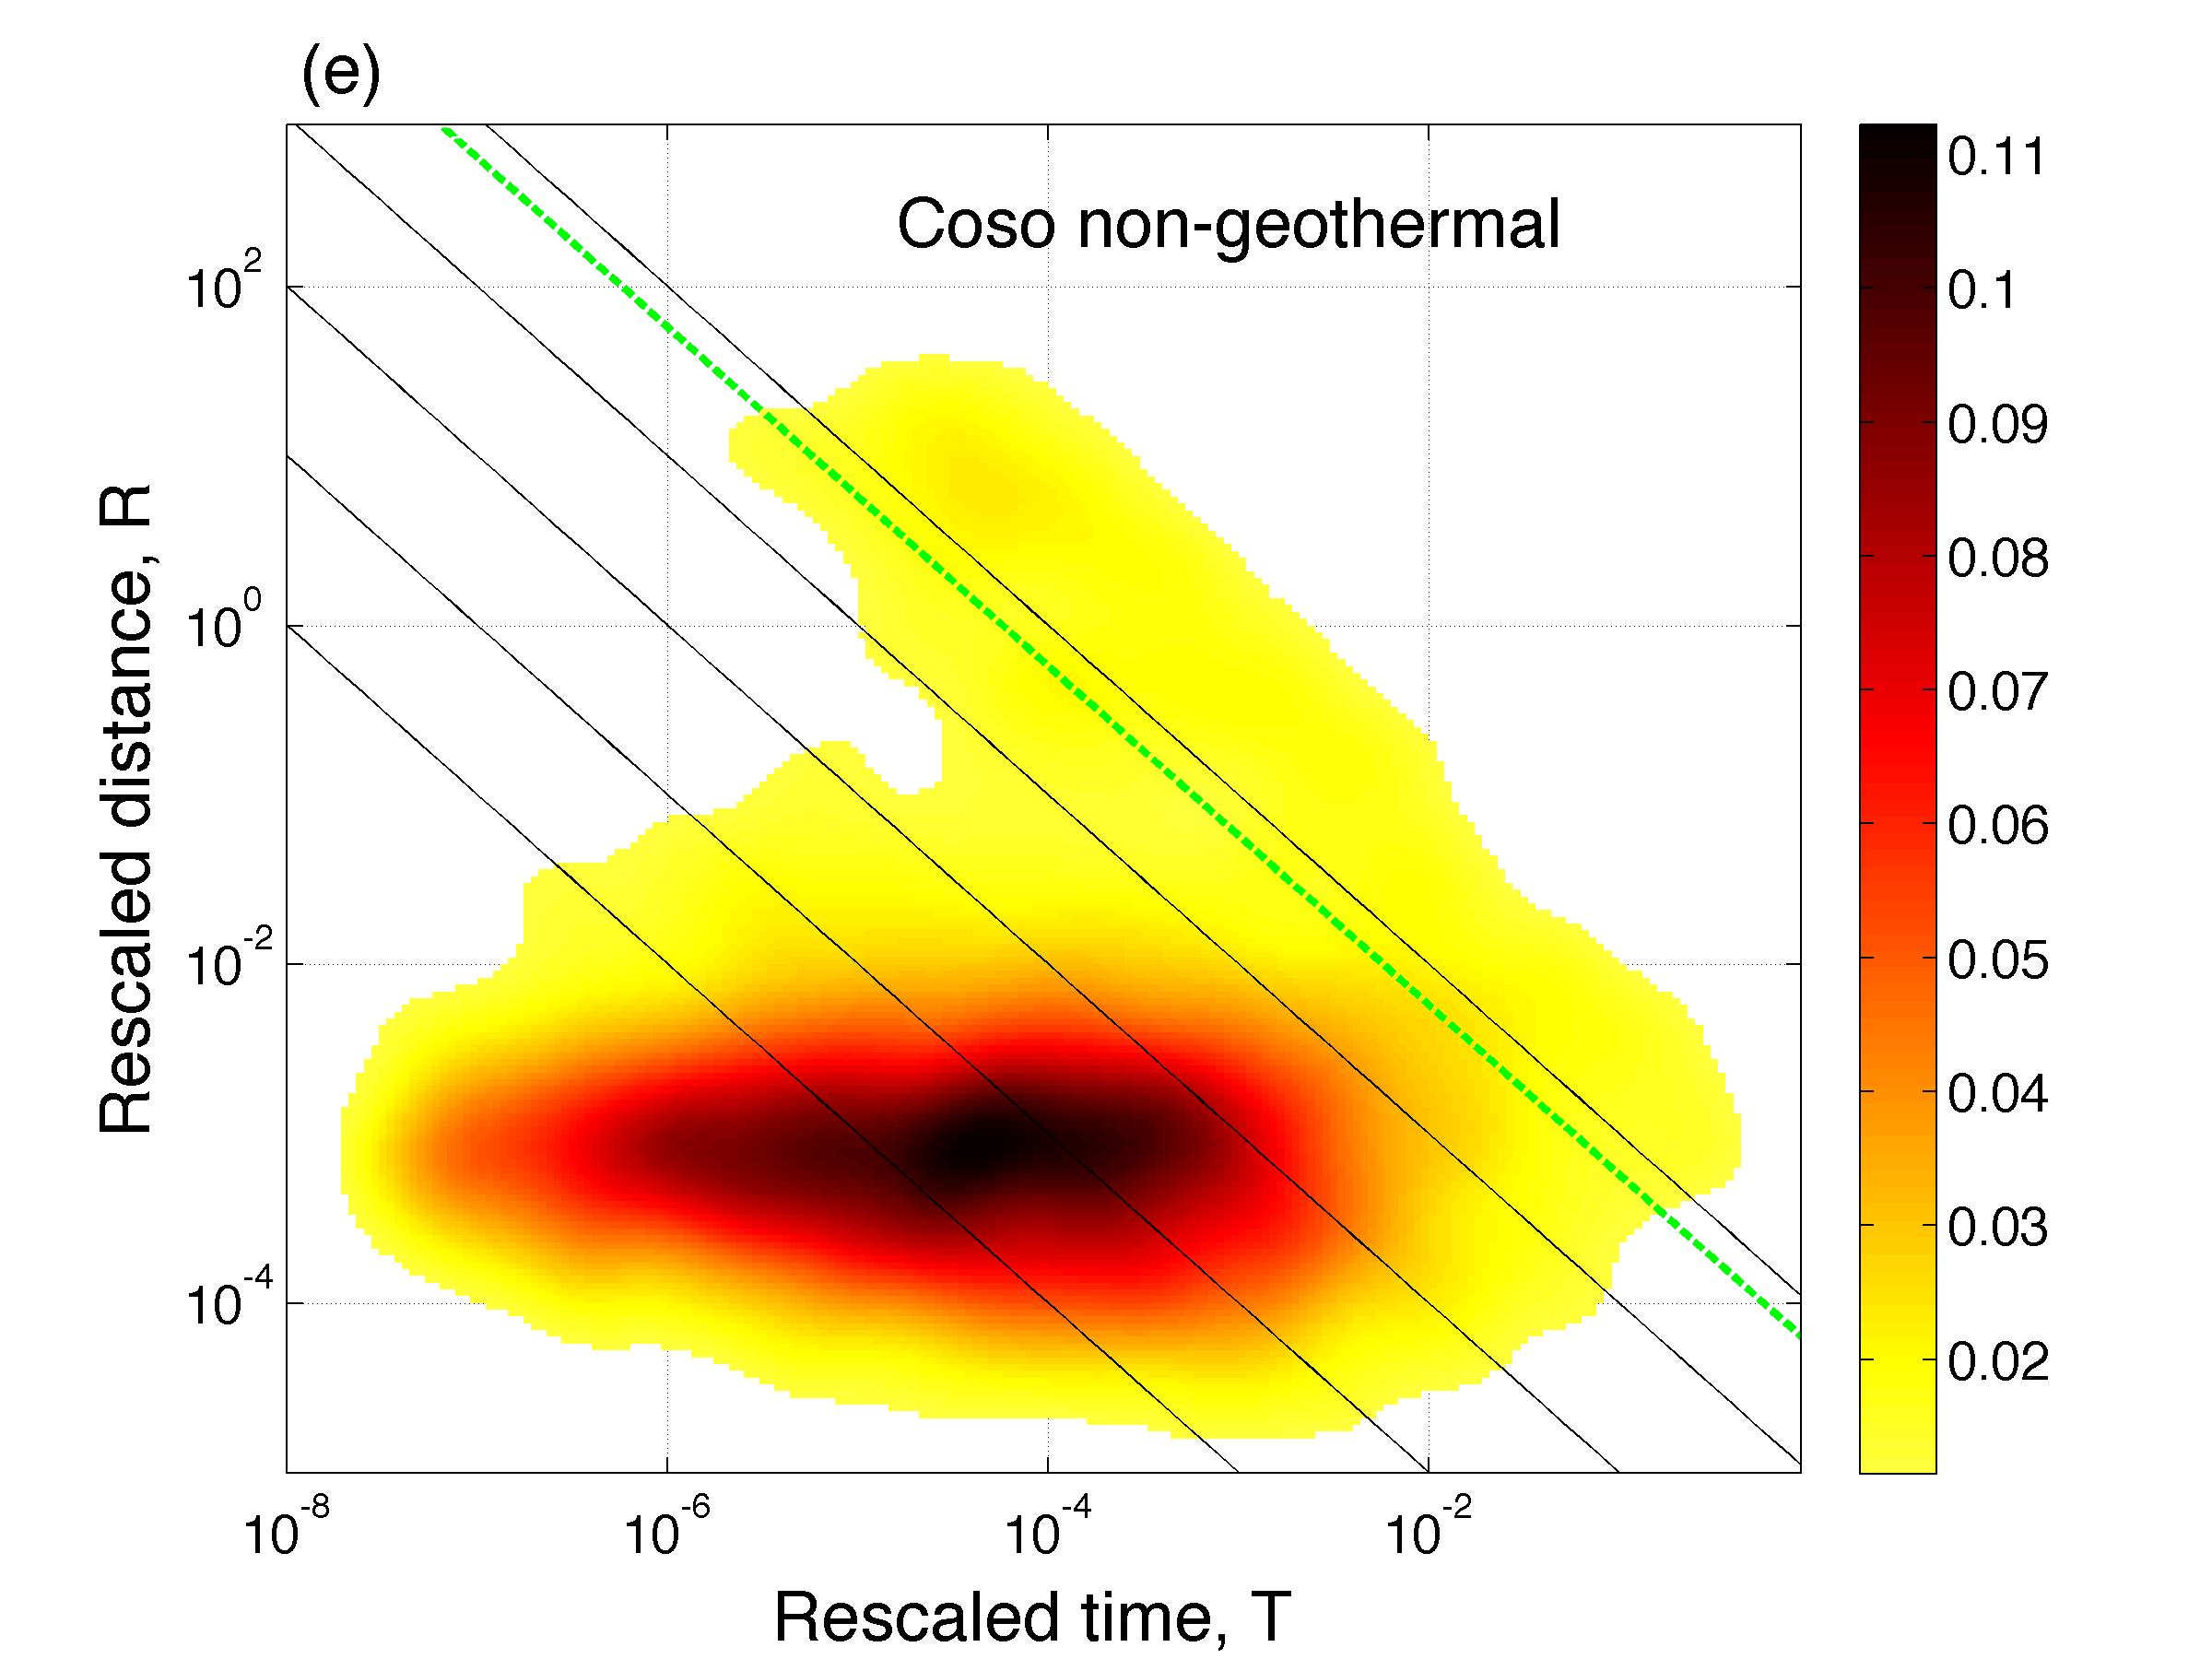
Figure S3. Clustering style of seismicity in the six examined regions according to Δ analysis. Each panel shows the joint 2D distribution of the rescaled time T and distance R to the parent in a selected region. The Δ analysis only uses parents with magnitude Δ = 1 unit above the minimal catalog magnitude and offspring with magnitude larger than or equal to that of parent minus Δ = 1. The solid diagonal lines are the same in all panels and correspond (from bottom to top) to η = 10−8, 10−7, 10−6, 10−5, and 10−4. The dashed diagonal line depicts the mode separation threshold log10η0 estimated using the 1D Gaussian mixture model (Hicks, 2011). The color bar denotes the density values. For visual convenience, we cut the lower µ × 100% of each distribution (transparent background). (a) µ = 0.05, PΔ = 19% of events at The Geysers satisfy the conditions of the Δ analysis; (b) µ = 0.025, PΔ = 2.6%; here, we only show events that happened during 00:00 to 13:00, when the mining activity at the TauTona gold mine is minimal; (c) µ = 0.05, PΔ = 11% at the Coso geothermal field; (d) µ = 0.1, PΔ = 13% at the Salton Sea geothermal field; (e) µ = 0.1, PΔ = 14% at the Coso nongeothermal field; and (f) µ = 0.1, PΔ = 17% in the San Jacinto fault zone.
Figure S4. Clustering in the Parkfield area. (a) Joint distribution of time and space components (T, R) of the nearest-neighbor distance (compare to Fig. 1 of the main article). (b) Joint distribution of relative quantiles (QT, QR) of the clustered population relative to the background (compare to Fig. 2 of the main article), with the respective marginal distribution of QR in the inset. (c) Distribution of rescaled times T to parent for offspring within one parent rupture length from the parent (compare to Fig. 3 of the main article).
Hicks, A. (2011). Clustering in multidimensional spaces with applications to statistical analysis of earthquake clustering, M.Sc. Thesis, Department of Mathematics and Statistics, University of Nevada, Reno (August 2011).
[ Back ]