This electronic supplement includes figures of velocity–density structure, source–receiver geometries, slip-rate functions, input and inverted rupture models, quantitative waveform comparisons, as well as tables of scalar source parameters and dissimilarity values.
The six additional figures and two tables of this electronic supplement contain further information on the current source inversion validation (SIV) benchmark exercises and related source-inversion results. In particular, we show the 1D velocity–density structure for the forward-modeling exercise and benchmark inv1, as well as examples of slip-rate functions (at selected points) for inv1, obtained from spontaneous dynamic-rupture simulations. Waveform examples and comparative statistics for target rupture model inv1 and four submitted solutions complete the analysis for benchmark inv1. In addition, we show the inversion setup for inv2, as well as proposed solutions, comparative statistics, and waveform examples for this SIV benchmark.
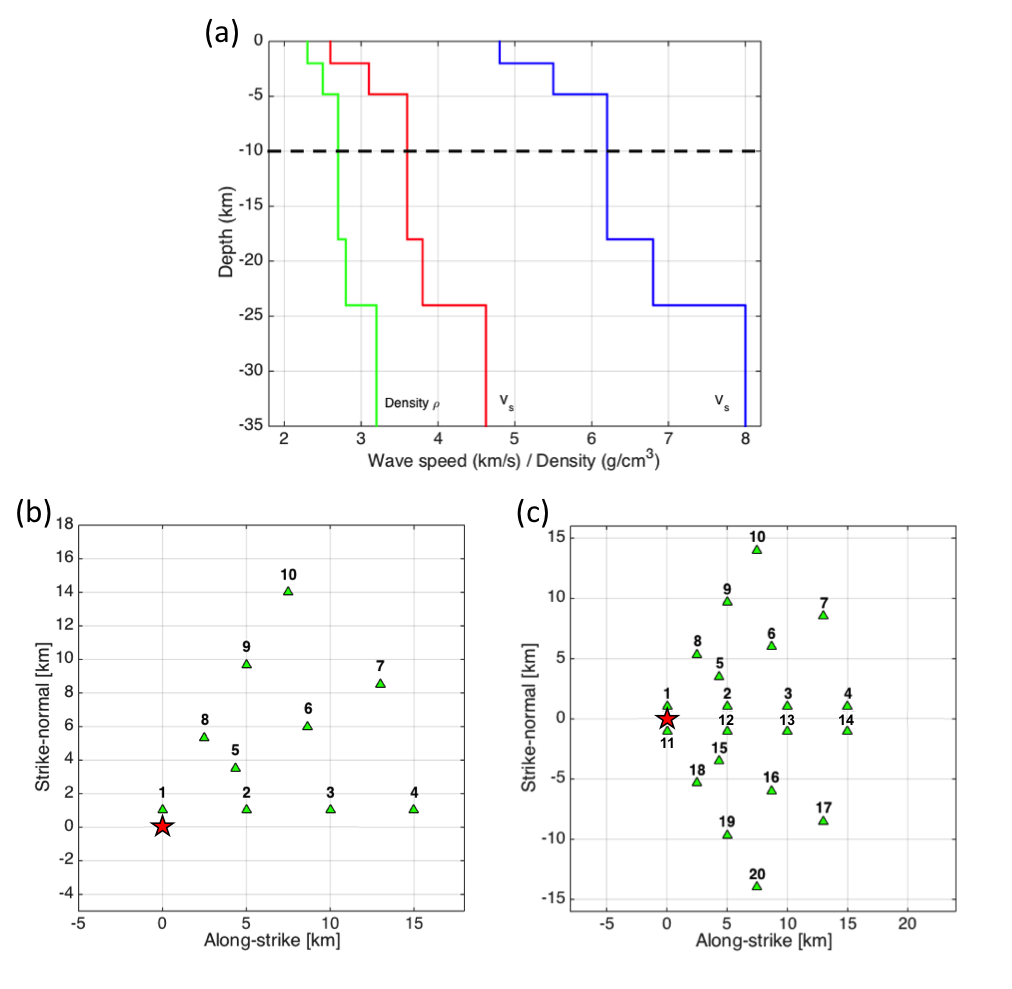
Figure S1. (a) One-dimensional plane-layered velocity–density structure used for the source inversion validation (SIV) forward-modeling exercise and inversion benchmark inv1. The black-dotted horizontal line marks the source depth (Z = 10 km) for the point-source Green’s function tests. (b) Station distribution for the strike-slip forward-modeling exercise. The red star marks the epicenter for the point source. (c) Same as (b) but for the reverse-faulting case.
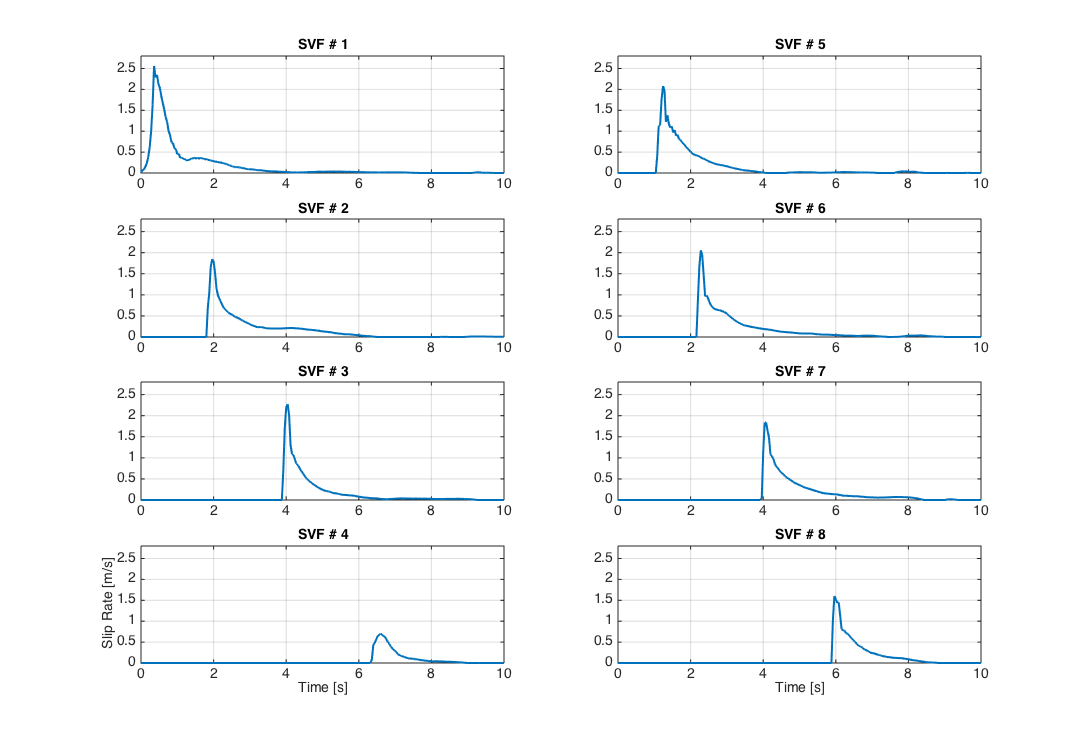
Figure S2. Slip-rate functions (in meters per second) from dynamic-rupture simulations that generate the target model for inversion benchmark inv1. The eight regularly spaced points (1–8; see Fig. 5 of the main article) document the Yoffe-function-type slip-rate behavior for this benchmark.
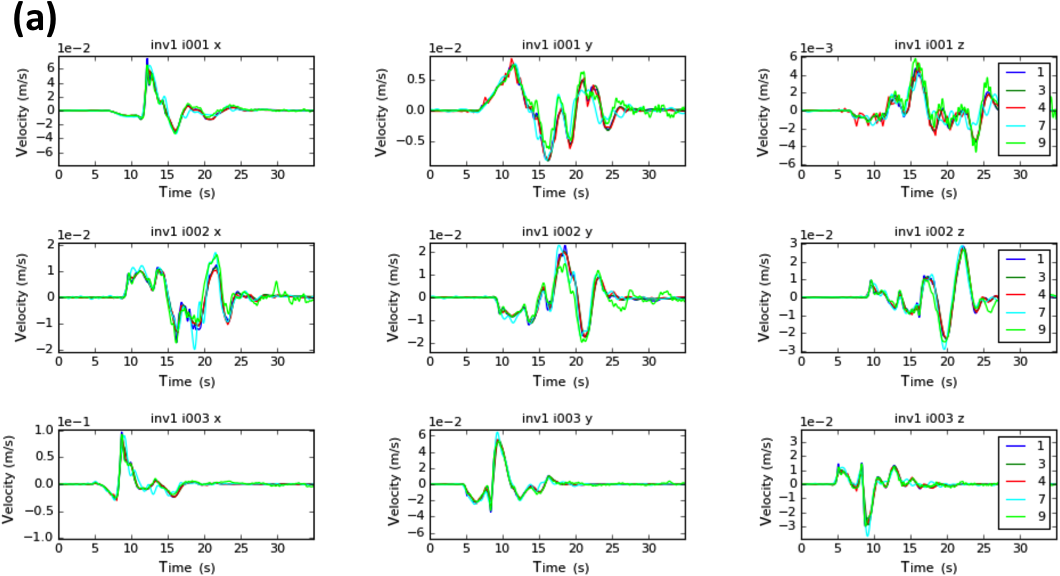
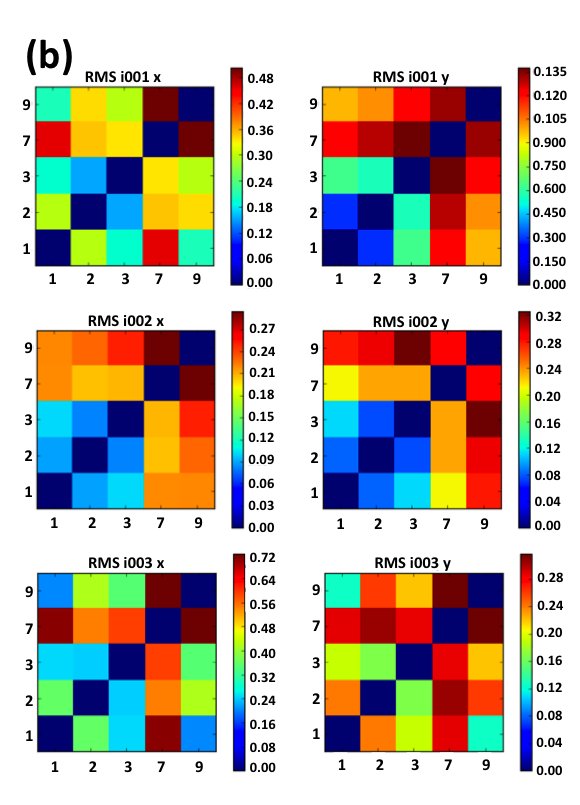
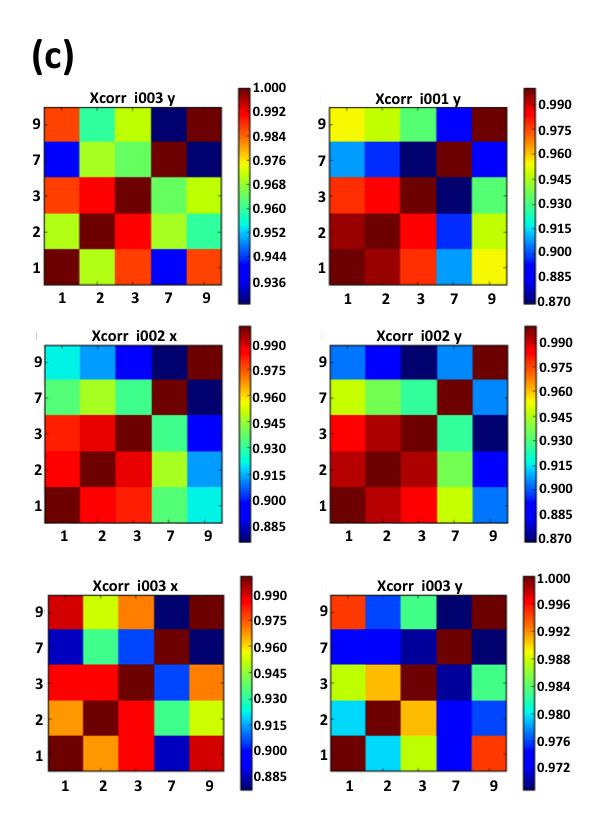
Figure S3. Comparative statistics for slip-inversion results for benchmark inv1. (a) Three-component waveform comparison at three selected sites for four solutions (out of 10 submitted solutions) with respect to the given target waveforms (labeled 1). Waveform set 1 represent the true solution (from the dynamic simulations) shown in Figure 8a of the main article; the remaining four sets of seismograms correspond to the rupture models in Figure 8b–e of the main article. (b) Root mean square (RMS)-misfit matrices for the waveforms shown in (a). (c) Cross-correlation (Xcorr) coefficient matrices for the waveforms shown in (a). The graphics shown here are generated using the online visualization tool.
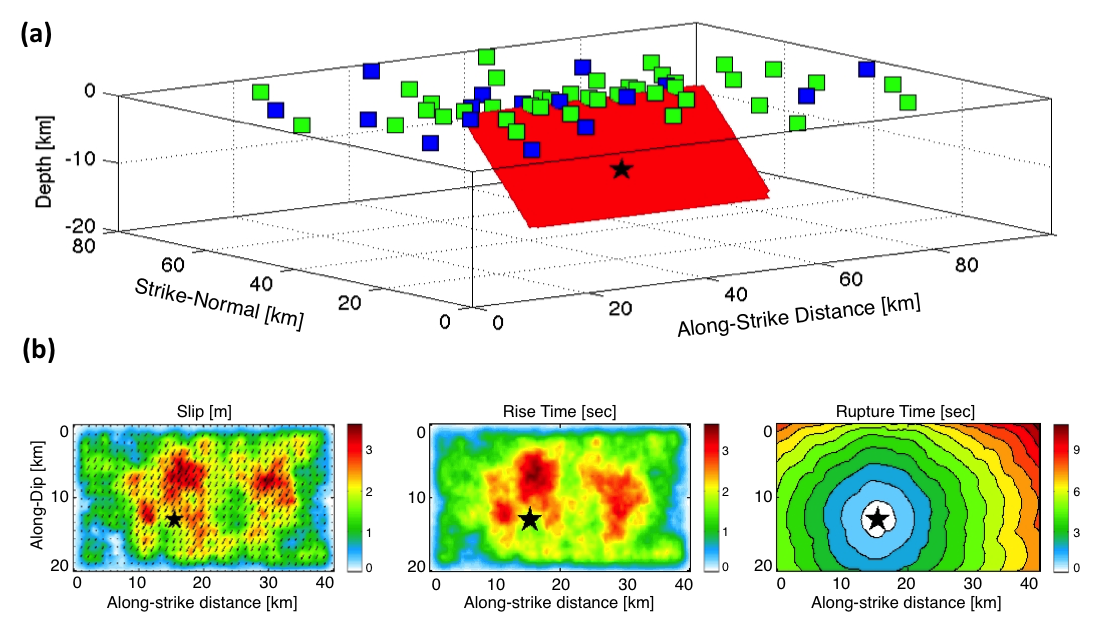
Figure S4. (a) Source–receiver geometry for SIV benchmark inv2a. The red rectangle marks the ~45° dipping rupture plane, and the black star is the hypocenter. The green symbols denote sites where synthetic data are distributed, and the blue symbols indicate sites for which blind-predicted waveforms are requested. (b) Rupture model for the inv2a benchmark, showing final slip (left, in meters), rise-time (center, in seconds), and rupture time (right, contour lines every 1 s).
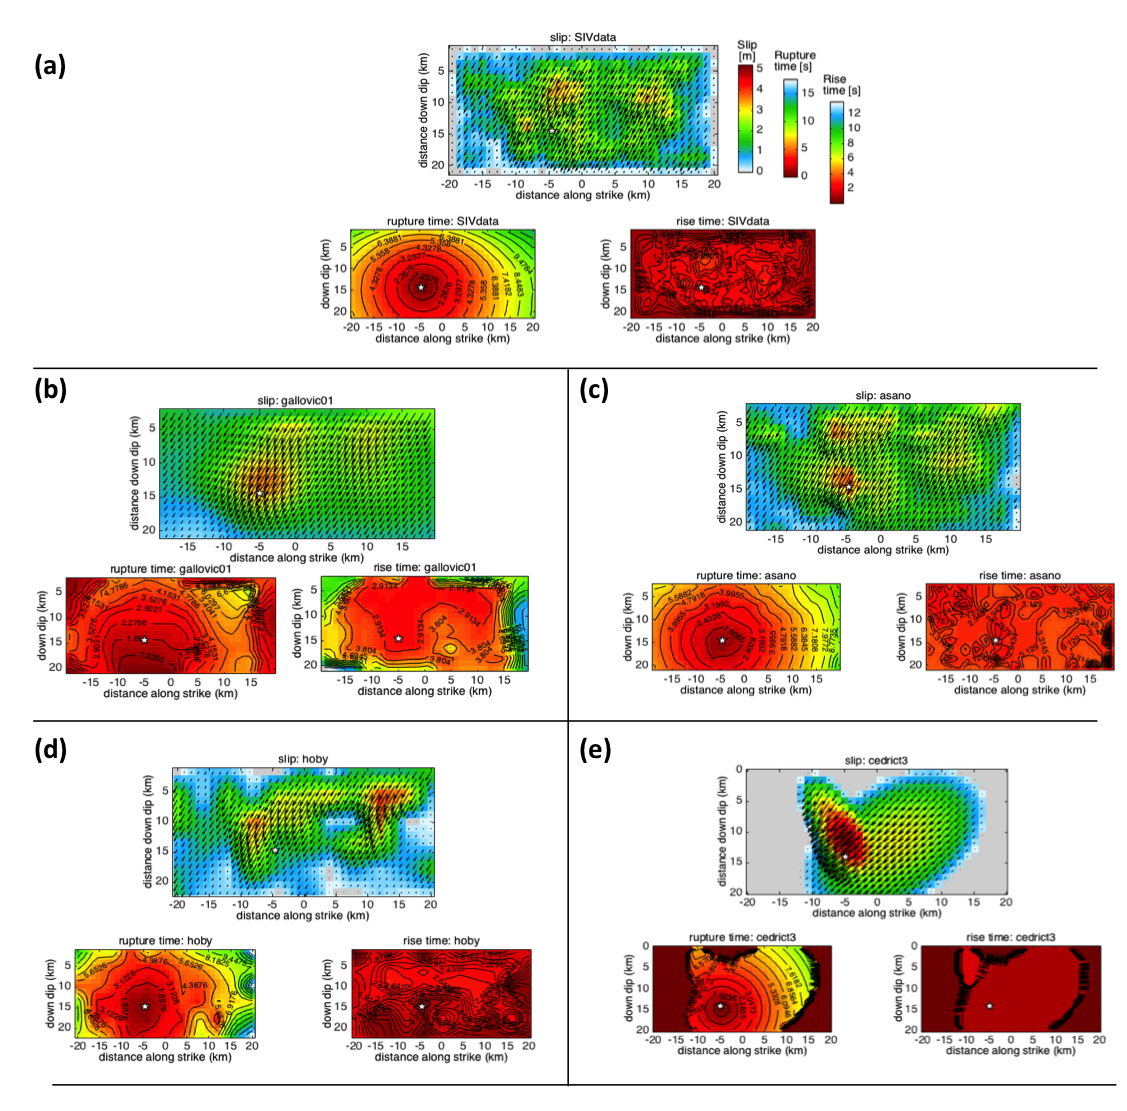
Figure S5. Slip-inversion results for inversion benchmark inv2a. (a) The target rupture model (see also Fig. S4). In each panel, we show (top) final slip, (bottom left) rupture time, and (bottom right) rise time. The solutions shown in (b) and (c) are based on multi-time-window source inversion methods, and the solutions in (d) and (e) are based on a nonlinear inversion approach, in which the method of (e) searches for a few elliptical slip patches (Twardzik et al., 2012).
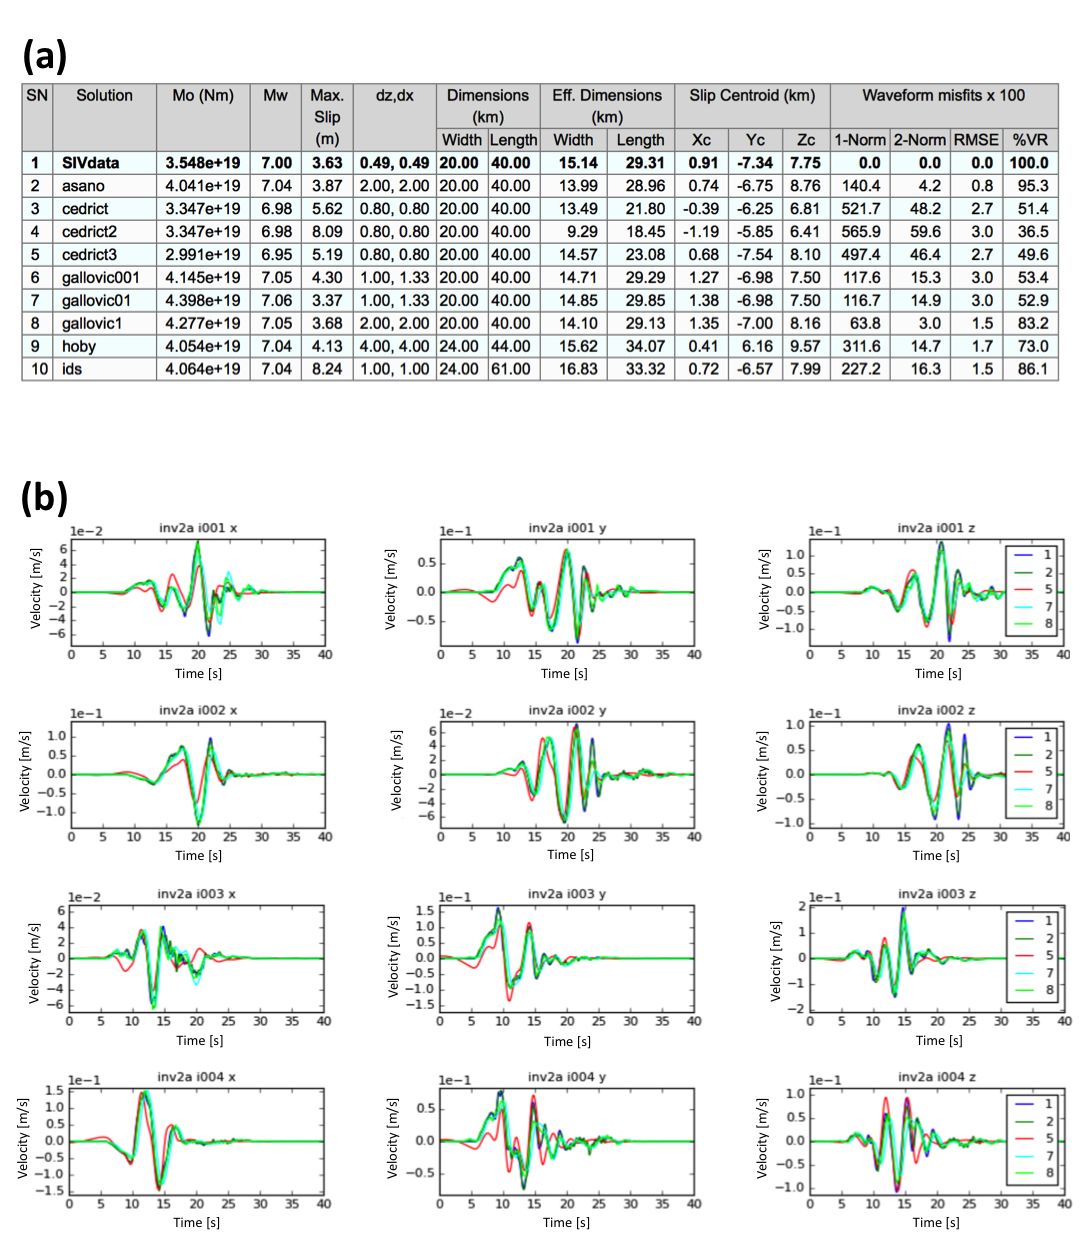
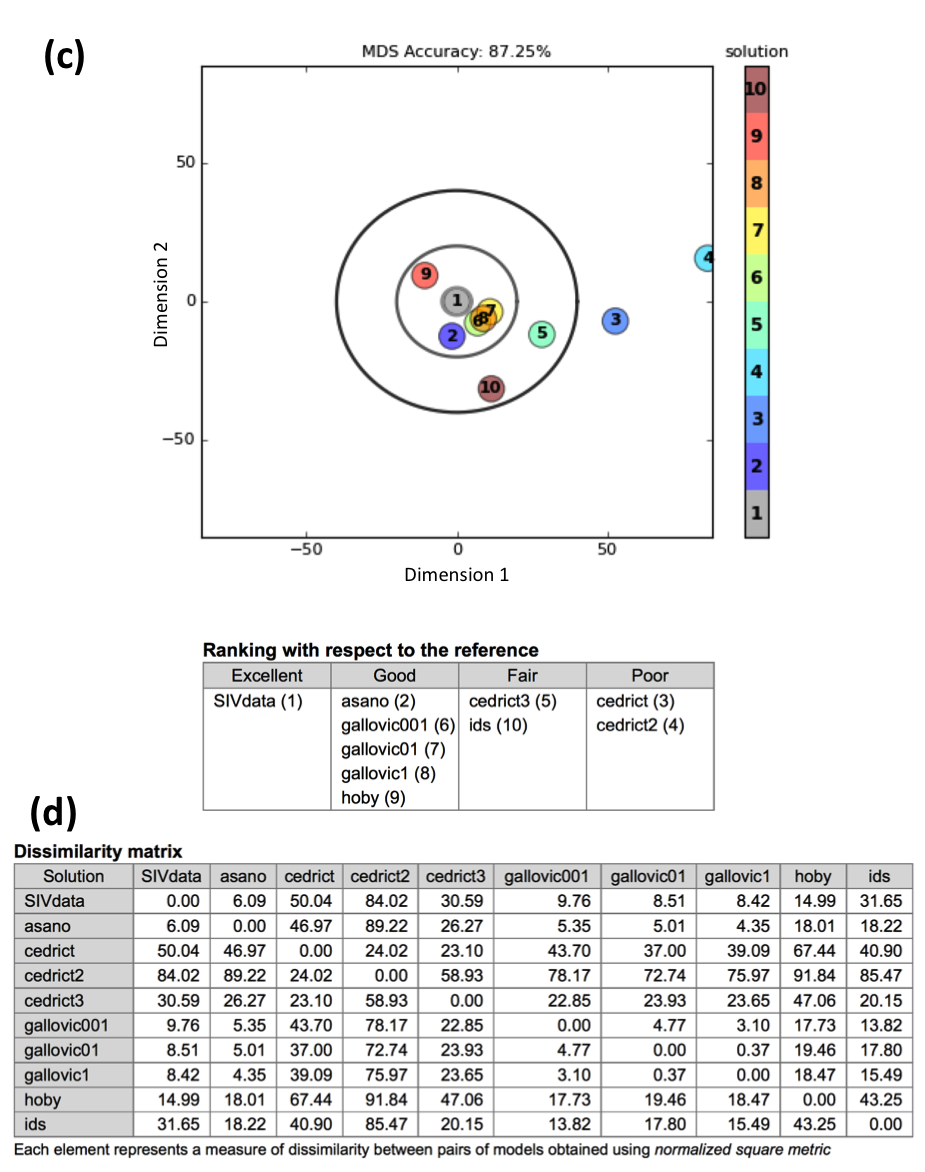
Figure S6a,b and c,d. (a) Summary table of source-model properties for all rupture models of inversion benchmark inv2a. The target rupture model is indicated by “SIVdata.” (b) Three-component waveforms at three selected sites for the five rupture models shown in Figure S5. Note the overall good visual agreement between waveforms, despite the differences in the inverted solutions (Fig. S5) and the known input model (Fig. S4). (c) Multidimensional scaling (MDS) analysis for the submitted solutions, and (d) dissimilarity matrix using the normalized squared-error metric (Razafindrakoto et al., 2015; Zhang et al., 2015). The statistical analysis reveals that solutions asano and gallovic1 show the smallest dissimilarity in final slip with respect to the target model. (1-Norm, L1 norm; 2-Norm, L2 norm; RMSE, root mean square error; VR, variance reduction)
Table S1. Scalar source-model metrics for the results of source inversion validation (SIV) benchmark inv1. The parameters of the known (target) rupture model SIVdata are given in the top-most row, followed by the submitted solutions (in alphabetical order).
Table S2. Dissimilarity metrics for the results of SIV benchmark inv1, using the normalized square metric (Razafindrakoto et al., 2015; Zhang et al., 2015). The (target) rupture model SIVdata is given in the first row (column), followed by the submitted solutions (in alphabetical order). Low values are better; hence, solutions fsg and gallovic2 perform best under this metric.
Mai, P. M., and G. C. Beroza (2000). Source-scaling properties from finite- fault rupture models, Bull. Seismol. Soc. Am. 90, 604–615.
Razafindrakoto, H. N. T, P. M. Mai, M. G. Genton, L. Zhang, and K. K. S. Thingbaijam (2015). Quantifying variability in earthquake rupture models using multidimensional scaling: Application to the 2011 Tohoku earthquake, Geophys. J. Int. 202, 17–40, doi: 10.1093/gji/ggv088.
Twardzik, C., R. Madariaga, S. Das, and S. Custódio (2012). Robust features of the source process for the 2004 Parkfield, California, earthquake from strong-motion seismograms, Geophys. J. Int. 191, 1245–1254.
Zhang, L., P. M. Mai, K. K. S. Thingbaijam, H. N. Razafindrakoto, and M. Genton (2015). Comparing earthquake slip models with the spatial prediction comparison test, Geophys. J. Int. 200, 185–198, doi: 10.1093/gji/ggu383.
[ Back ]