This electronic supplement contains a table and figures of horizontal- and vertical-component pseudospectral acceleration (PSA), and figures of PSA residuals. The 5% damped PSAs at 28 frequencies from 0.1 to 50 Hz for Alberta seismic events utilized in our analysis are provided. Figures S1–S13 illustrate response spectra from all 25 study events (M >3) in Alberta compared with the benchmarks (Oklahoma average binned ground motions and two California ground-motion prediction equations [GMPEs]: Atkinson, 2015, hereafter, A15; and Abrahamson et al., 2014, hereafter, ASK14). We provide average log10 residuals with magnitude for horizontal-component Alberta PSAs with respect to three benchmark GMPEs (A15, ASK14, and Yenier and Atkinson, 2015, calculated for central and eastern North America [YA15CENA]). We also provide plots illustrating the log10 residuals with hypocentral distance calculated for each vertical- and horizontal-component record between Alberta and the benchmarks.
Table S1 [Plain Text Comma-separated Values; ~166 KB]. Horizontal- and vertical-component 5% damped PSA (cm/s2) calculated at 28 frequencies for each of 25 seismic events recorded in Alberta. Table data included are event number, hypocentral distance (km), moment magnitude (M), event date and location, station name, sample rate, component recorded (HH1, HH2, HHZ representing two horizontal and one vertical component, respectively), station location, and PSA calculated from 0.1 to 50 Hz, as well as PGA (cm/s2) and peak ground velocity (PGV) (cm/s).
Figure S1. Vertical-component 5% damped Alberta PSAs (circles) for M 3.0 events in Alberta. The average binned vertical-component Oklahoma PSA for equivalent magnitude–distance range is plotted along with ±1 standard deviation around the mean (shaded region). YA15AB and YA15event are represented by light solid and dashed lines. California GMPEs A15 (black dotted) and ASK14 (dashed-dotted) are shown. Event numbers correspond to those in Table S1.
Figure S2. Vertical-component 5% damped Alberta PSAs (circles) for M 3.1 events in Alberta. The average binned vertical-component Oklahoma PSA for equivalent magnitude–distance range is plotted along with ±1 standard deviation around the mean (shaded region). YA15AB and YA15event are represented by light solid and dashed lines. California GMPEs A15 (black dotted) and ASK14 (dashed-dotted) are shown. Event numbers correspond to those in Table S1.
Figure S3. Vertical-component 5% damped Alberta PSAs (circles) for M 3.2–3.3 events in Alberta. The average binned vertical-component Oklahoma PSA for equivalent magnitude–distance range is plotted along with ±1 standard deviation around the mean (shaded region). YA15AB and YA15event are represented by light solid and dashed lines. California GMPEs A15 (black dotted) and ASK14 (dashed-dotted) are shown. Event numbers correspond to those in Table S1.
Figure S4. Vertical-component 5% damped Alberta PSAs (circles) for M 3.4–3.5 events in Alberta. The average binned vertical-component Oklahoma PSA for equivalent magnitude–distance range is plotted along with ±1 standard deviation around the mean (shaded region). YA15AB and YA15event are represented by light solid and dashed lines. California GMPEs A15 (black dotted) and ASK14 (dashed-dotted) are shown. Event numbers correspond to those in Table S1.
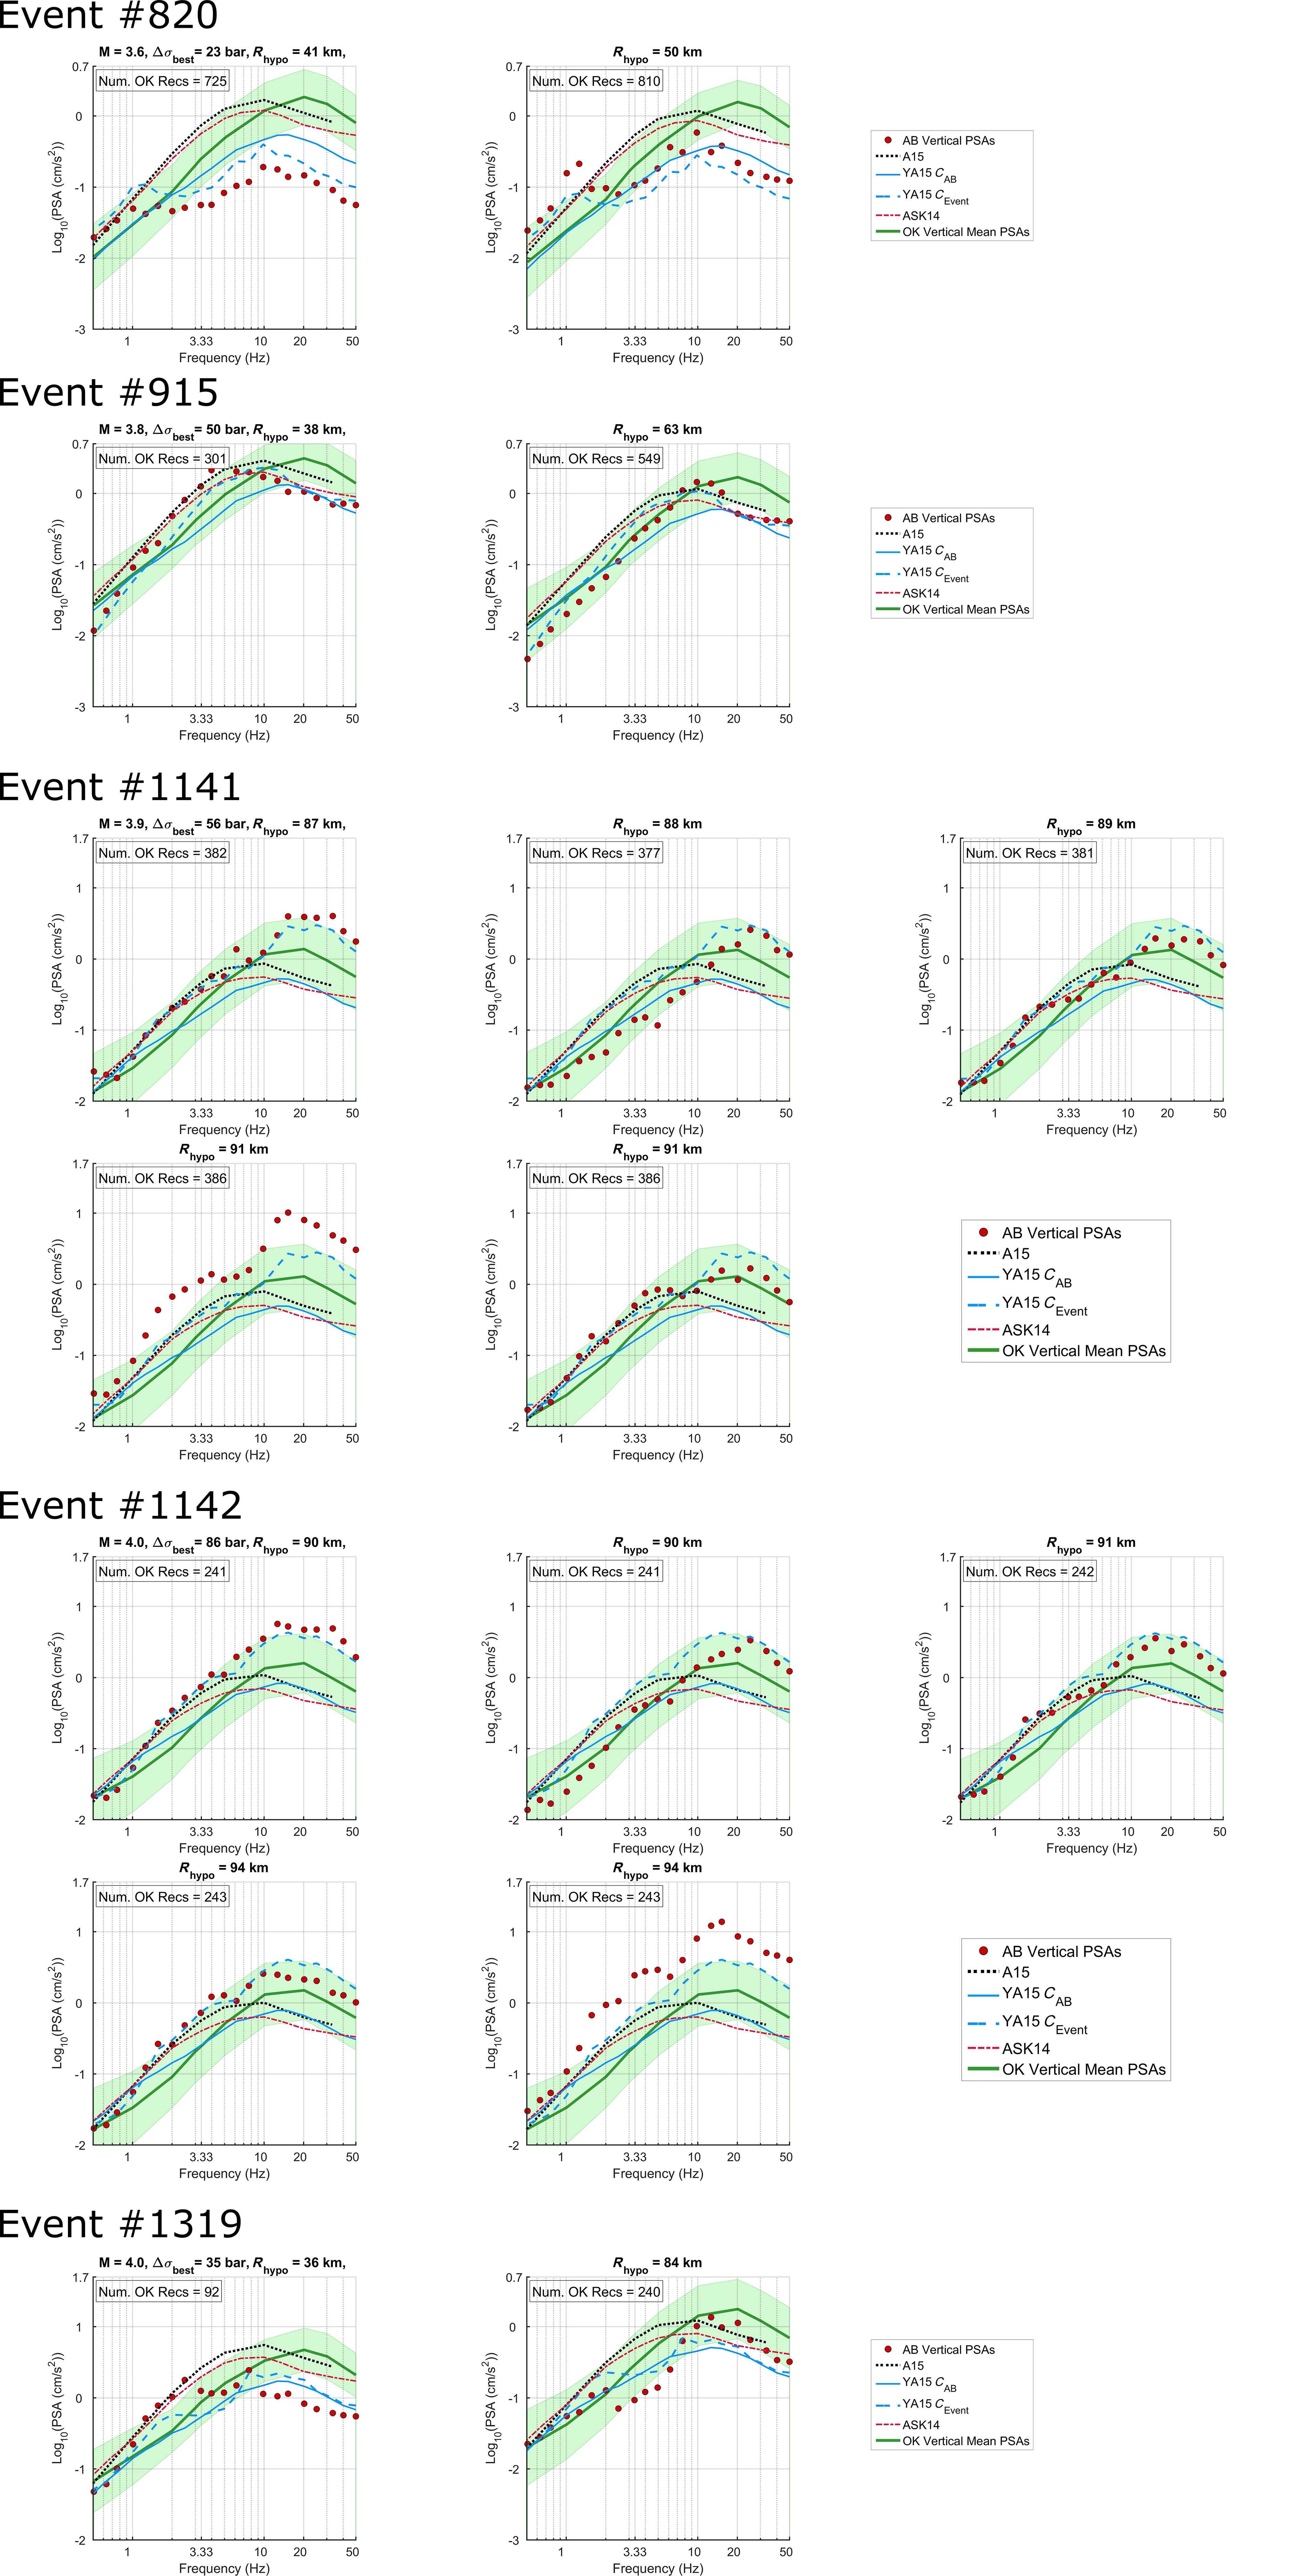
Figure S5. Vertical-component 5% damped Alberta PSAs (circles) for M 3.6–4.0 events in Alberta. The average binned vertical-component Oklahoma PSA for equivalent magnitude–distance range is plotted along with ±1 standard deviation around the mean (shaded region). YA15AB and YA15event are represented by light solid and dashed lines. California GMPEs A15 (black dotted) and ASK14 (dashed-dotted) are shown. Event numbers correspond to those in Table S1.
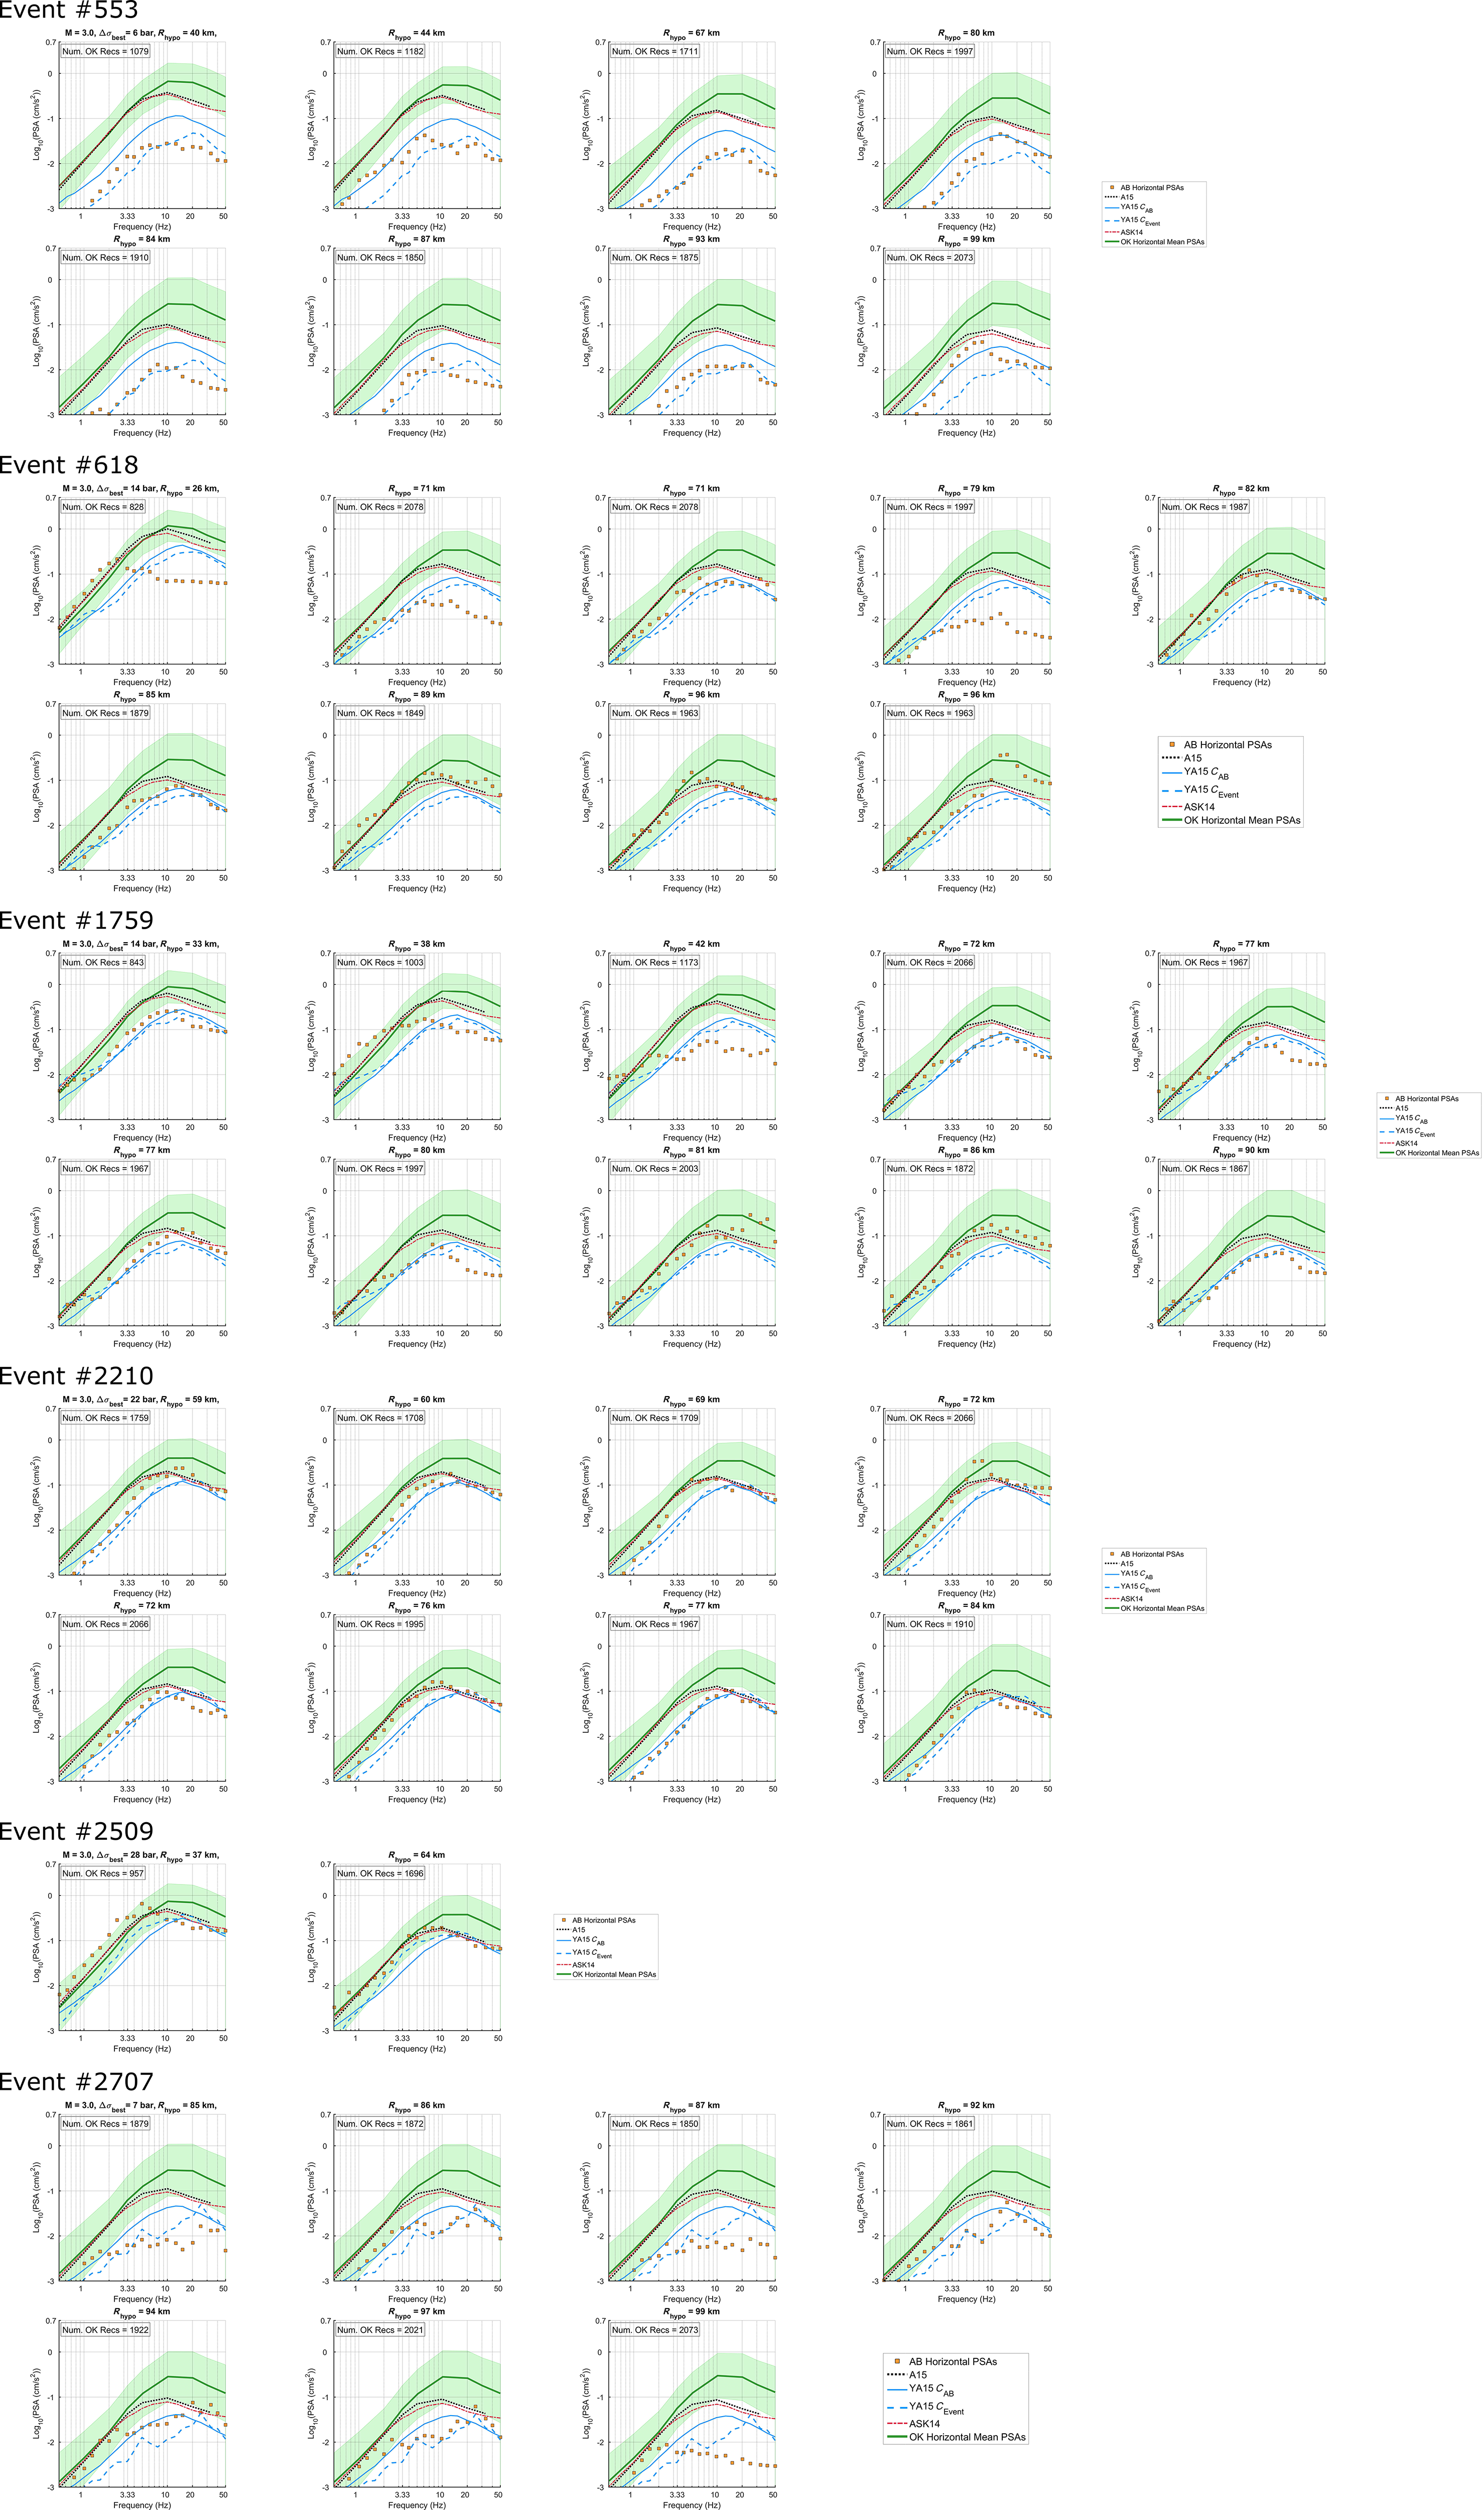
Figure S6. Horizontal-component 5% damped Alberta PSAs (squares) for M 3.0 events in Alberta. The average binned horizontal-component Oklahoma PSA for equivalent magnitude–distance range is plotted along with ±1 standard deviation around the mean (shaded region). YA15AB and YA15event are represented by light solid and dashed lines. California GMPEs A15 (black dotted) and ASK14 (dashed-dotted) are shown. Event numbers correspond to those in Table S1.
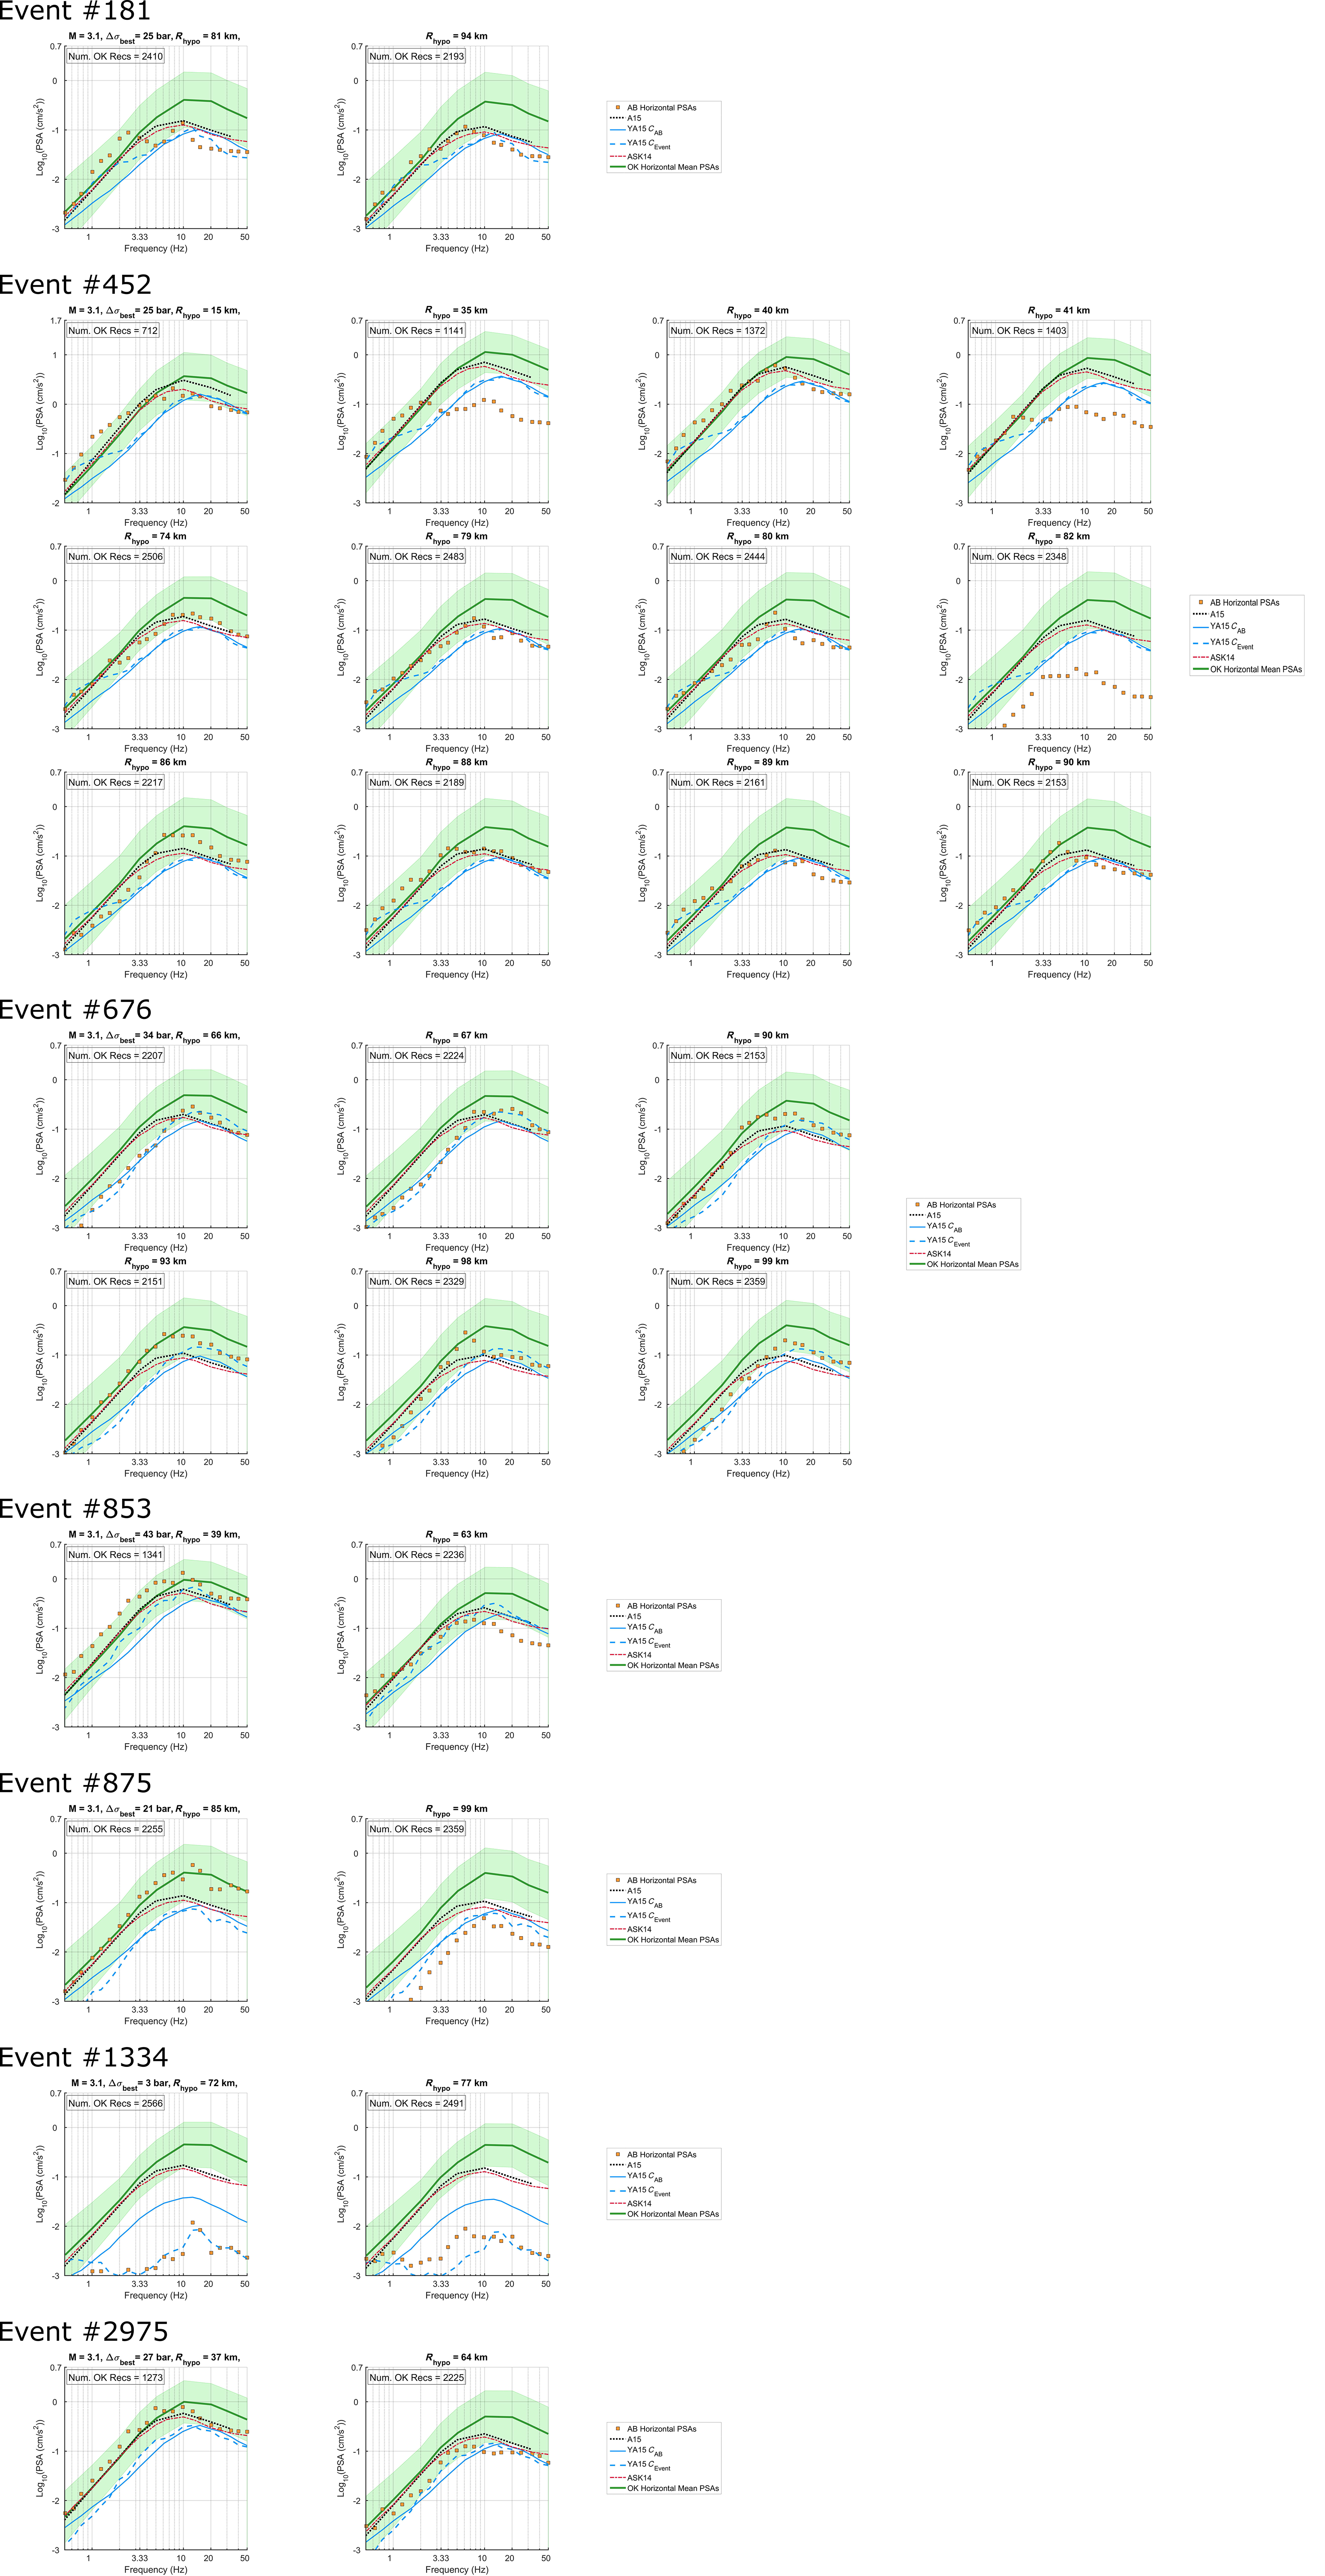
Figure S7. Horizontal-component 5% damped Alberta PSAs (squares) for M 3.1 events in Alberta. The average binned horizontal-component Oklahoma PSA for equivalent magnitude–distance range is plotted along with ±1 standard deviation around the mean (shaded region). YA15AB and YA15event are represented by light solid and dashed lines. California GMPEs A15 (black dotted) and ASK14 (dashed-dotted) are shown. Event numbers correspond to those in Table S1.
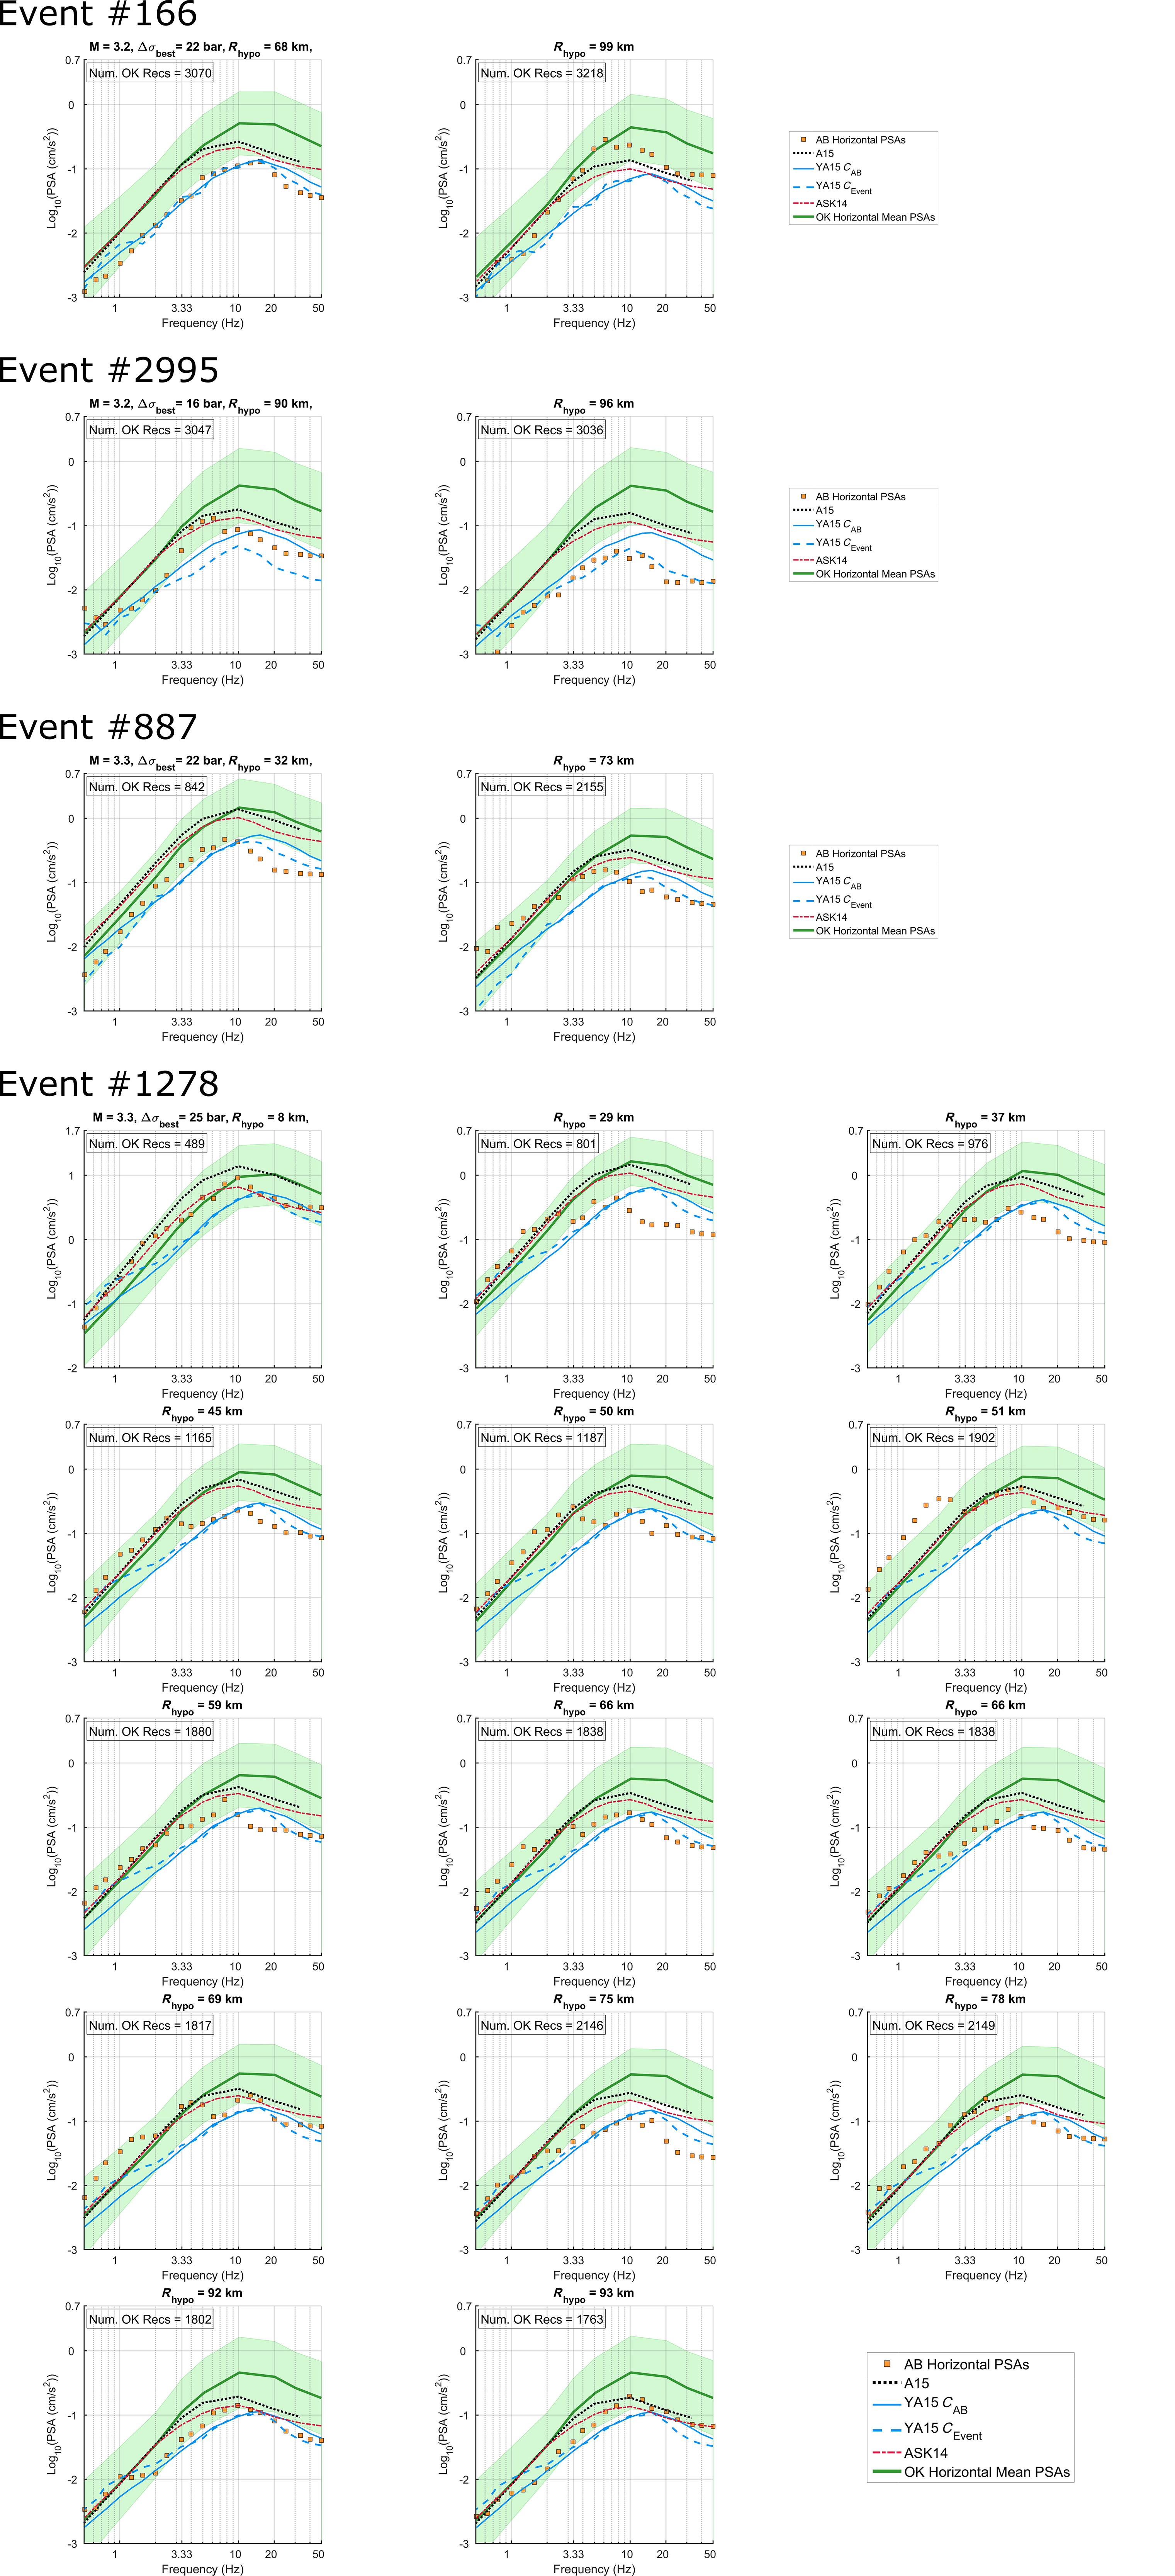
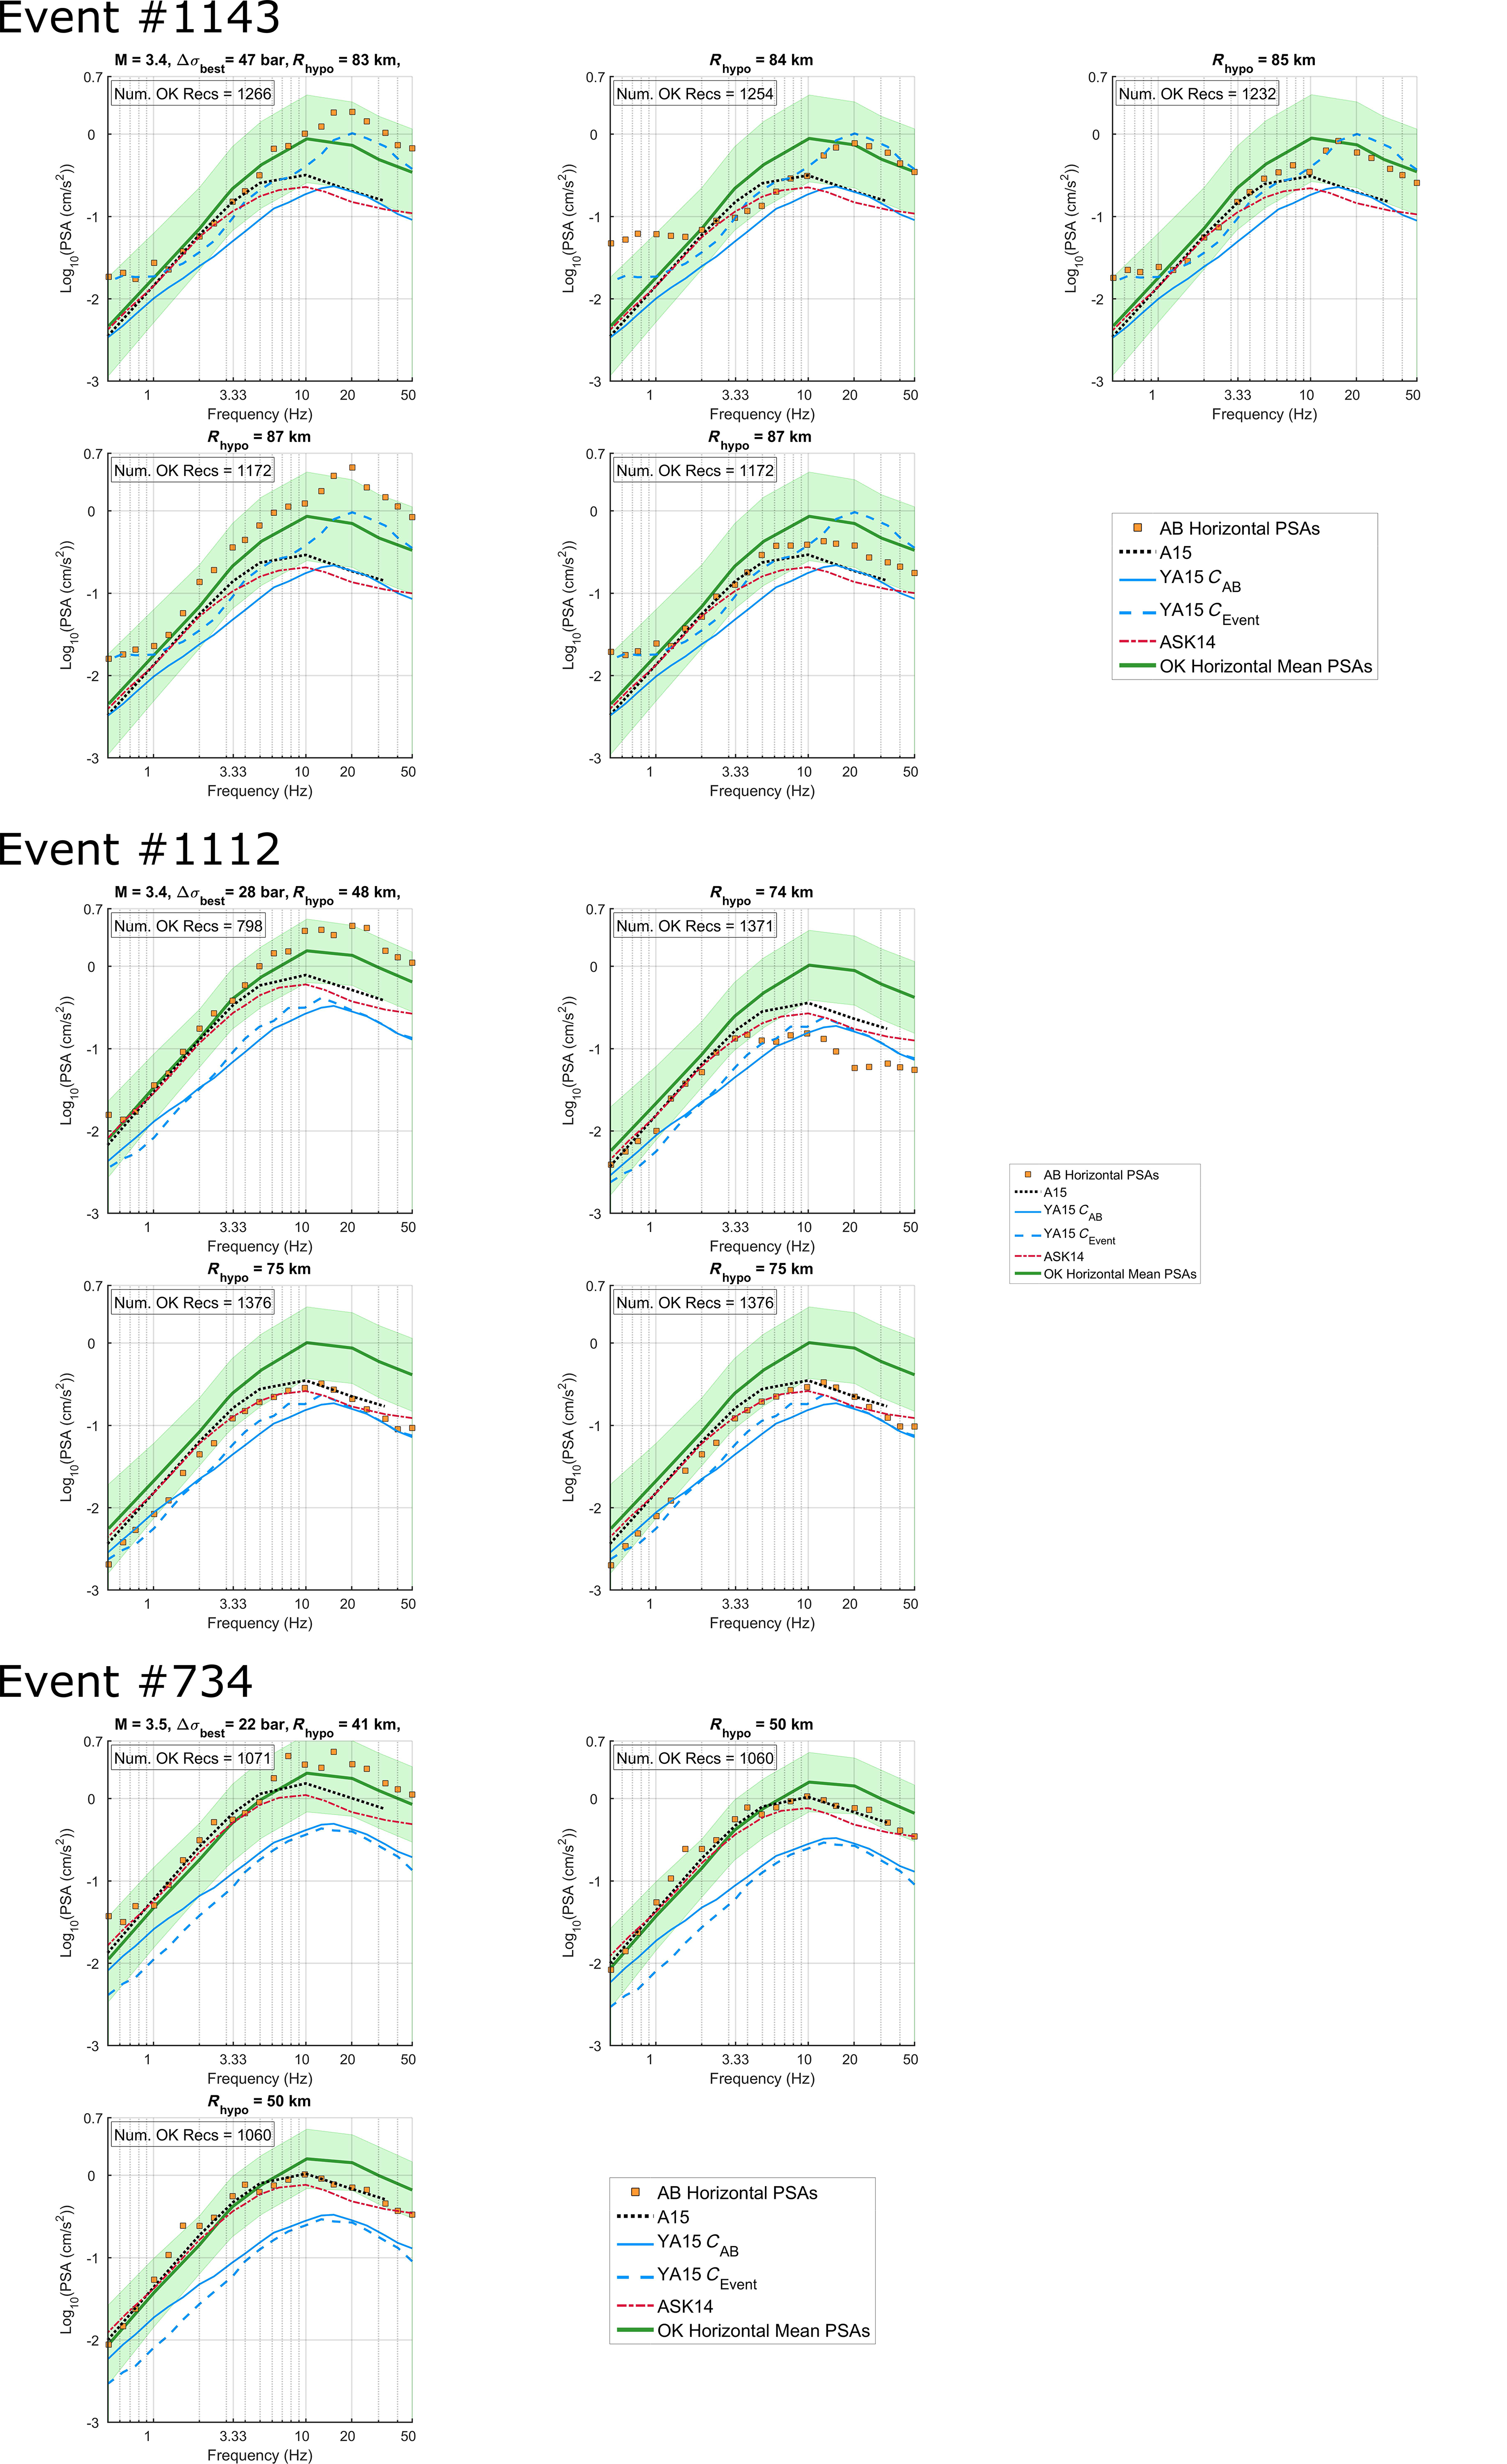
Figure S8. Horizontal-component 5% damped Alberta PSAs (squares) for M 3.2–3.3 events in Alberta. The average binned horizontal-component Oklahoma PSA for equivalent magnitude–distance range is plotted along with ±1 standard deviation around the mean (shaded region). YA15AB and YA15event are represented by light solid and dashed lines. California GMPEs A15 (black dotted) and ASK14 (dashed-dotted) are shown. Event numbers correspond to those in Table S1.
Figure S9. Horizontal-component 5% damped Alberta PSAs (squares) for M 3.4–3.5 events in Alberta. The average binned horizontal-component Oklahoma PSA for equivalent magnitude–distance range is plotted along with ±1 standard deviation around the mean (shaded region). YA15AB and YA15event are represented by light solid and dashed lines. California GMPEs A15 (black dotted) and ASK14 (dashed-dotted) are shown. Event numbers correspond to those in Table S1.
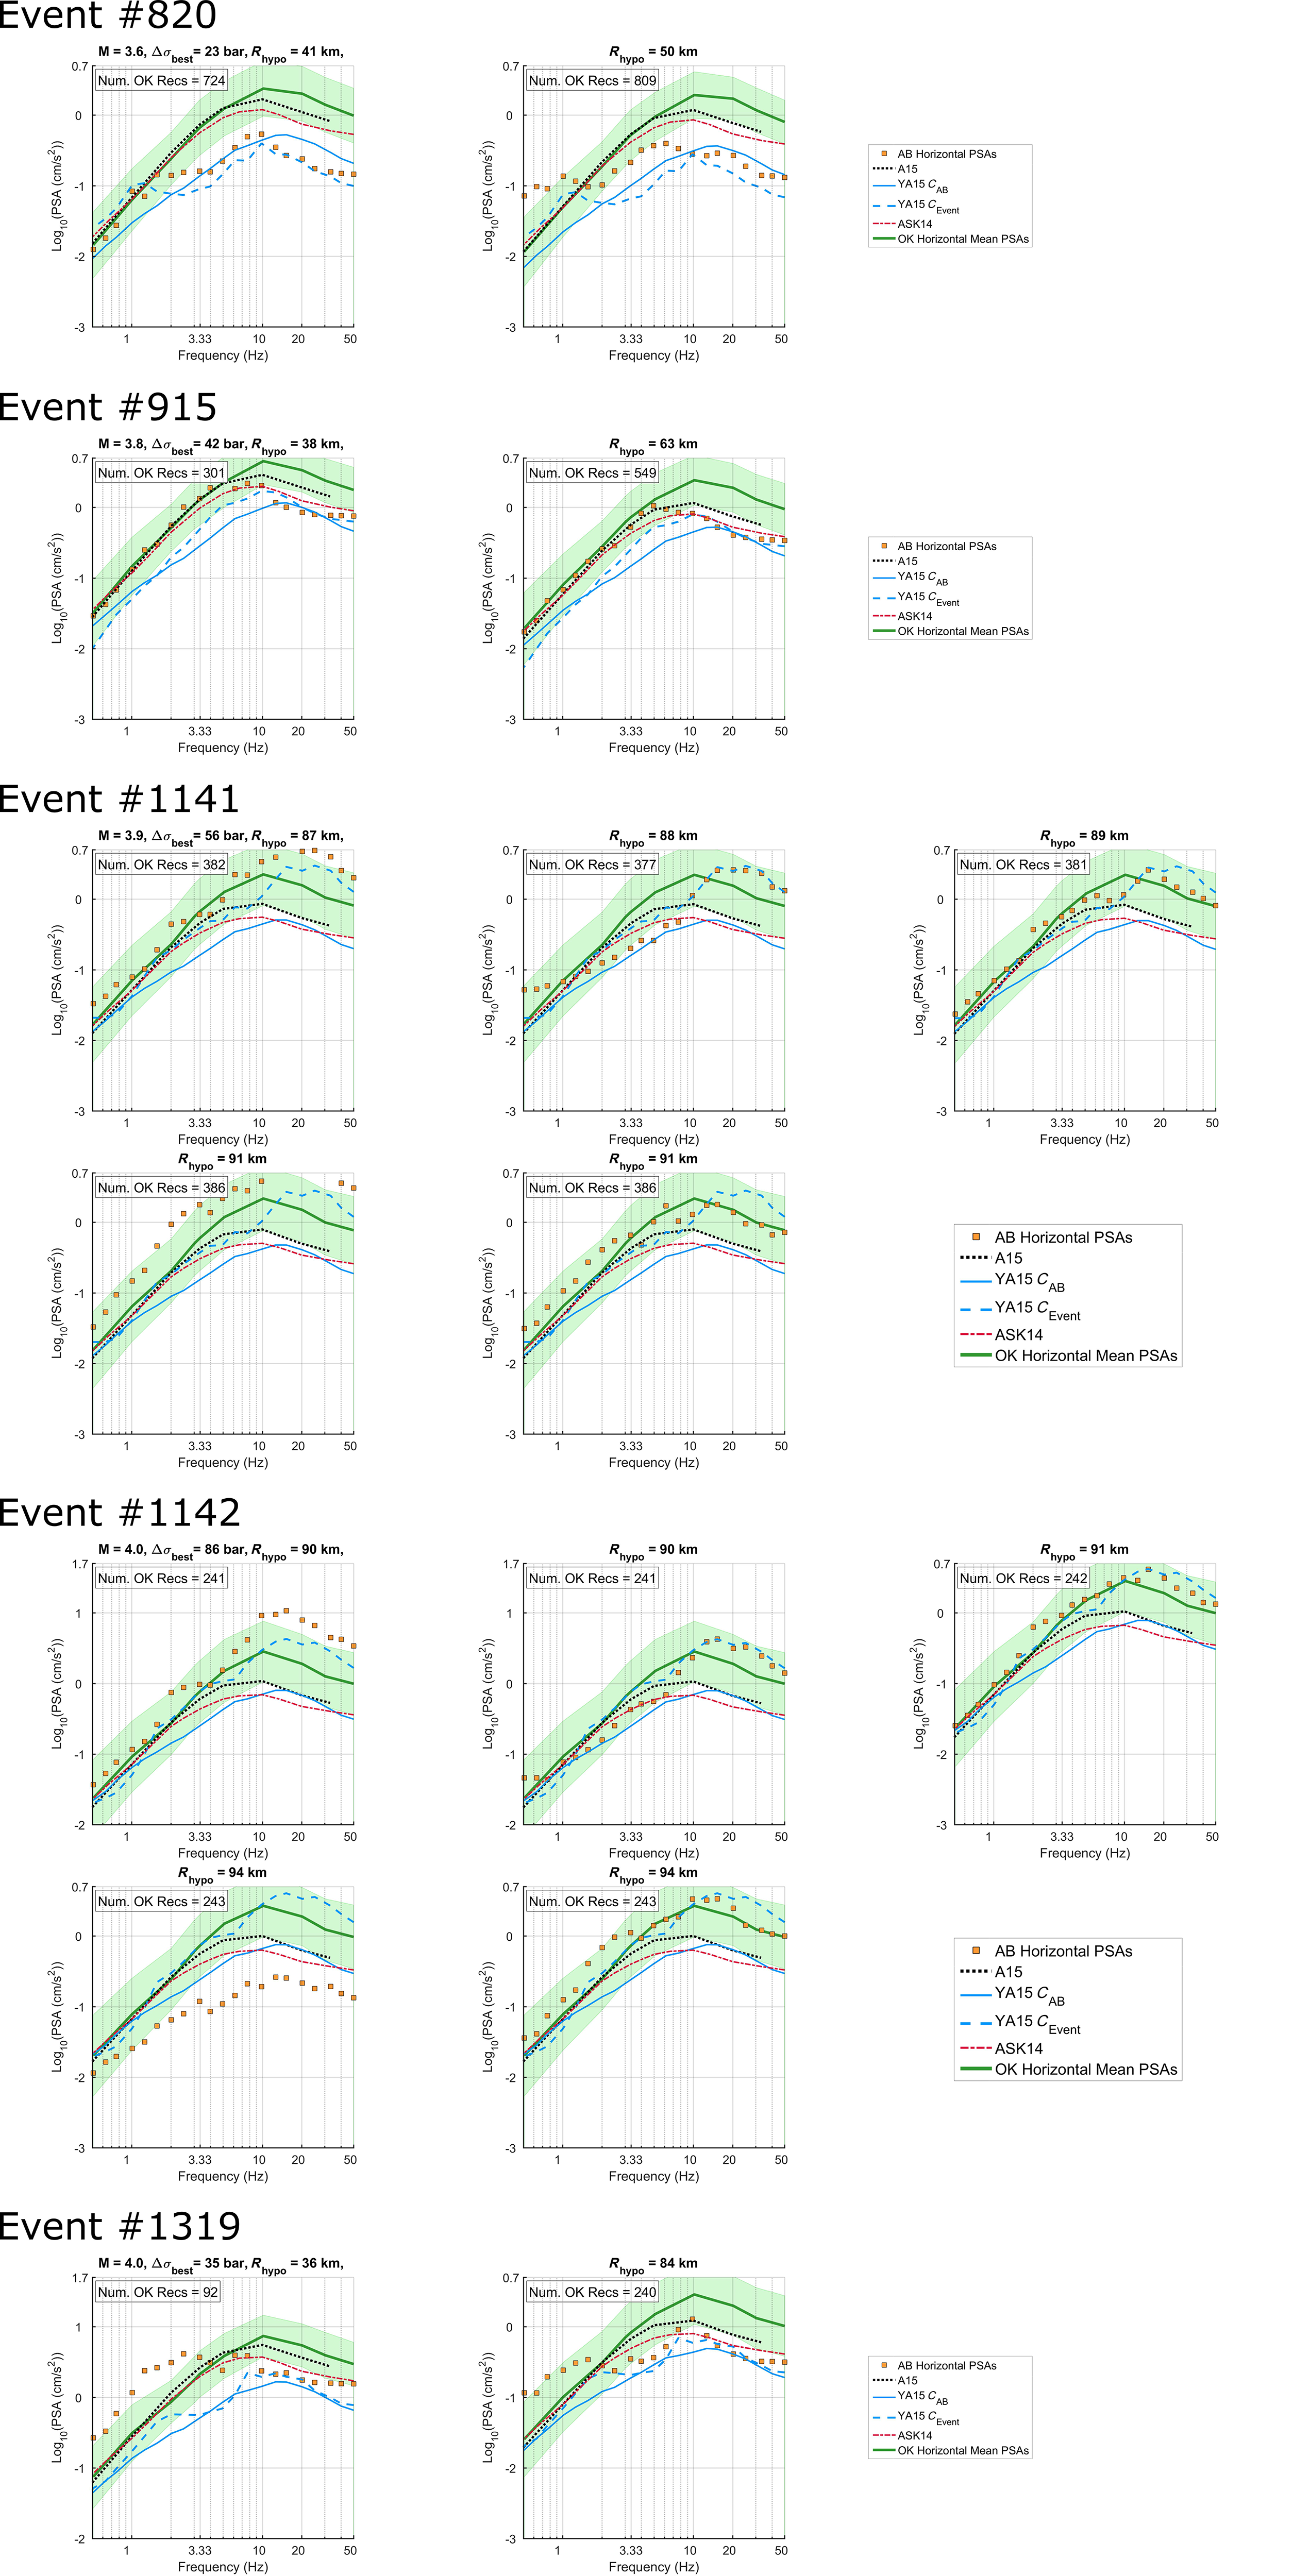
Figure S10. Horizontal-component 5% damped Alberta PSAs (squares) for M 3.6–4.0 events in Alberta. The average binned horizontal-component Oklahoma PSA for equivalent magnitude–distance range is plotted along with ±1 standard deviation around the mean (shaded region). YA15AB and YA15event are represented by light solid and dashed lines. California GMPEs A15 (black dotted) and ASK14 (dashed-dotted) are shown. Event numbers correspond to those in Table S1.
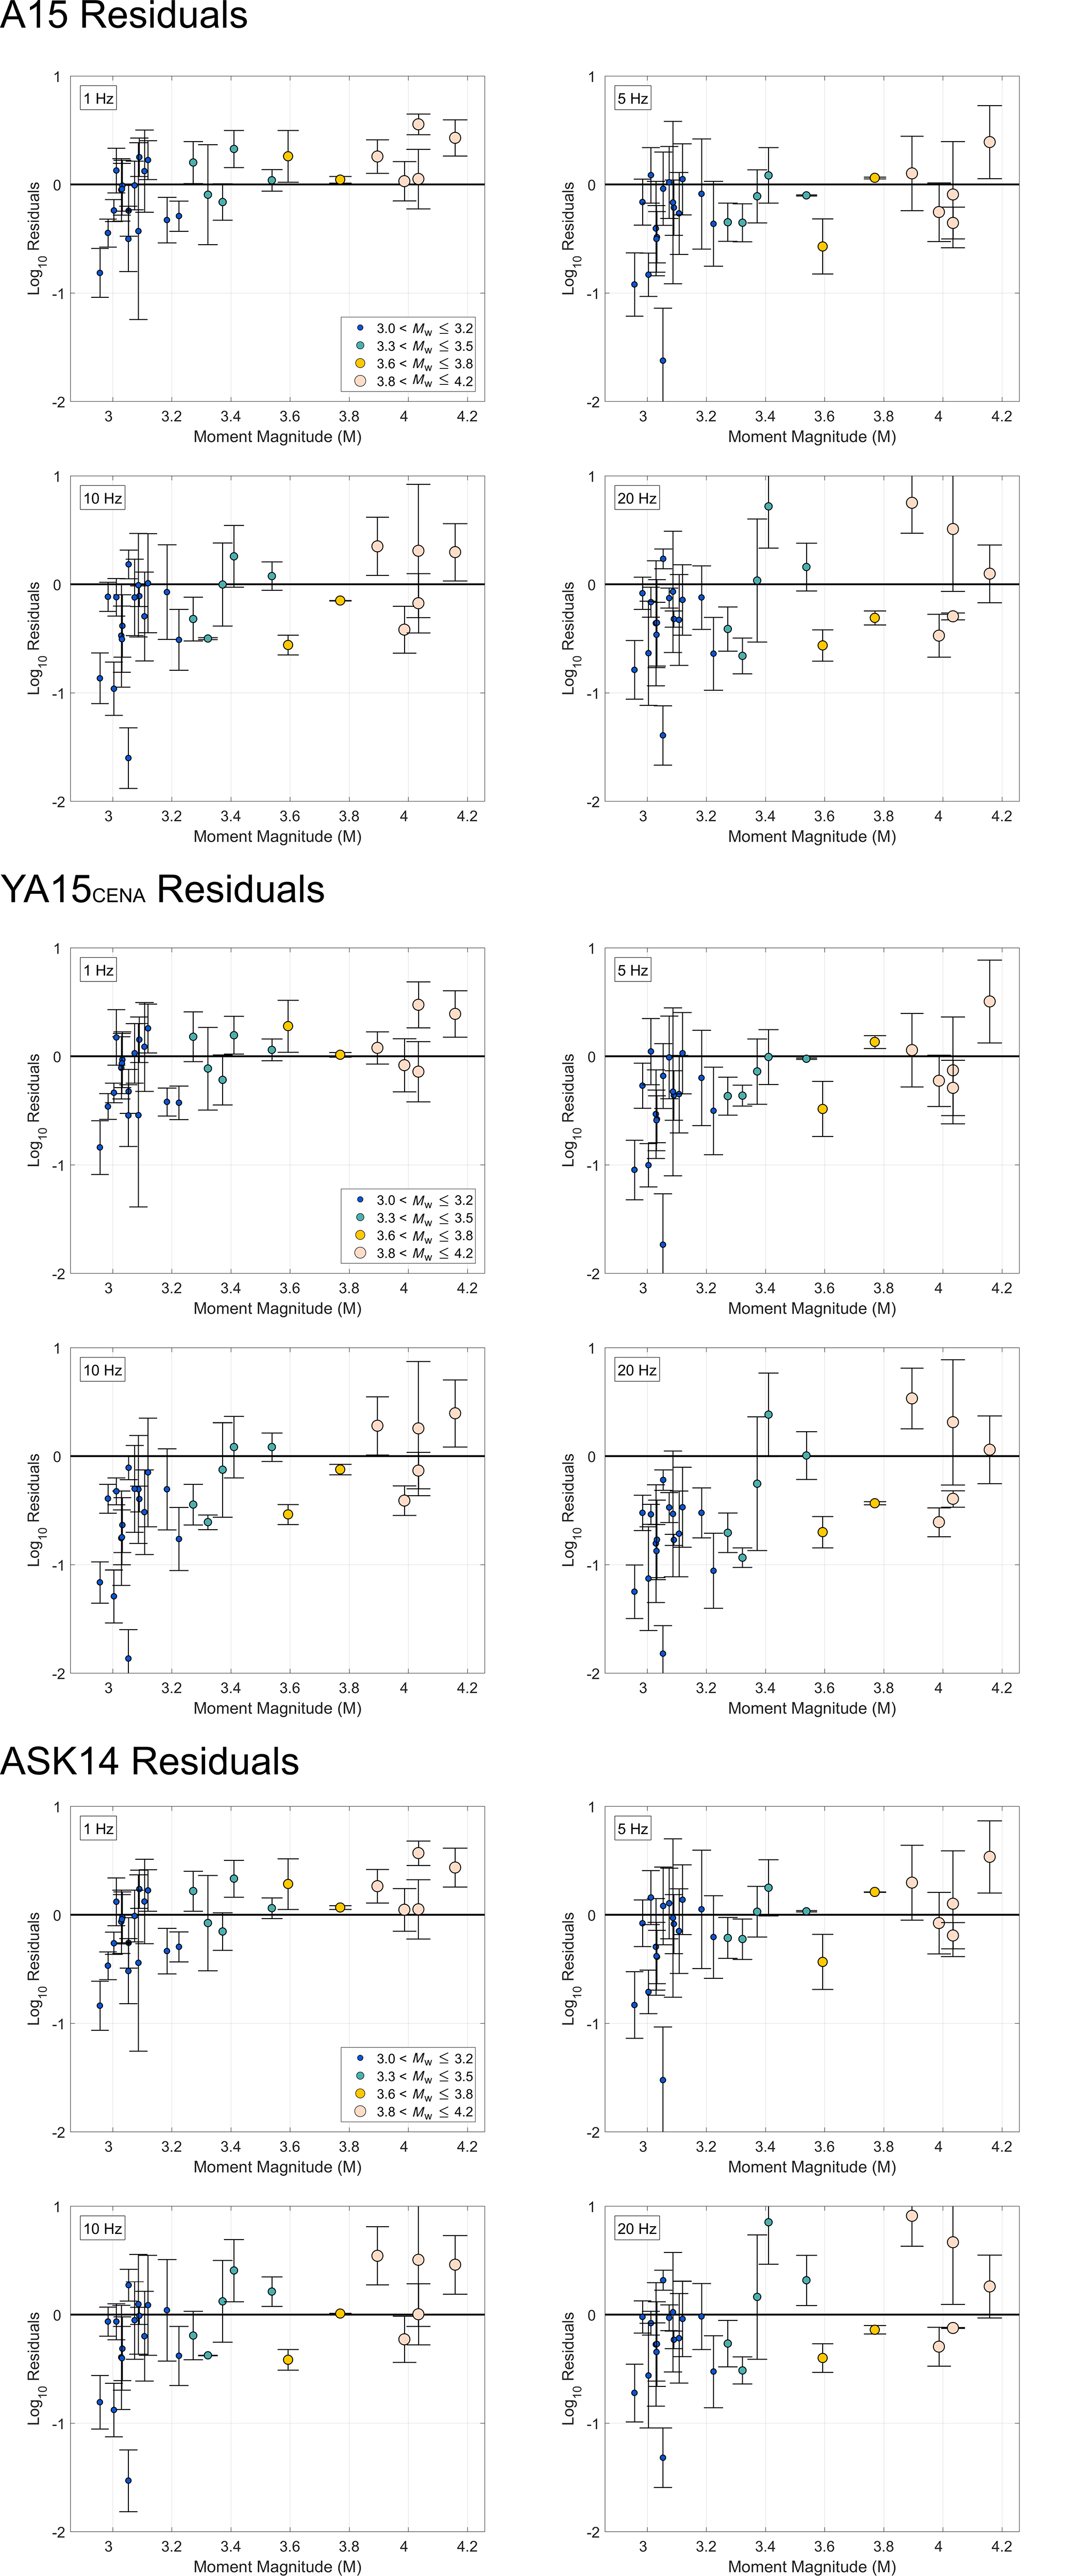
Figure S11. Average log10 residuals versus magnitude for horizontal-component Alberta PSAs (all records), with respect to PSA predicted by A15 (top), YA15CENA (focal depth = 2 km; middle), and ASK14 (bottom) at 1, 5, 10, and 20 Hz. Marker sizes indicate magnitude bins of Alberta events. Error bars denote the standard deviation of the residuals for each event.
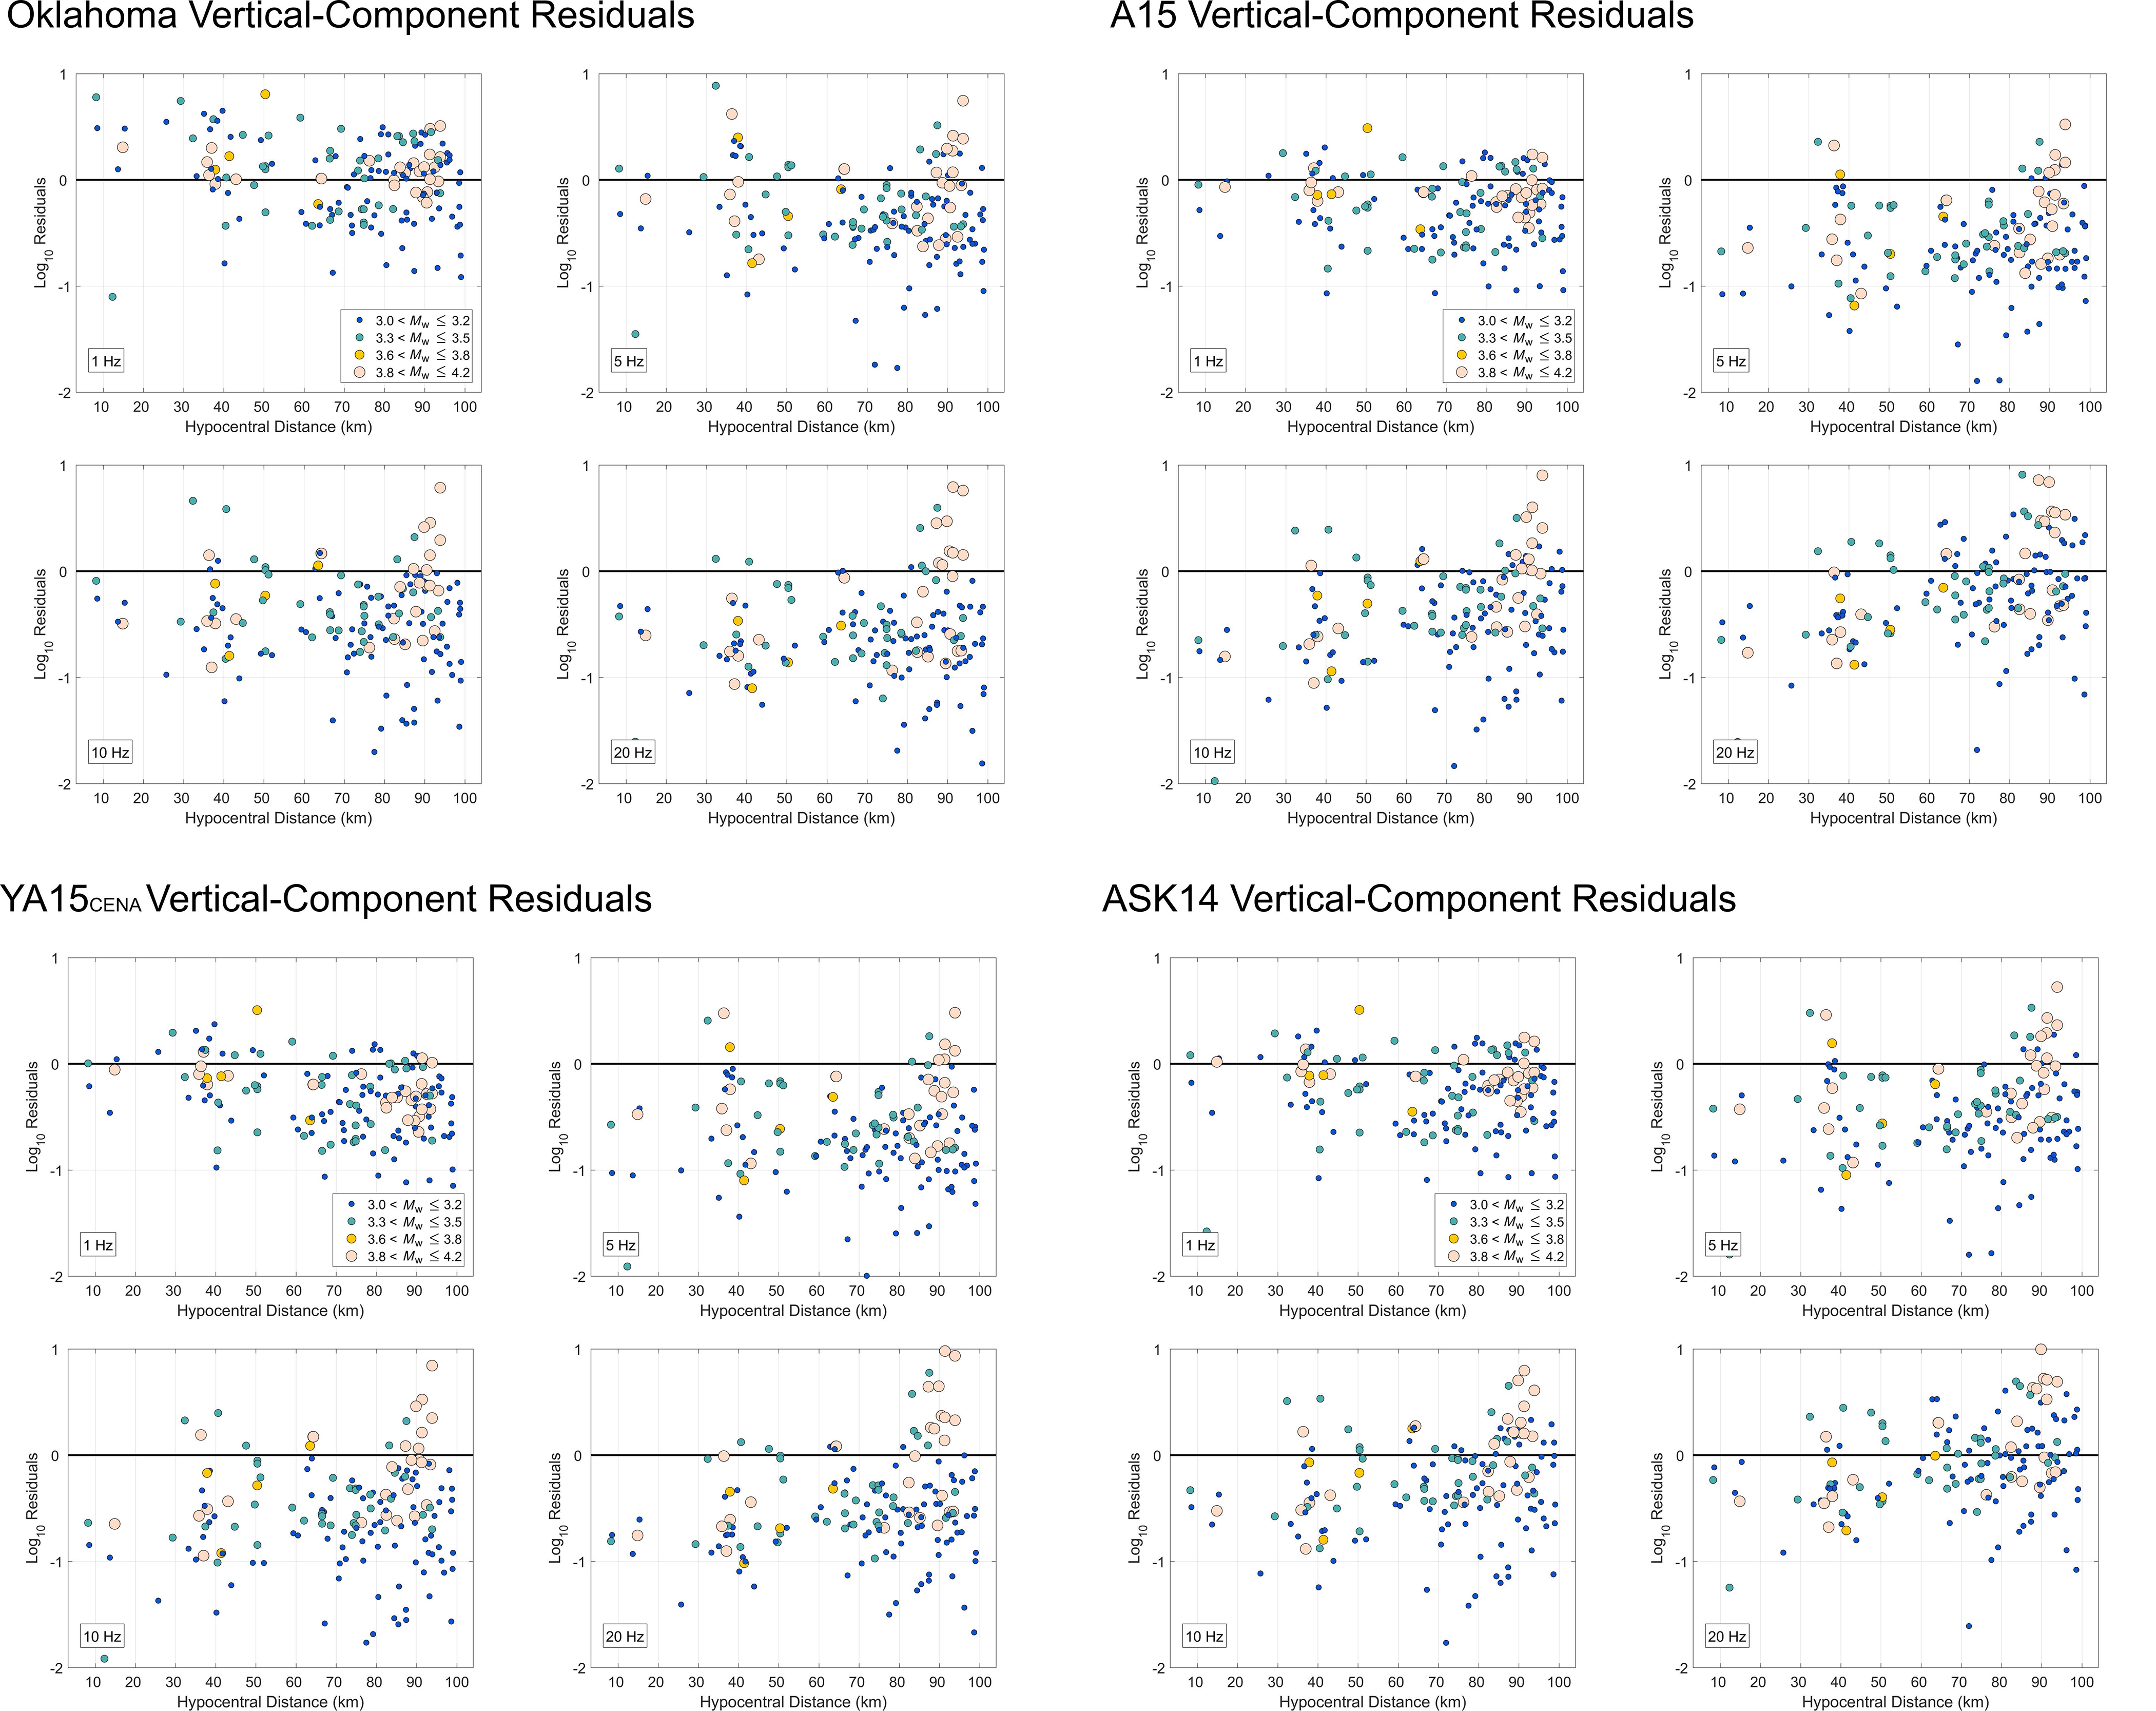
Figure S12. Log10 residuals versus hypocentral distance for vertical-component Alberta PSAs (all records), with respect to Oklahoma binned-average vertical-component PSAs (top left), and PSA predicted by A15 (top right), YA15CENA (focal depth = 2 km; bottom left), and ASK14 (with depth-to-rupture modification for induced events; bottom right) at 1, 5, 10, and 20 Hz. Marker sizes indicate magnitude bins of Alberta events.
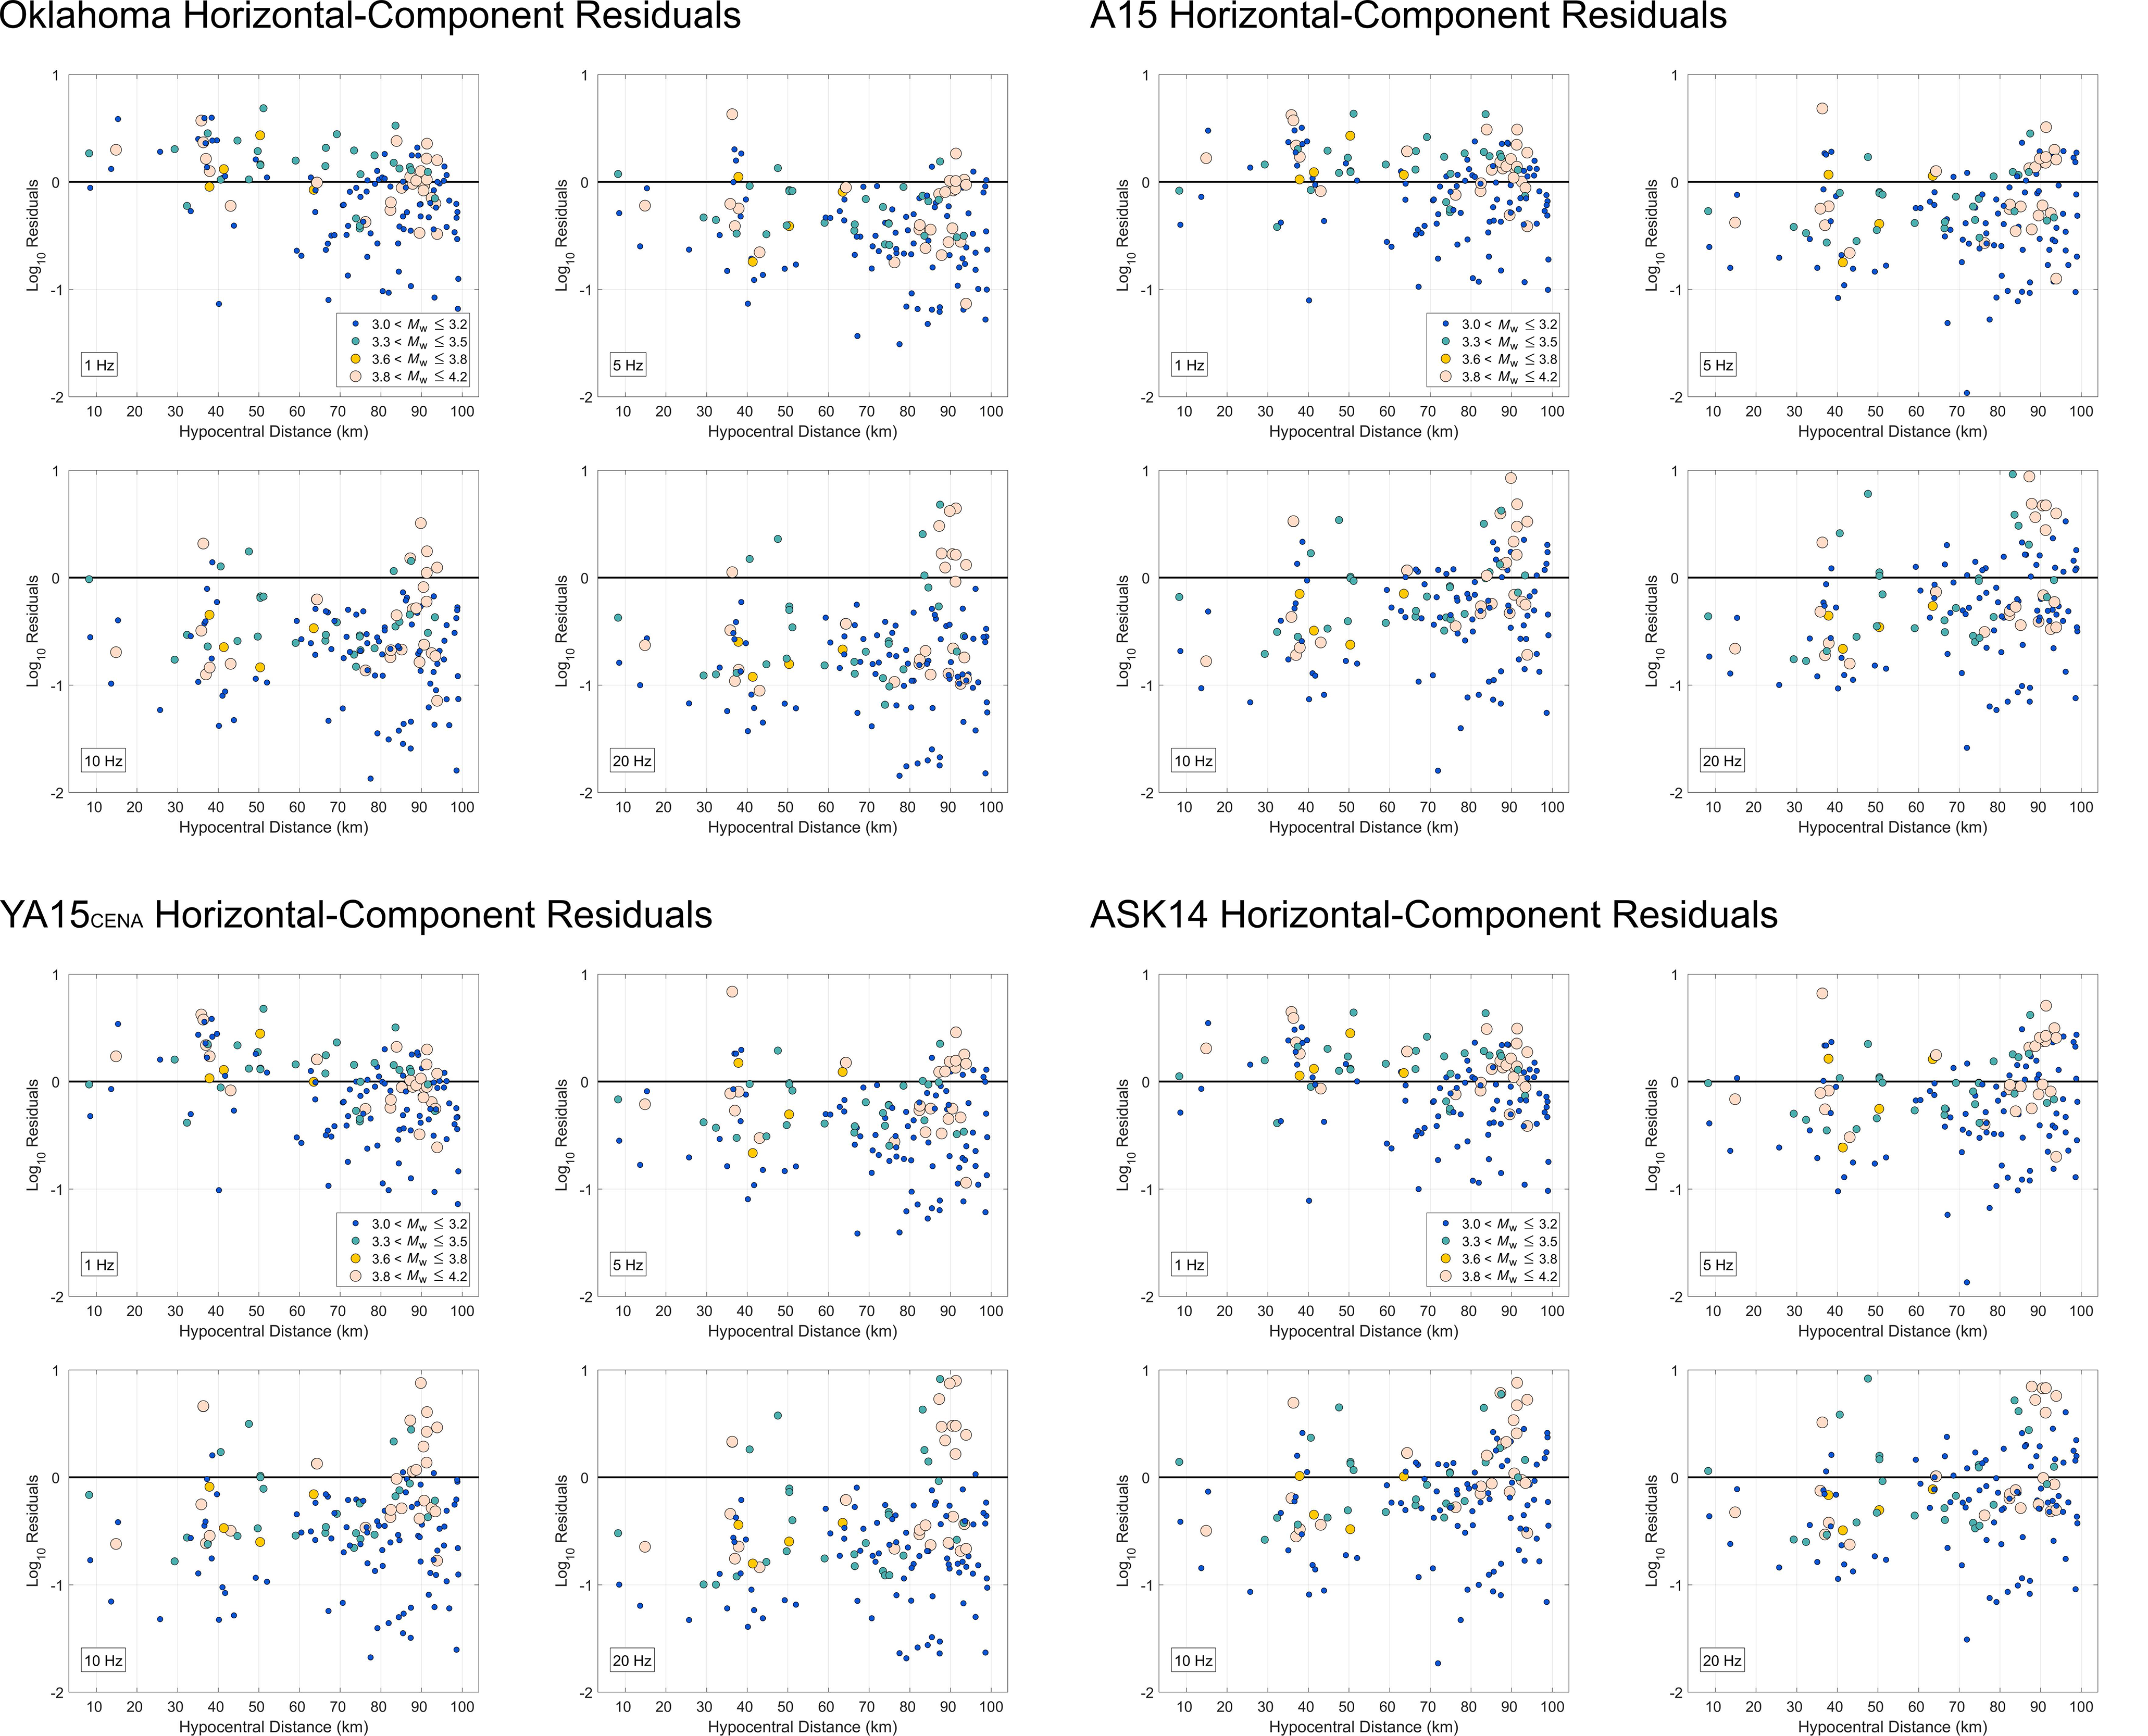
Figure S13. Log10 residuals versus hypocentral distance for horizontal-component Alberta PSAs (all records) with respect to Oklahoma binned-average horizontal-component PSAs (top left), and PSA predicted by A15 (top right), YA15CENA (focal depth = 2 km; bottom left), and ASK14 (with depth-to-rupture modification for induced events; bottom right) at 1, 5, 10, and 20 Hz. Marker sizes indicate magnitude bins of Alberta events.
Abrahamson, N. A., W. J. Silva, and R. Kamai (2014). Summary of the Abrahamson, Silva, and Kamai NGA-West2 ground-motion relations for active crustal regions, Earthq. Spectra 30, 1025–1056.
Atkinson, G. (2015). Ground-motion prediction equation for small-to-moderate events at short hypocentral distances, with application to induced seismicity hazards, Bull. Seismol. Soc. Am. 105, no. 2A, 981, doi: 10.1785/0120140142.
Yenier, E., and G. Atkinson (2015). Regionally adjustable generic ground-motion prediction equation based on equivalent point-source simulations: Application to Central and Eastern North America, Bull. Seismol. Soc. Am. 105, 1989–2009.
[ Back ]