This electronic supplement contains Figures S1–S17 showing (a) residual distributions over time for stations discussed in the main article with no timing, location, or pick corrections applied; (b) residual distributions over time after the application of timing corrections given in Table 1 in the main article or location corrections given in the Station Location Corrections section in the main article or pick corrections described in the SHGR section in the main article; and (c) P-wave ray paths for the station during the period of interest.
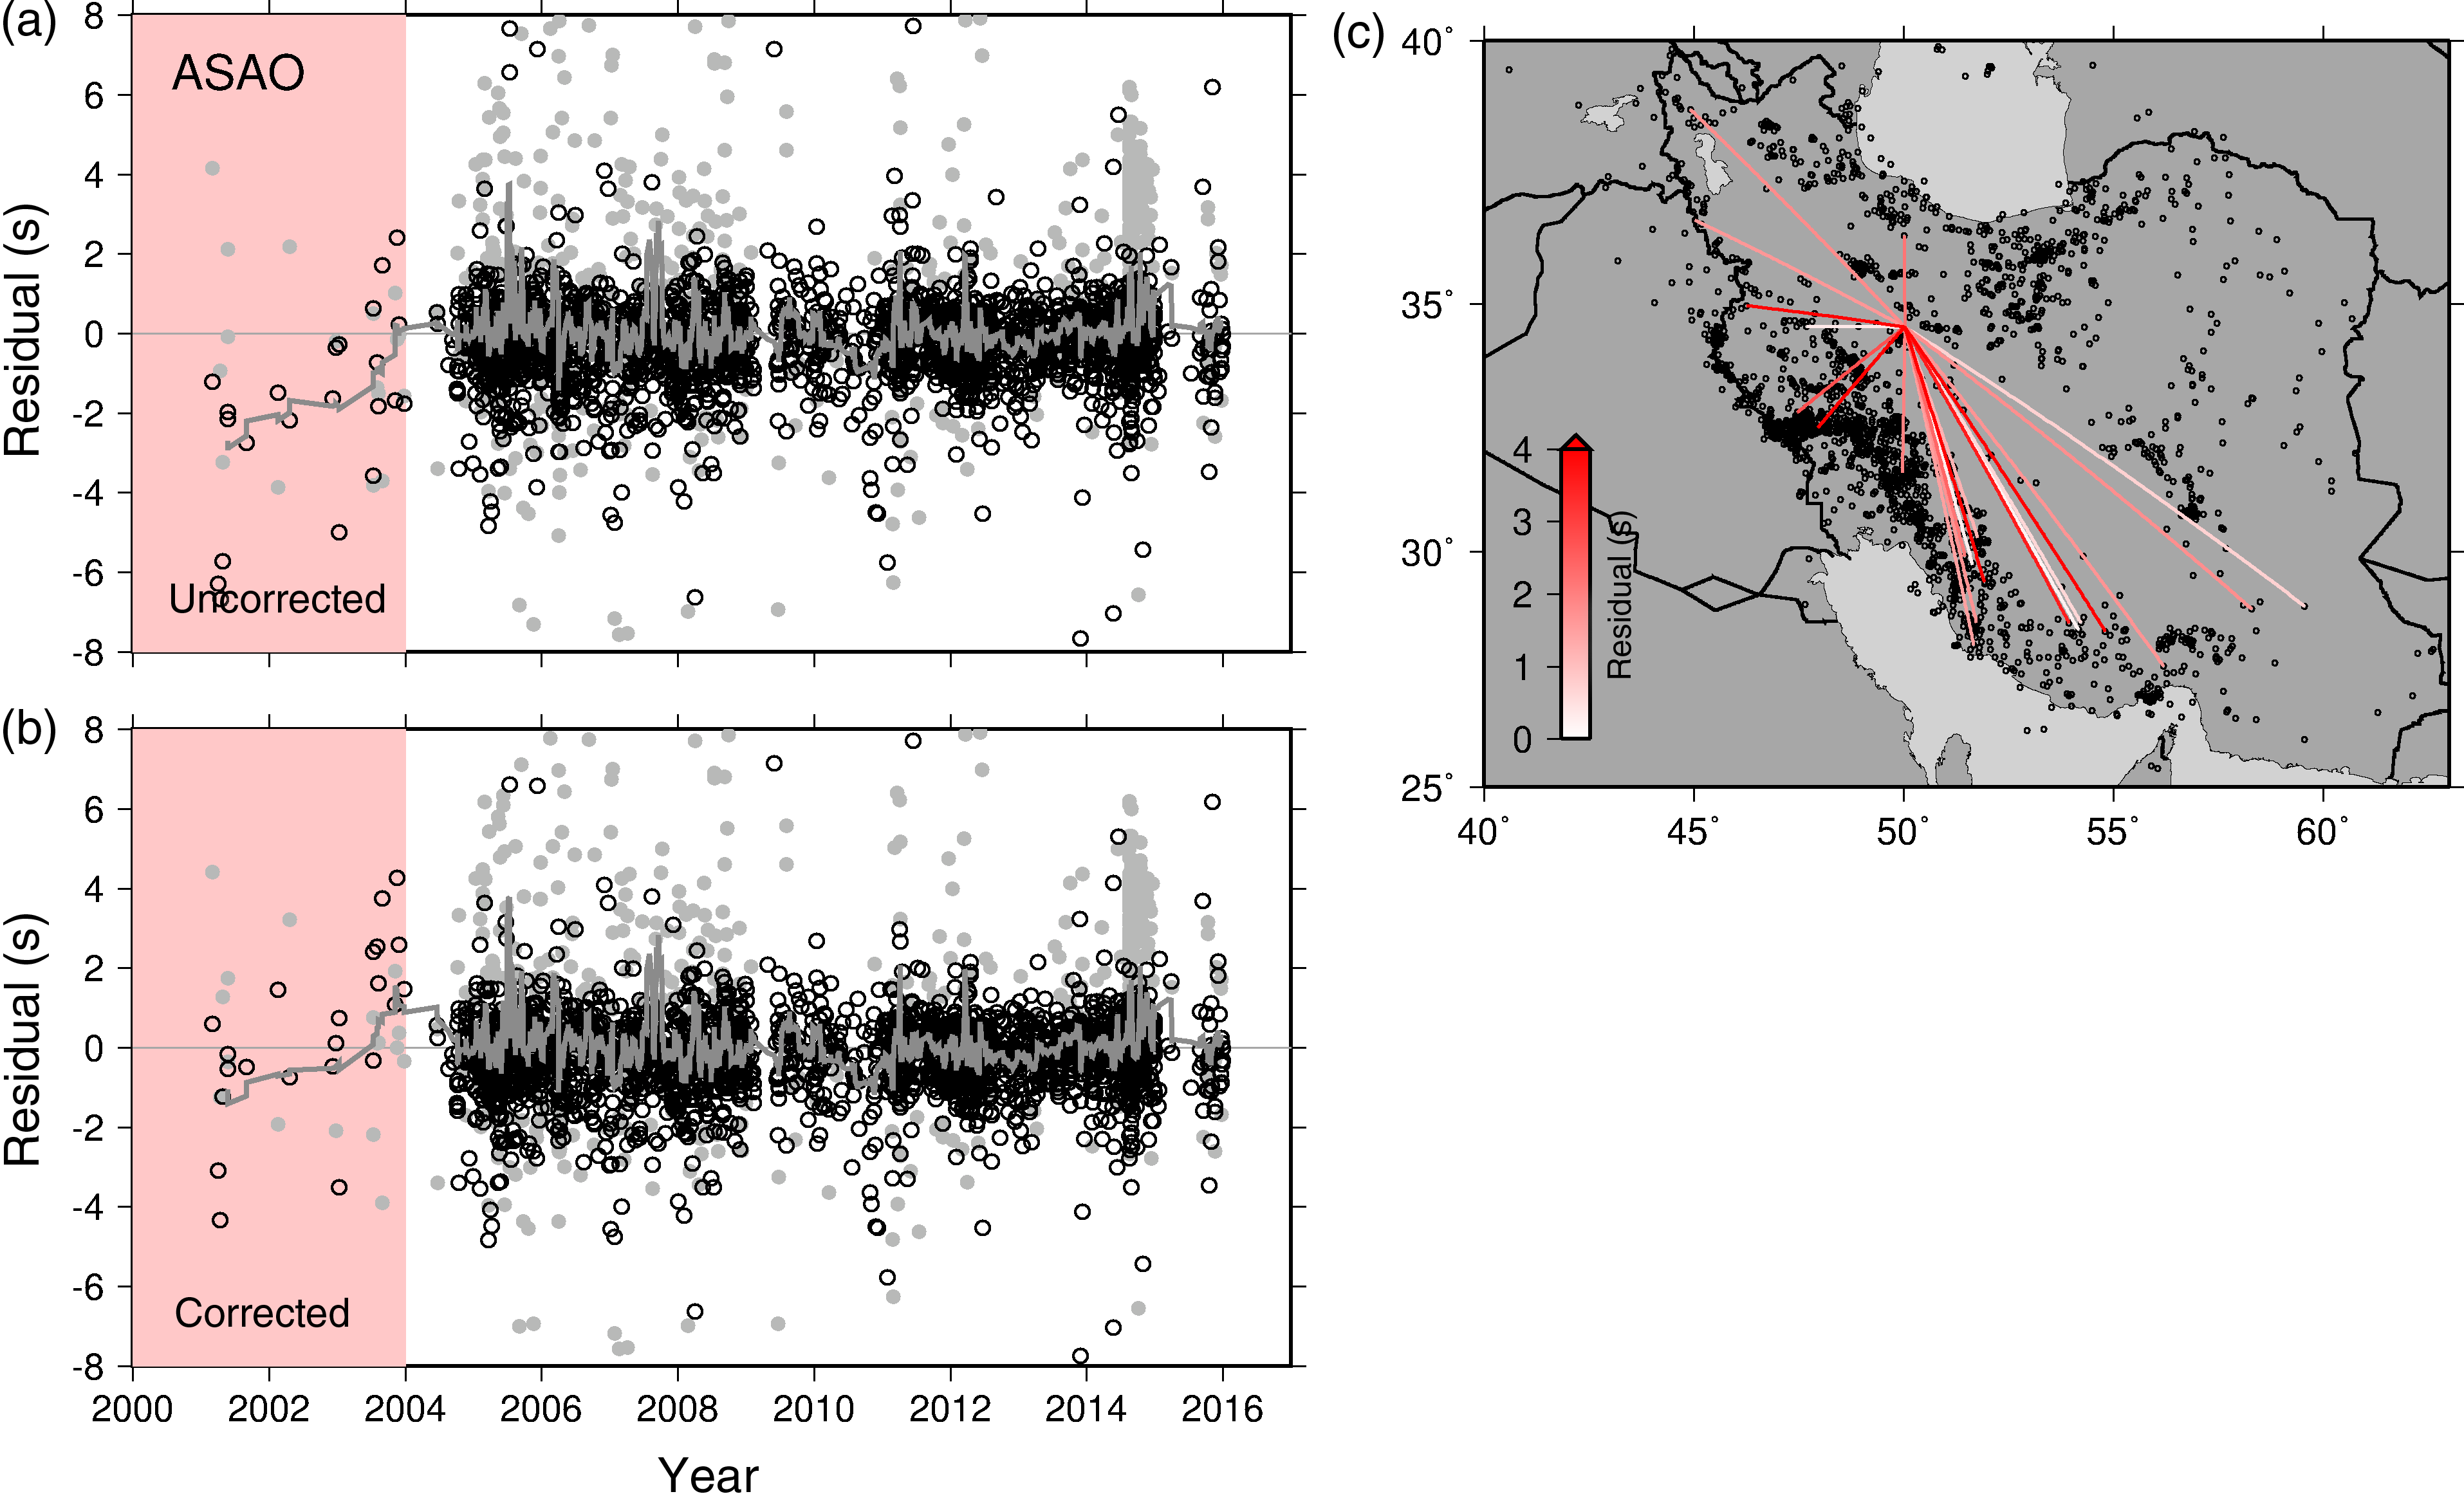
Figure S1. (a) Uncorrected residuals over time for Station ASAO. The period of interest is highlighted in pink. P-wave residuals are shown as open circles, and S-wave residuals are shown as gray circles. The jagged gray line shows the 20-point moving average of all residuals over time. (b) Residuals over time, with those in the period of interest corrected by 4.5 s (Table 1 in the main article). (c) Ray paths for P waves recorded at Station ASAO during the period of interest. Small circles show the locations of all earthquakes recorded at Station ASAO, and line color indicates the magnitude of the residual.
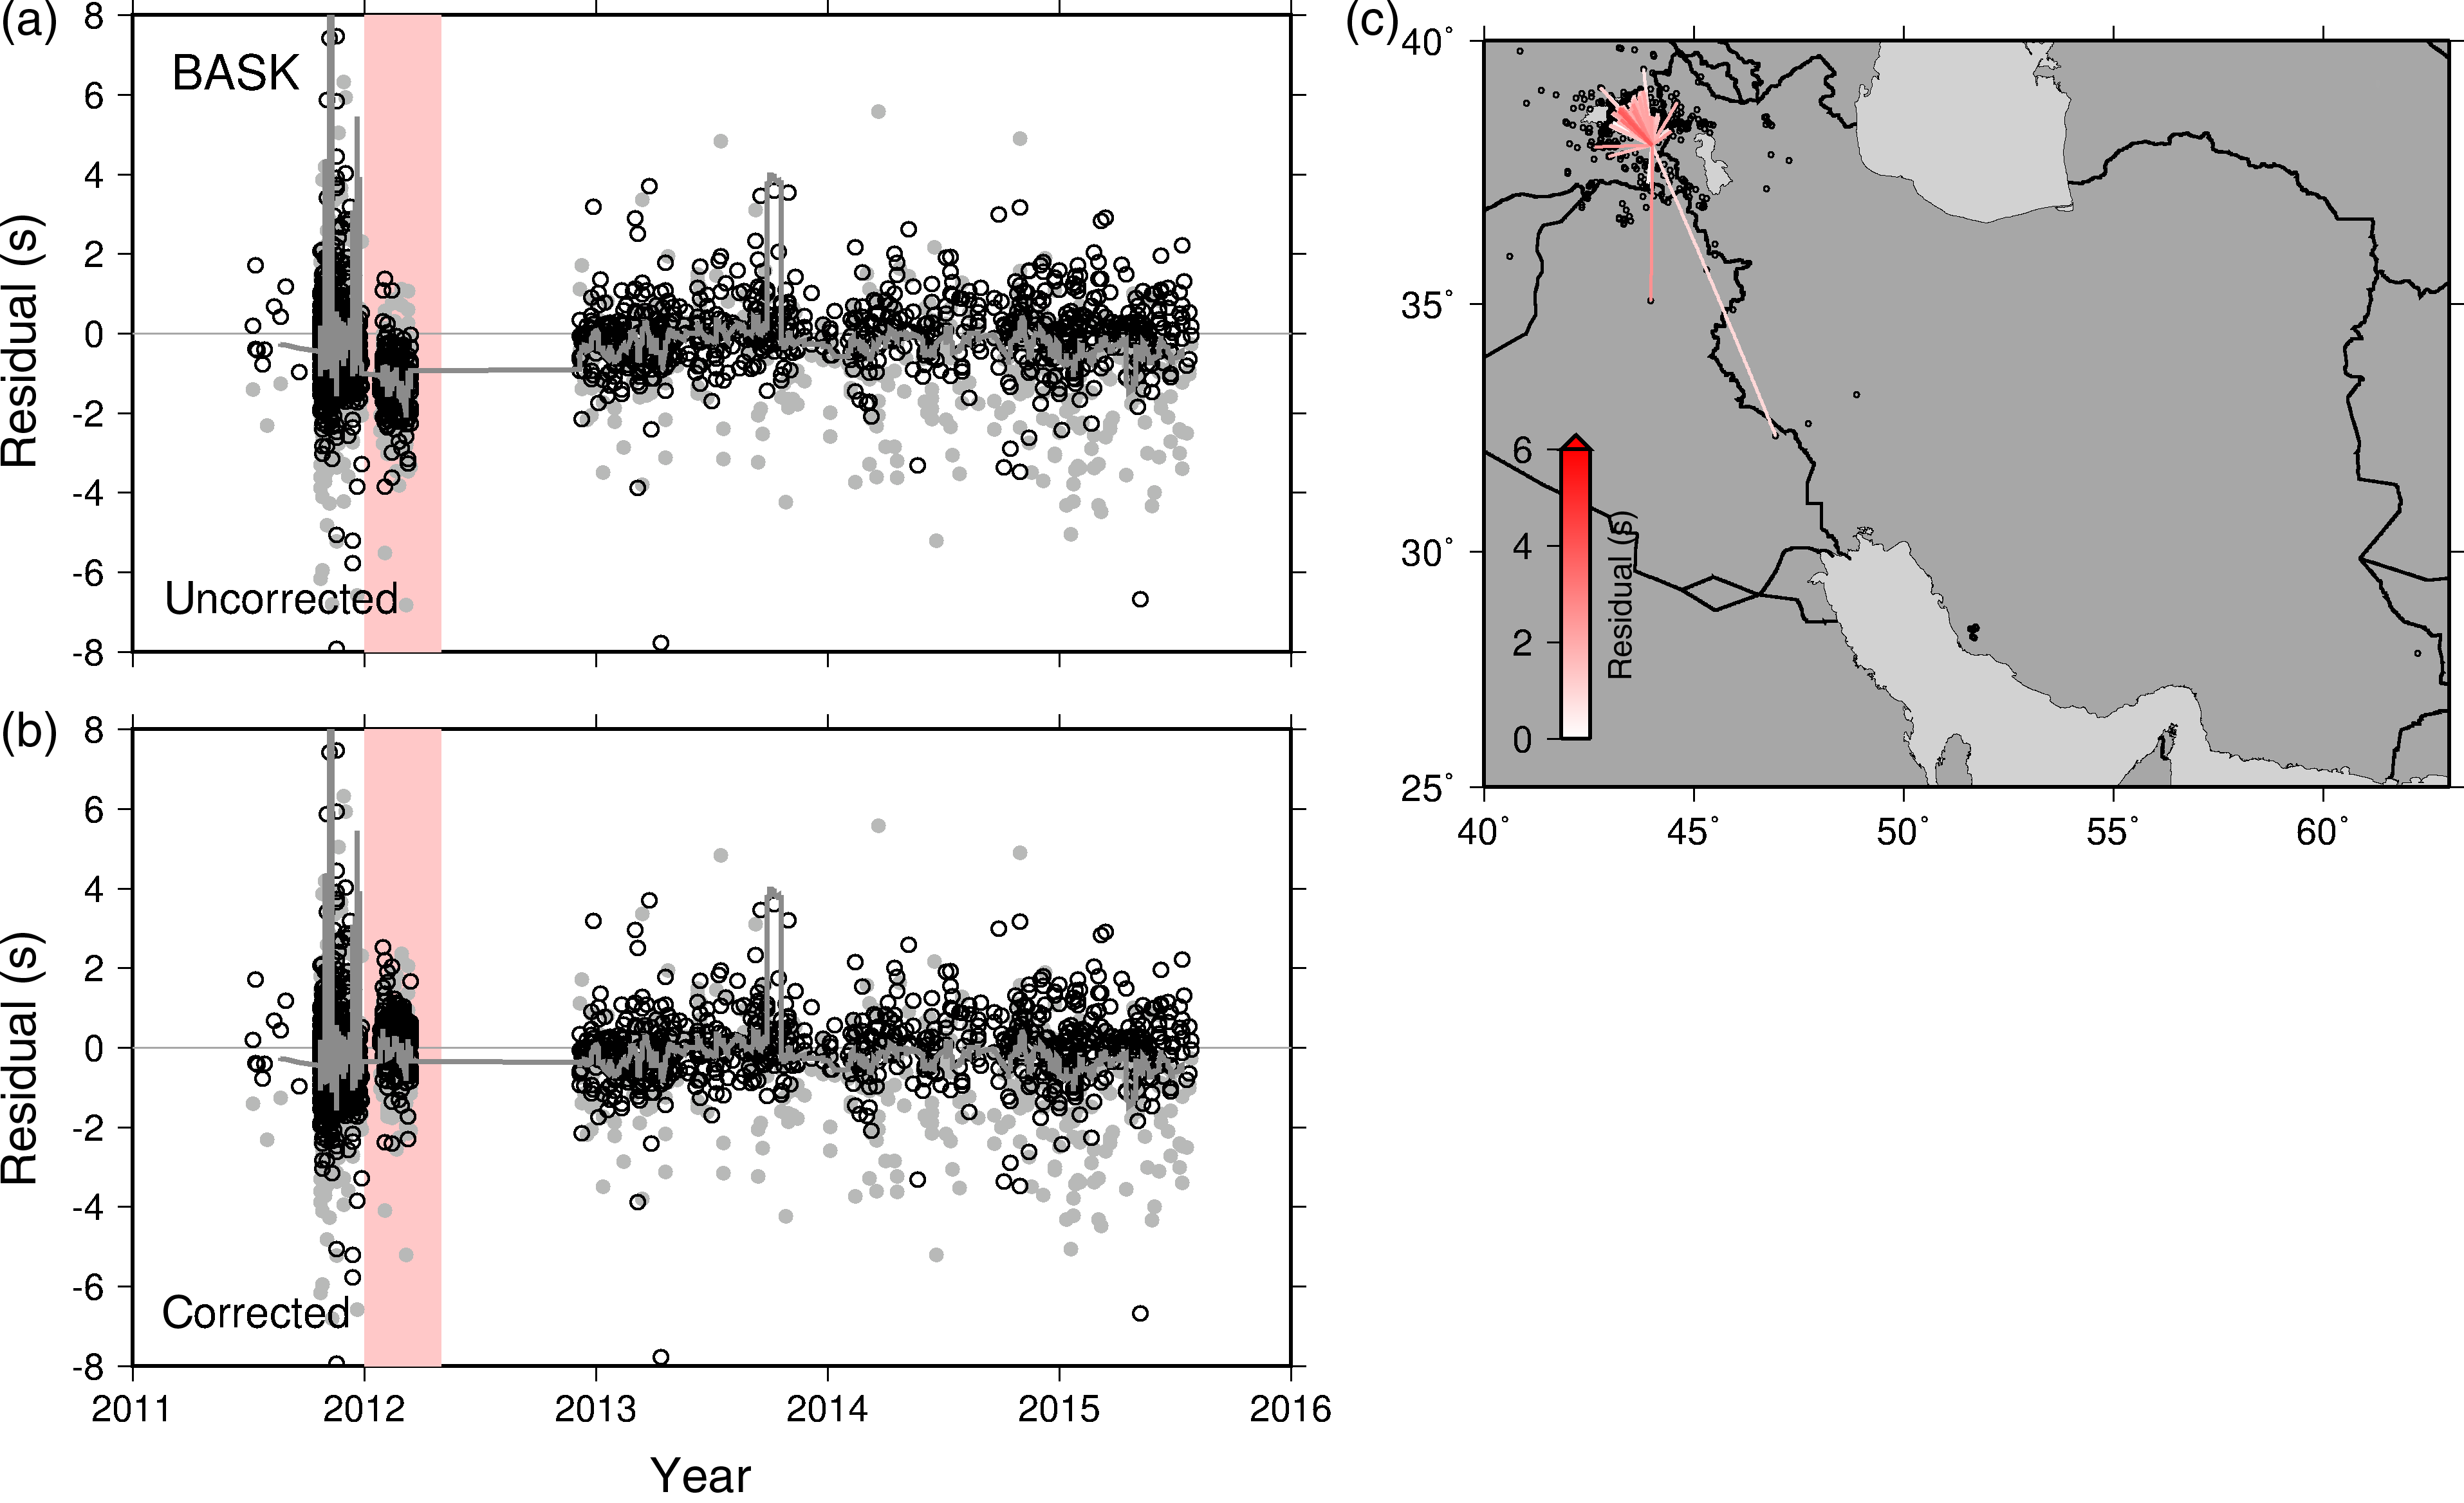
Figure S2. (a) Uncorrected residuals over time for Station BASK. The period of interest is highlighted in pink. P-wave residuals are shown as open circles, and S-wave residuals are shown as gray circles. The jagged gray line shows the 20-point moving average of all residuals over time. (b) Residuals over time, with those in the period of interest corrected by 1.8 s (Table 1 in the main article). (c) Ray paths for P waves recorded at Station BASK during the period of interest. Small circles show the locations of all earthquakes recorded at Station BASK, and line color indicates the magnitude of the residual.
Figure S3. (a) Uncorrected residuals over time for Station BNDS. The period of interest is highlighted in pink. P-wave residuals are shown as open circles, and S-wave residuals are shown as gray circles. The jagged gray line shows the 20-point moving average of all residuals over time. (b) Residuals over time, with those in the period of interest corrected by 2.9 s (Table 1 in the main article). (c) Ray paths for P waves recorded at Station BNDS during the period of interest. Small circles show the locations of all earthquakes recorded at Station BNDS, and line color indicates the magnitude of the residual.
Figure S4. (a) Uncorrected residuals over time for Station HAKT. The two periods of interests are highlighted in pink and blue. P-wave residuals are shown as open circles, and S-wave residuals are shown as gray circles. The jagged gray line shows the 20-point moving average of all residuals over time. (b) Residuals over time, with those in the periods of interest corrected by −5.2 (pink) and −6.6 s (blue; Table 1 in the main article). (c) Ray paths for P waves recorded at Station HAKT during the period of interest. Small circles show the locations of all earthquakes recorded at Station HAKT, and line color indicates the magnitude of the residual, corresponding to the colors in (a) and (b).
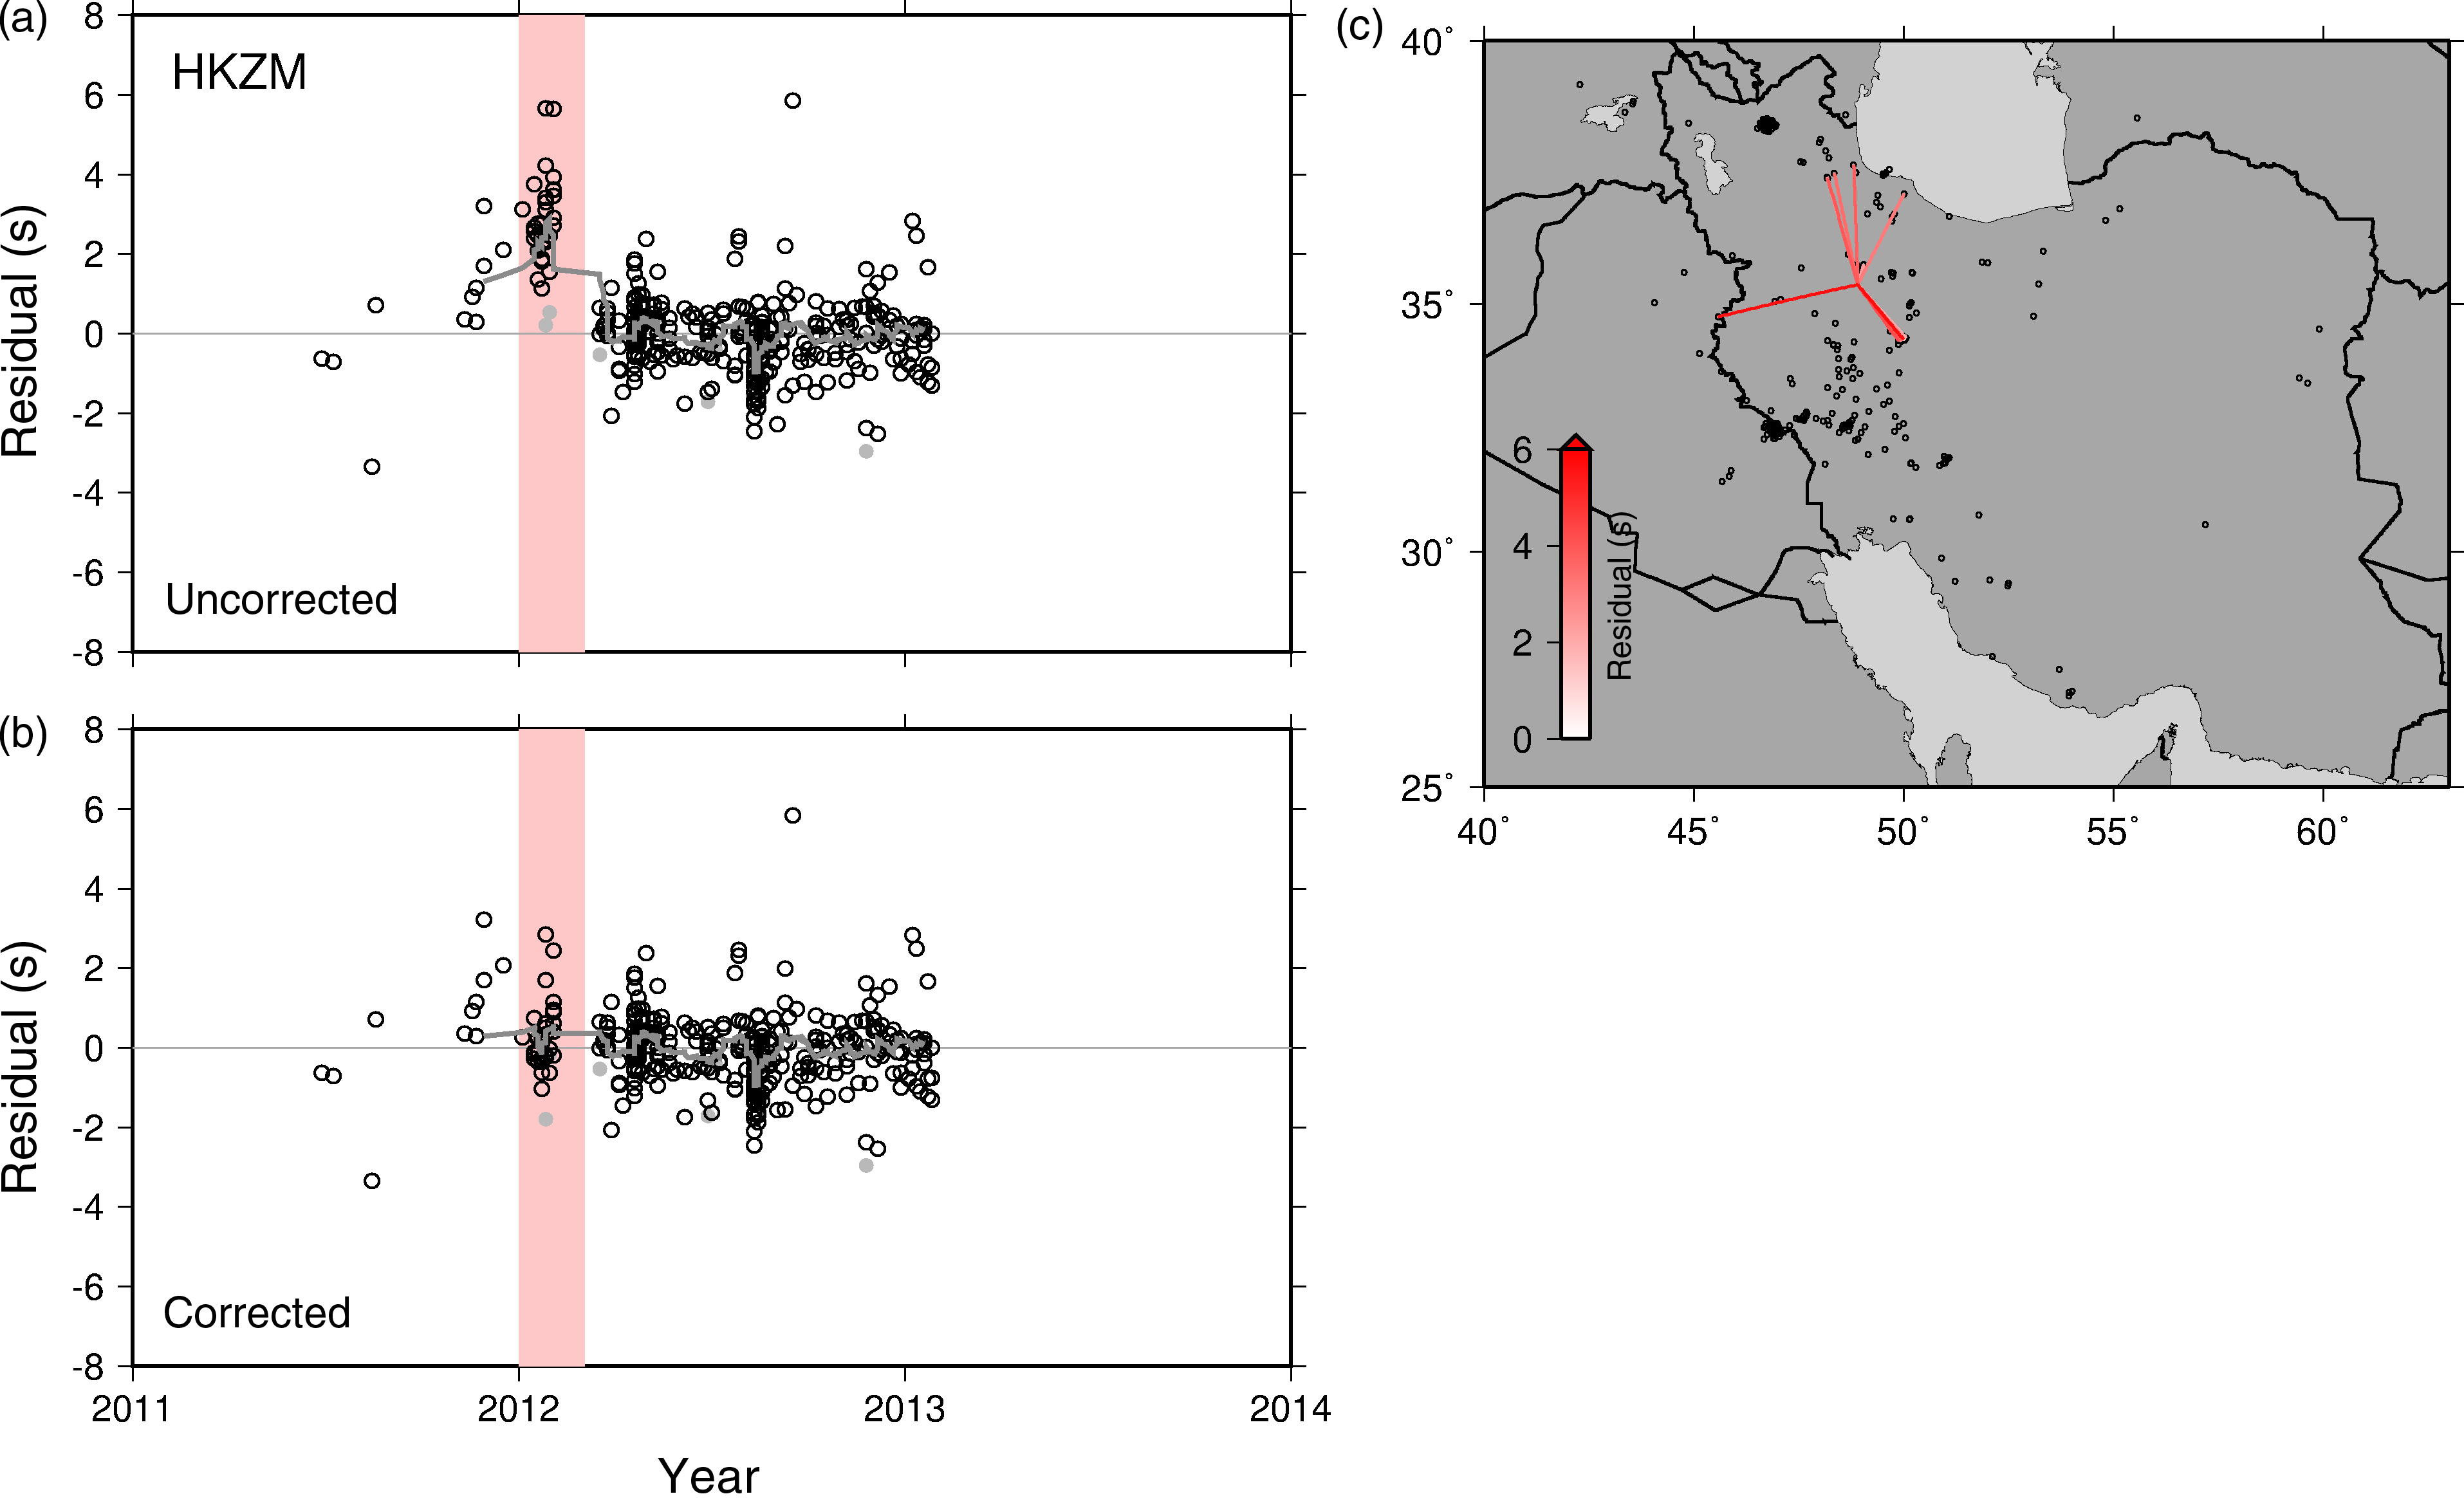
Figure S5. (a) Uncorrected residuals over time for Station HKZM. The period of interest is highlighted in pink. P-wave residuals are shown as open circles, and S-wave residuals are shown as gray circles. The jagged gray line shows the 20-point moving average of all residuals over time. (b) Residuals over time, with those in the period of interest corrected by −3.2 s (Table 1 in the main article). (c) Ray paths for P waves recorded at Station HKZM during the period of interest. Small circles show the locations of all earthquakes recorded at Station HKZM, and line color indicates the magnitude of the residual.
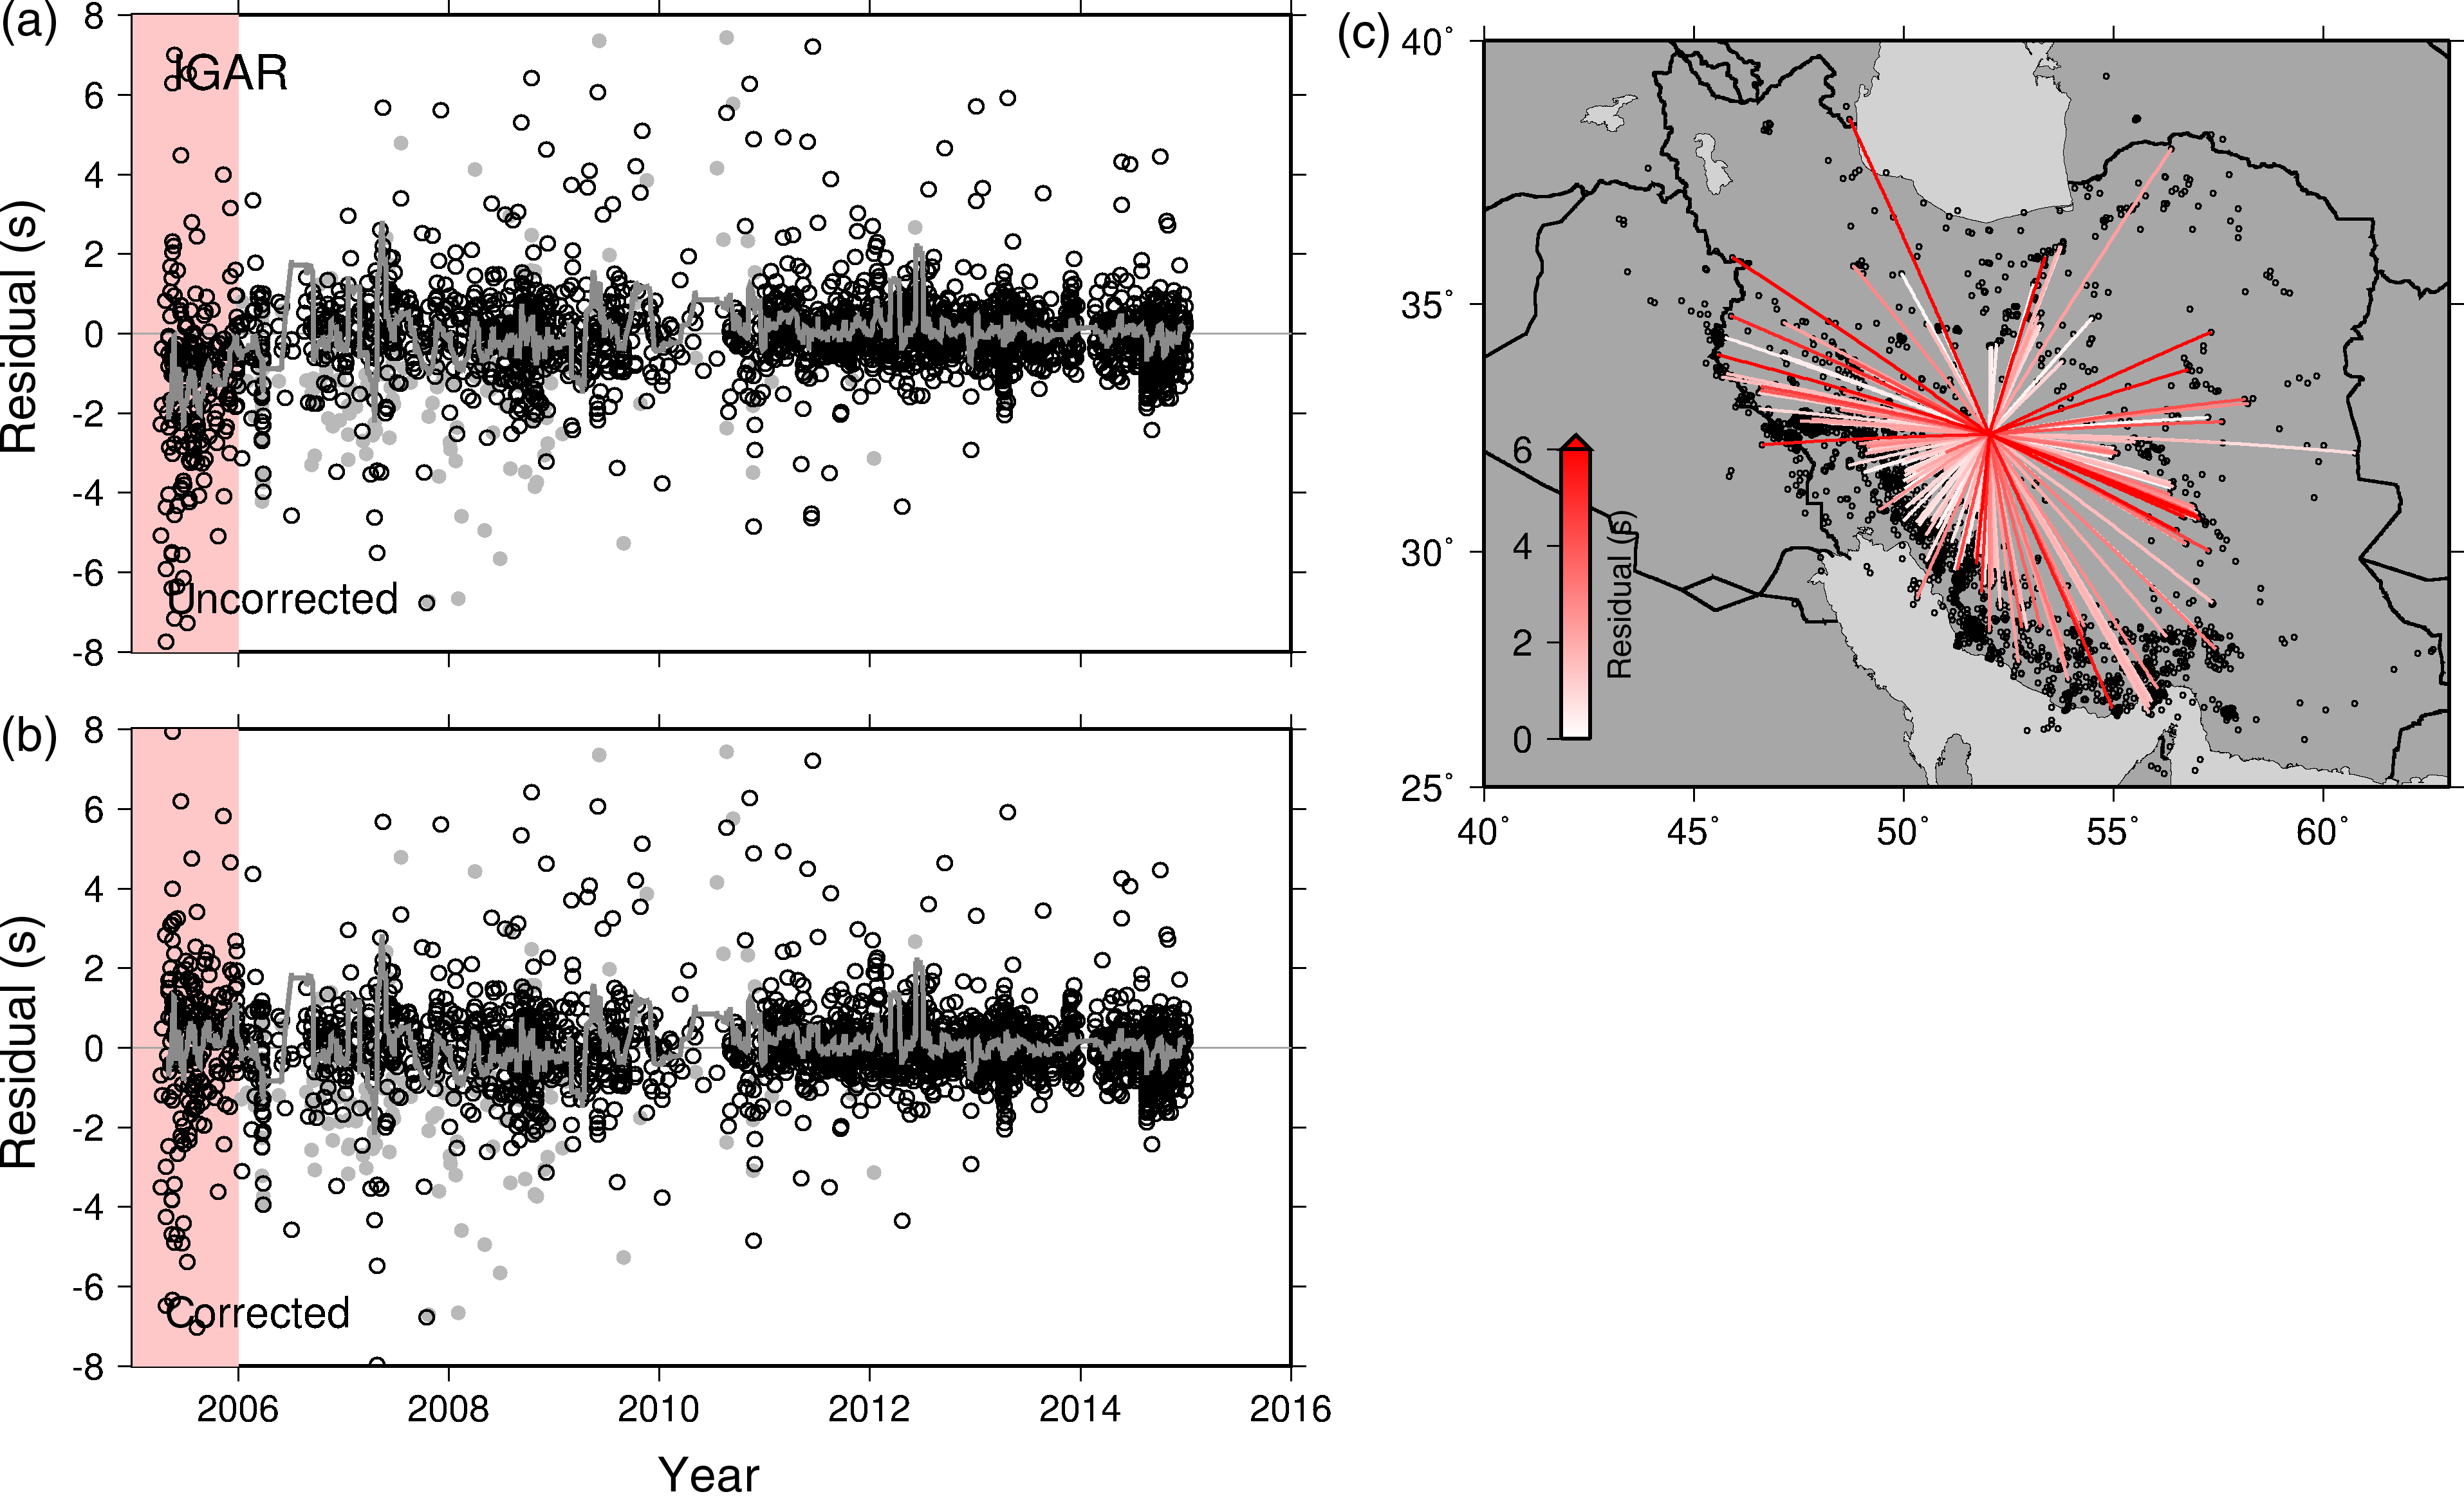
Figure S6. (a) Uncorrected residuals over time for Station IGAR. The period of interest is highlighted in pink. P-wave residuals are shown as open circles, and S-wave residuals are shown as gray circles. The jagged gray line shows the 20-point moving average of all residuals over time. (b) Residuals over time, with those in the period of interest corrected by 2.0 s (Table 1 in the main article). (c) Ray paths for P waves recorded at Station IGAR during the period of interest. Small circles show the locations of all earthquakes recorded at Station IGAR, and line color indicates the magnitude of the residual.
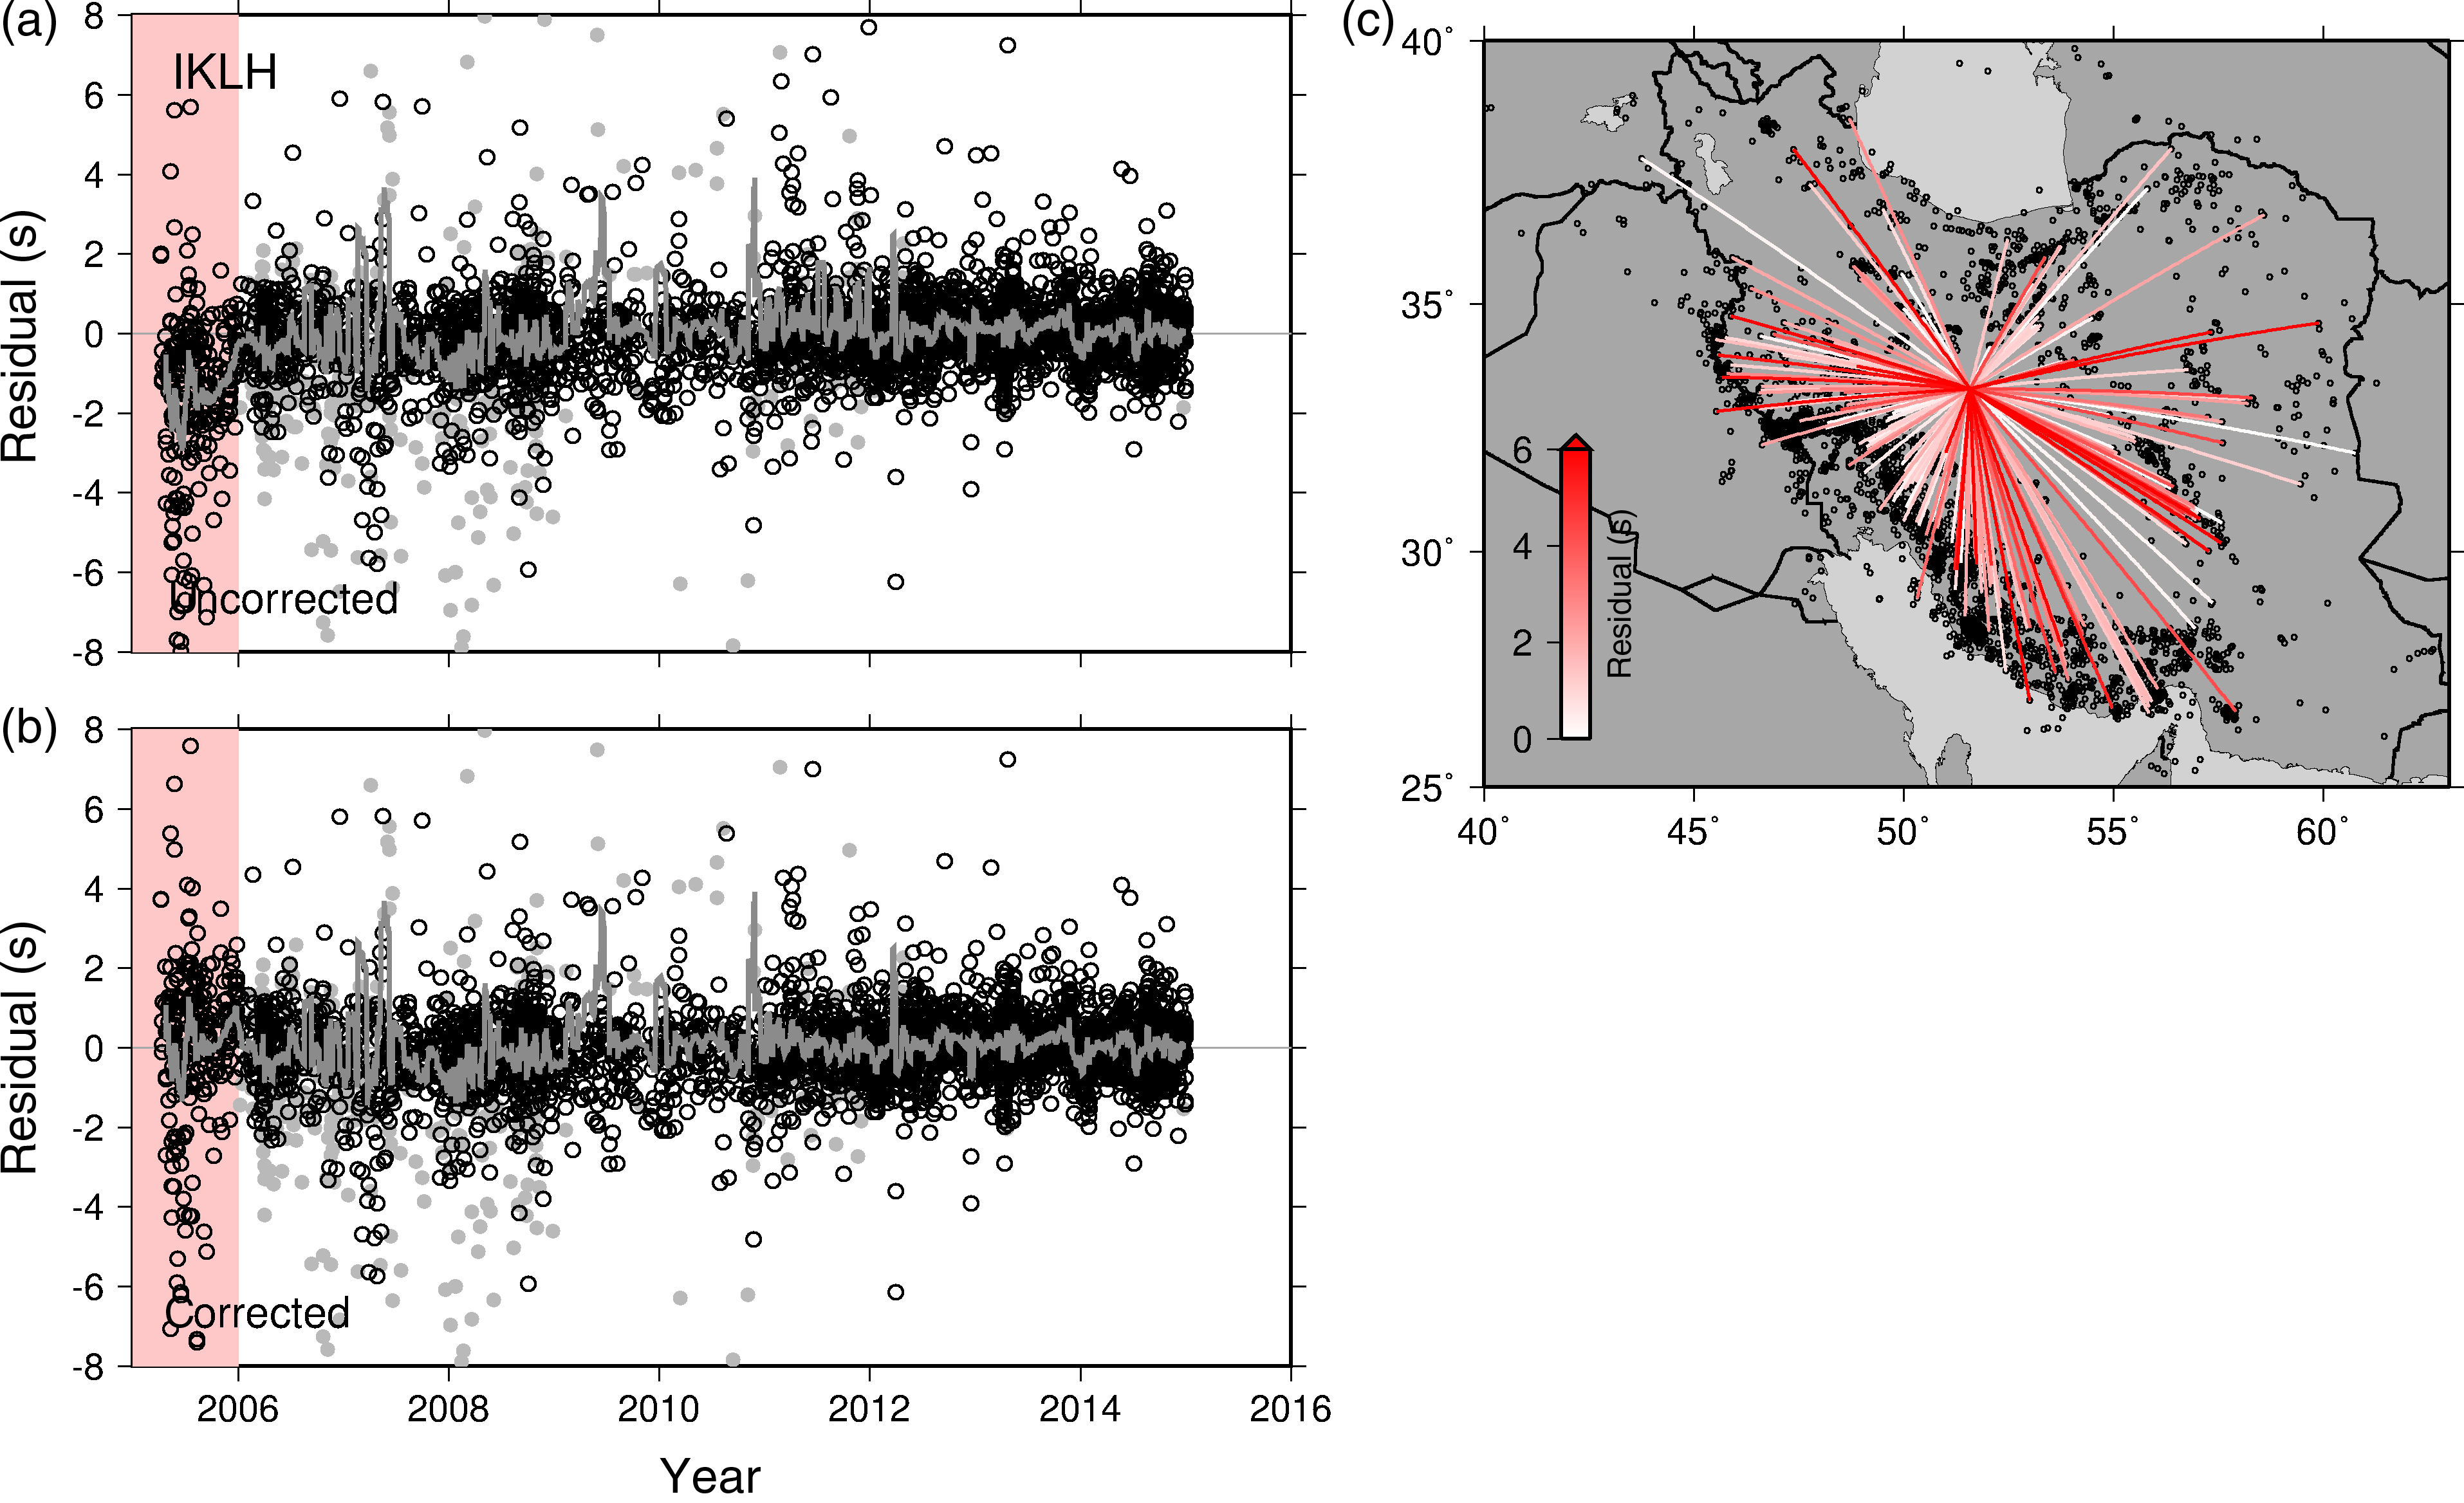
Figure S7. (a) Uncorrected residuals over time for Station IKLH. The period of interest is highlighted in pink. P-wave residuals are shown as open circles, and S-wave residuals are shown as gray circles. The jagged gray line shows the 20-point moving average of all residuals over time. (b) Residuals over time, with those in the period of interest corrected by 2.1 s (Table 1 in the main article). (c) Ray paths for P waves recorded at Station IKLH during the period of interest. Small circles show the locations of all earthquakes recorded at Station IKLH, and line color indicates the magnitude of the residual.
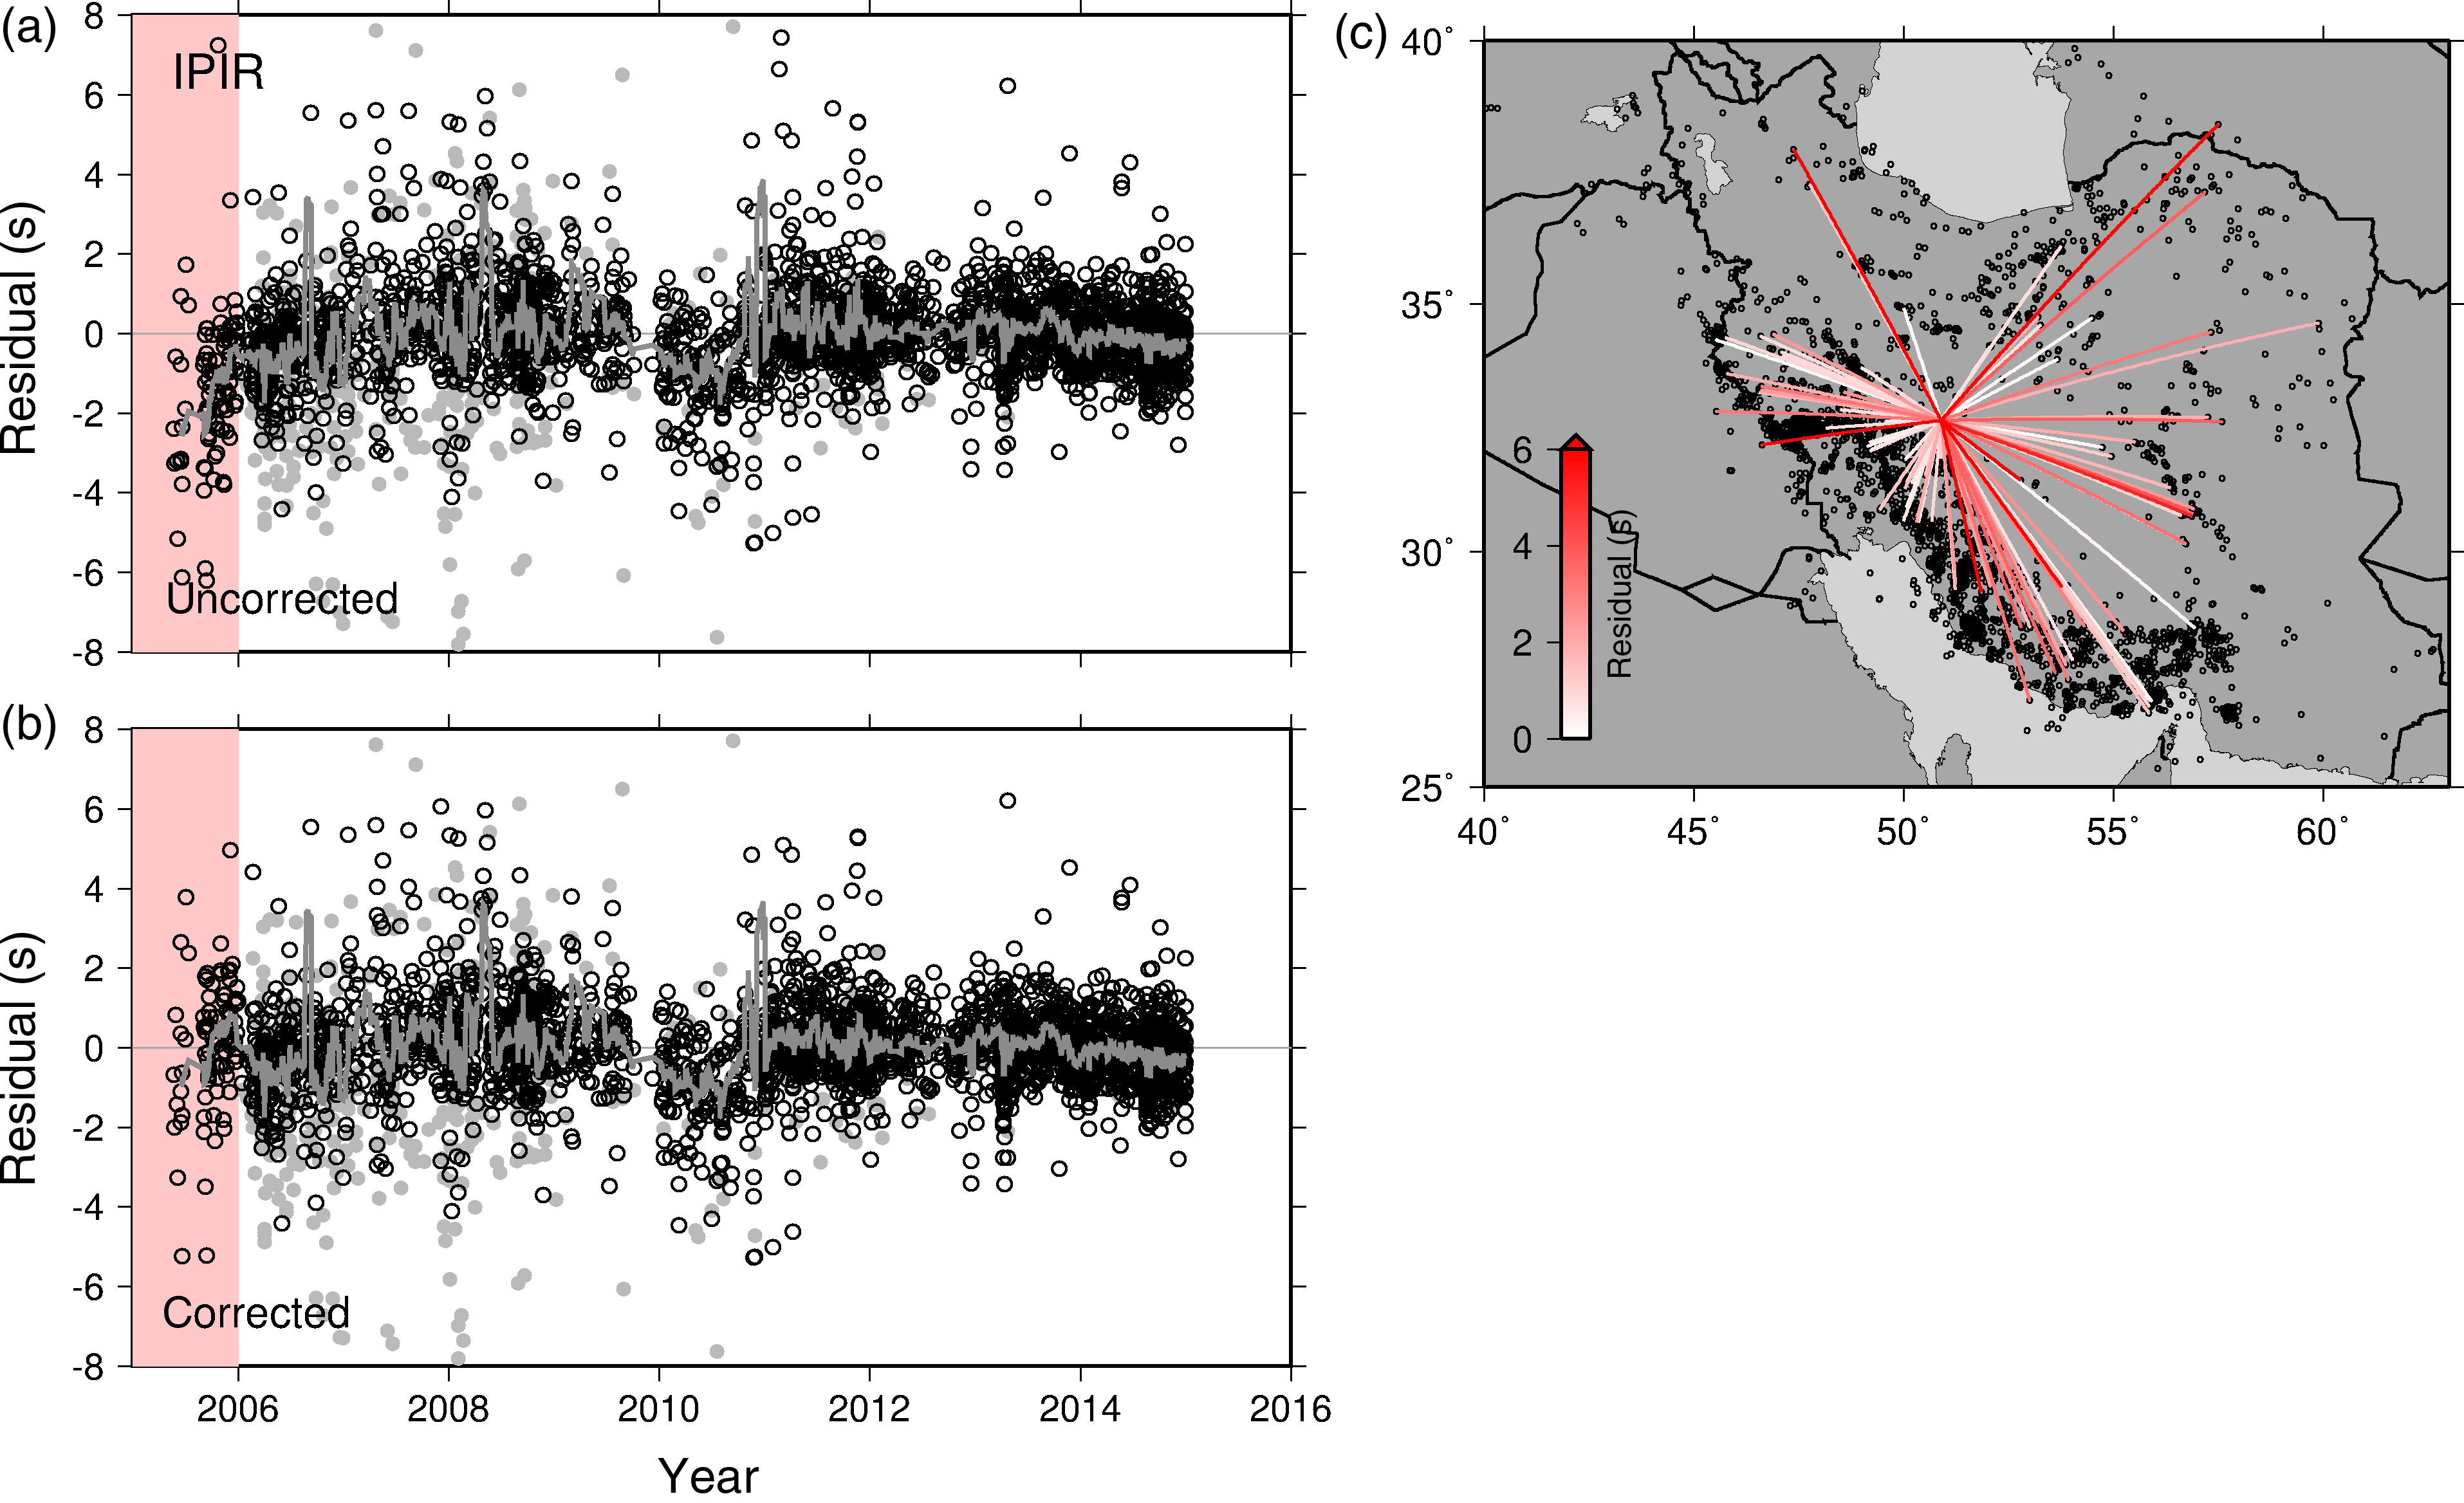
Figure S8. (a) Uncorrected residuals over time for Station IPIR. The period of interest is highlighted in pink. P-wave residuals are shown as open circles, and S-wave residuals are shown as gray circles. The jagged gray line shows the 20-point moving average of all residuals over time. (b) Residuals over time, with those in the period of interest corrected by 2.1 s (Table 1 in the main article). (c) Ray paths for P waves recorded at Station IPIR during the period of interest. Small circles show the locations of all earthquakes recorded at Station IPIR, and line color indicates the magnitude of the residual.
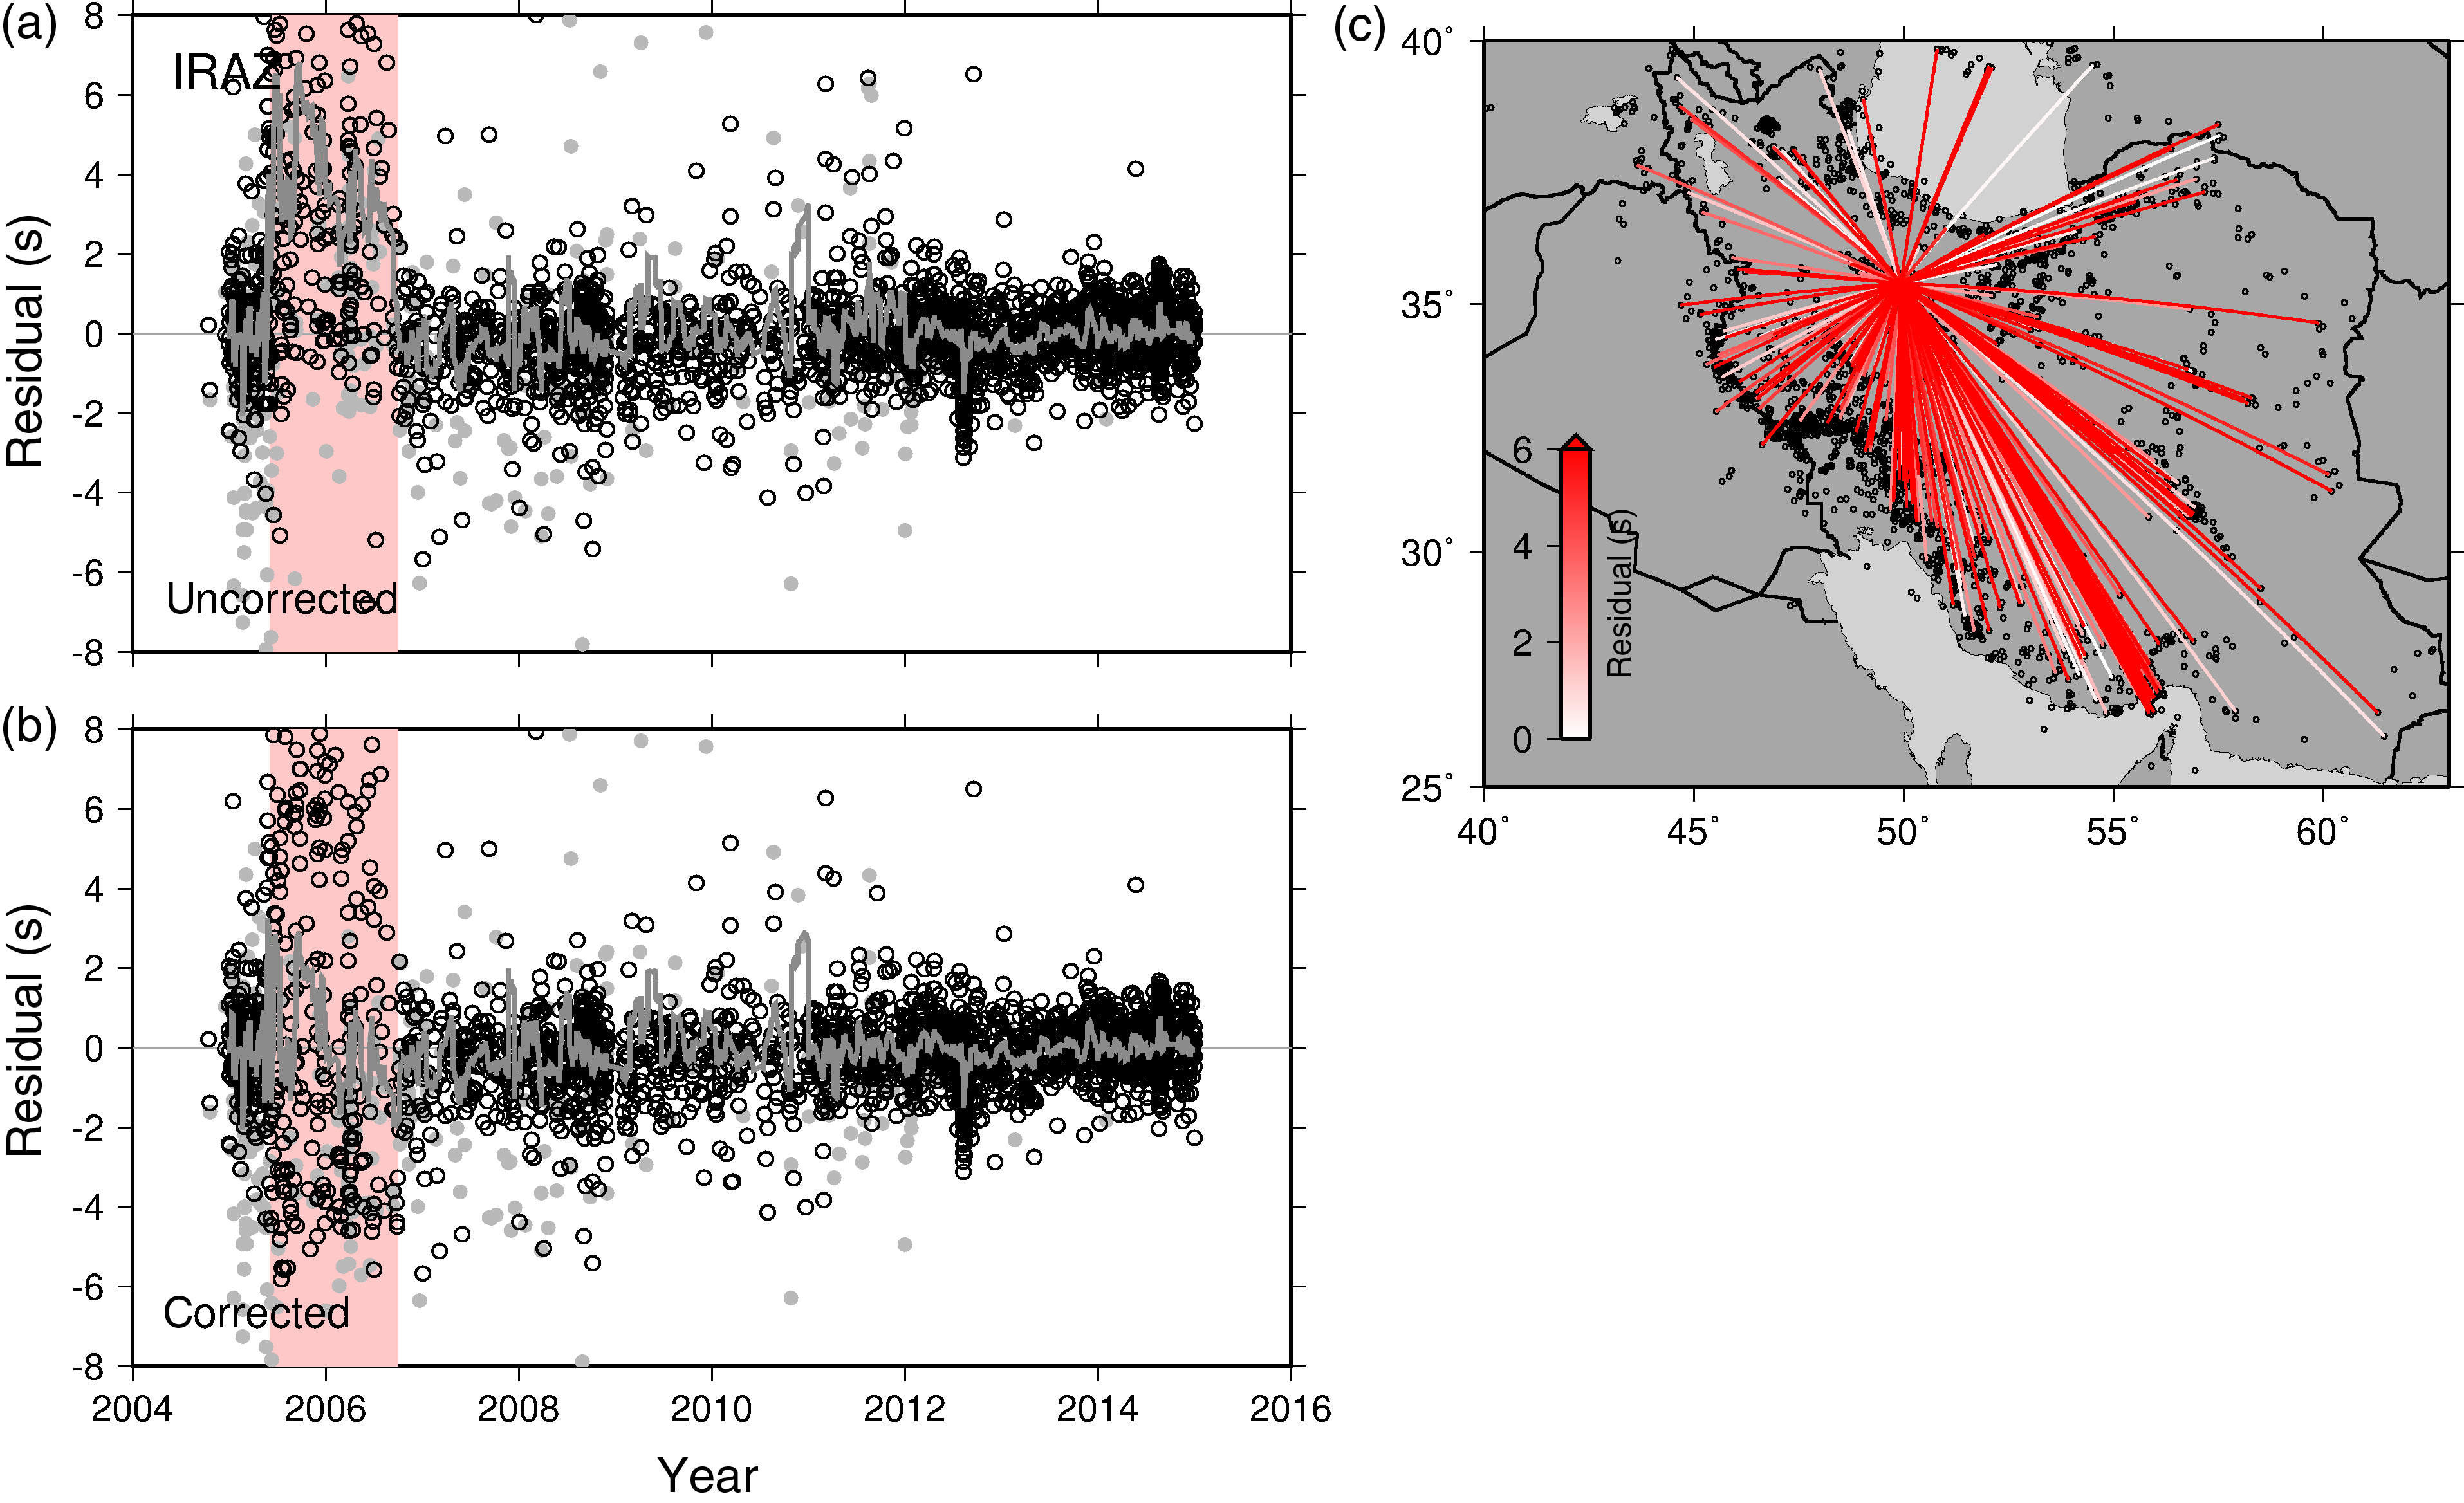
Figure S9. (a) Uncorrected residuals over time for Station IRAZ. The period of interest is highlighted in pink. P-wave residuals are shown as open circles, and S-wave residuals are shown as gray circles. The jagged gray line shows the 20-point moving average of all residuals over time. (b) Residuals over time, with those in the period of interest corrected by −4.2 s (Table 1 in the main article). (c) Ray paths for P waves recorded at Station IRAZ during the period of interest. Small circles show the locations of all earthquakes recorded at Station IRAZ, and line color indicates the magnitude of the residual.
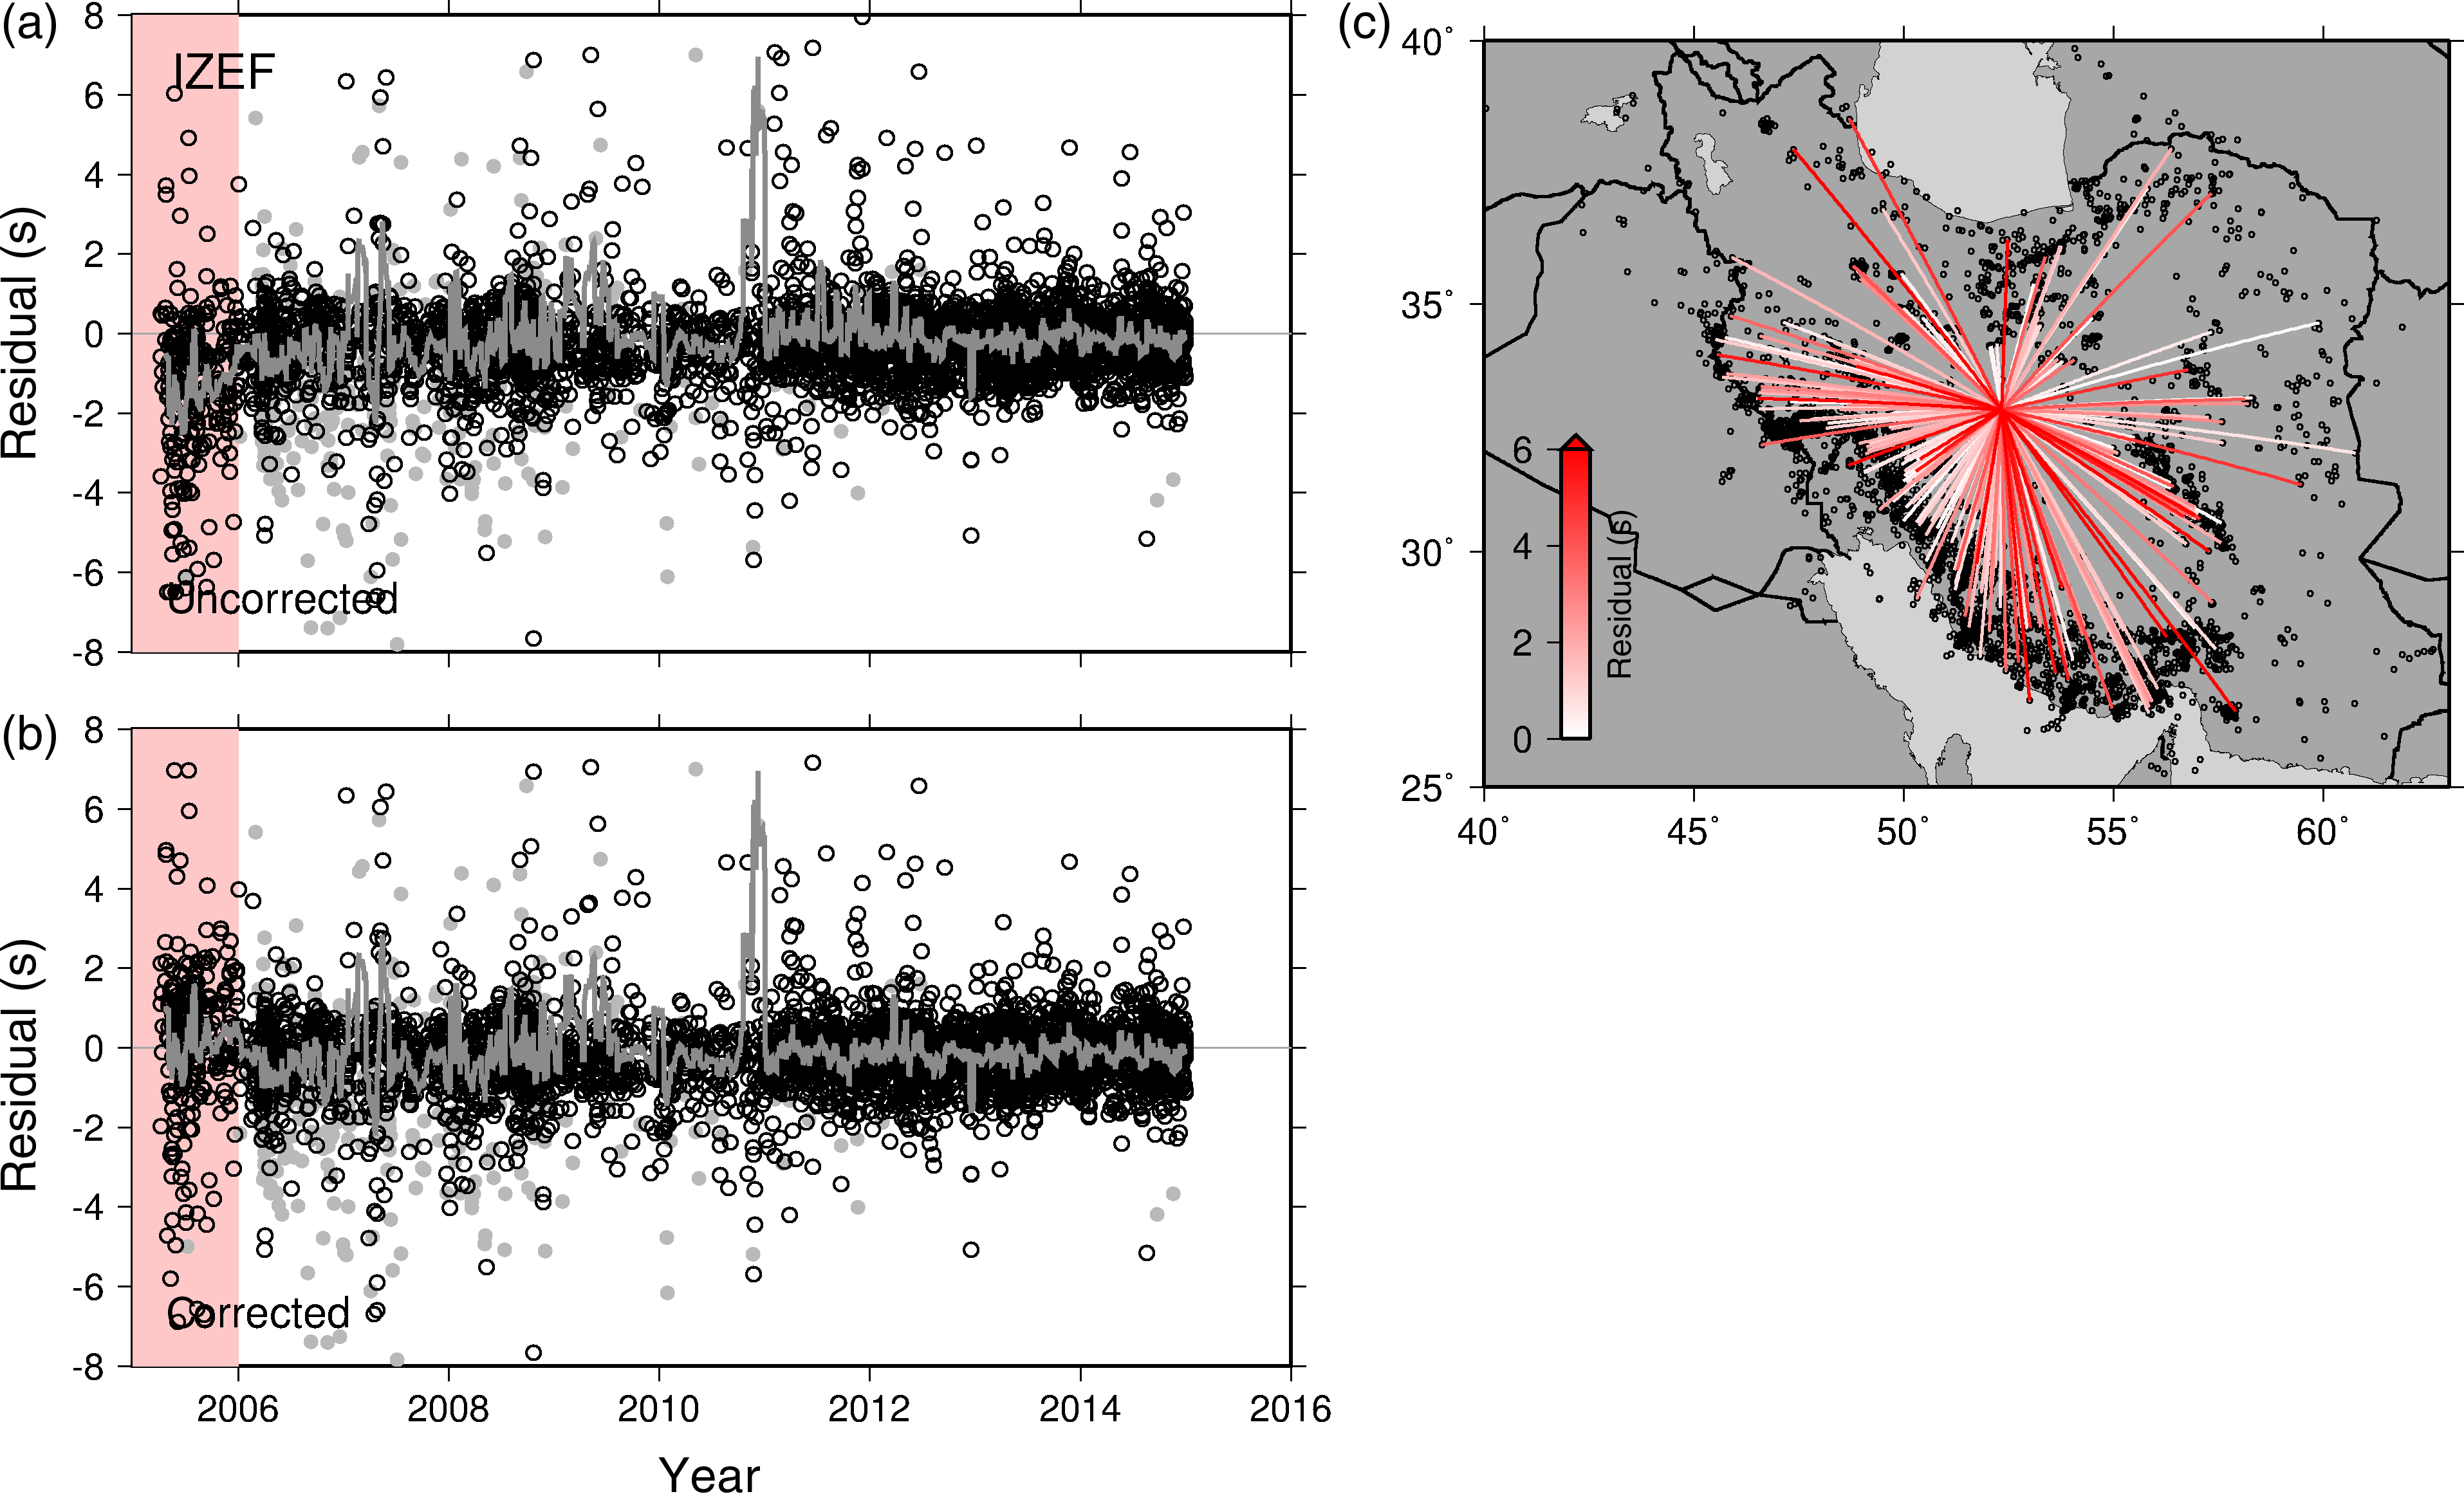
Figure S10. (a) Uncorrected residuals over time for Station IZEF. The period of interest is highlighted in pink. P-wave residuals are shown as open circles, and S-wave residuals are shown as gray circles. The jagged gray line shows the 20-point moving average of all residuals over time. (b) Residuals over time, with those in the period of interest corrected by 2.0 s (Table 1 in the main article). (c) Ray paths for P waves recorded at Station IZEF during the period of interest. Small circles show the locations of all earthquakes recorded at Station IZEF, and line color indicates the magnitude of the residual.
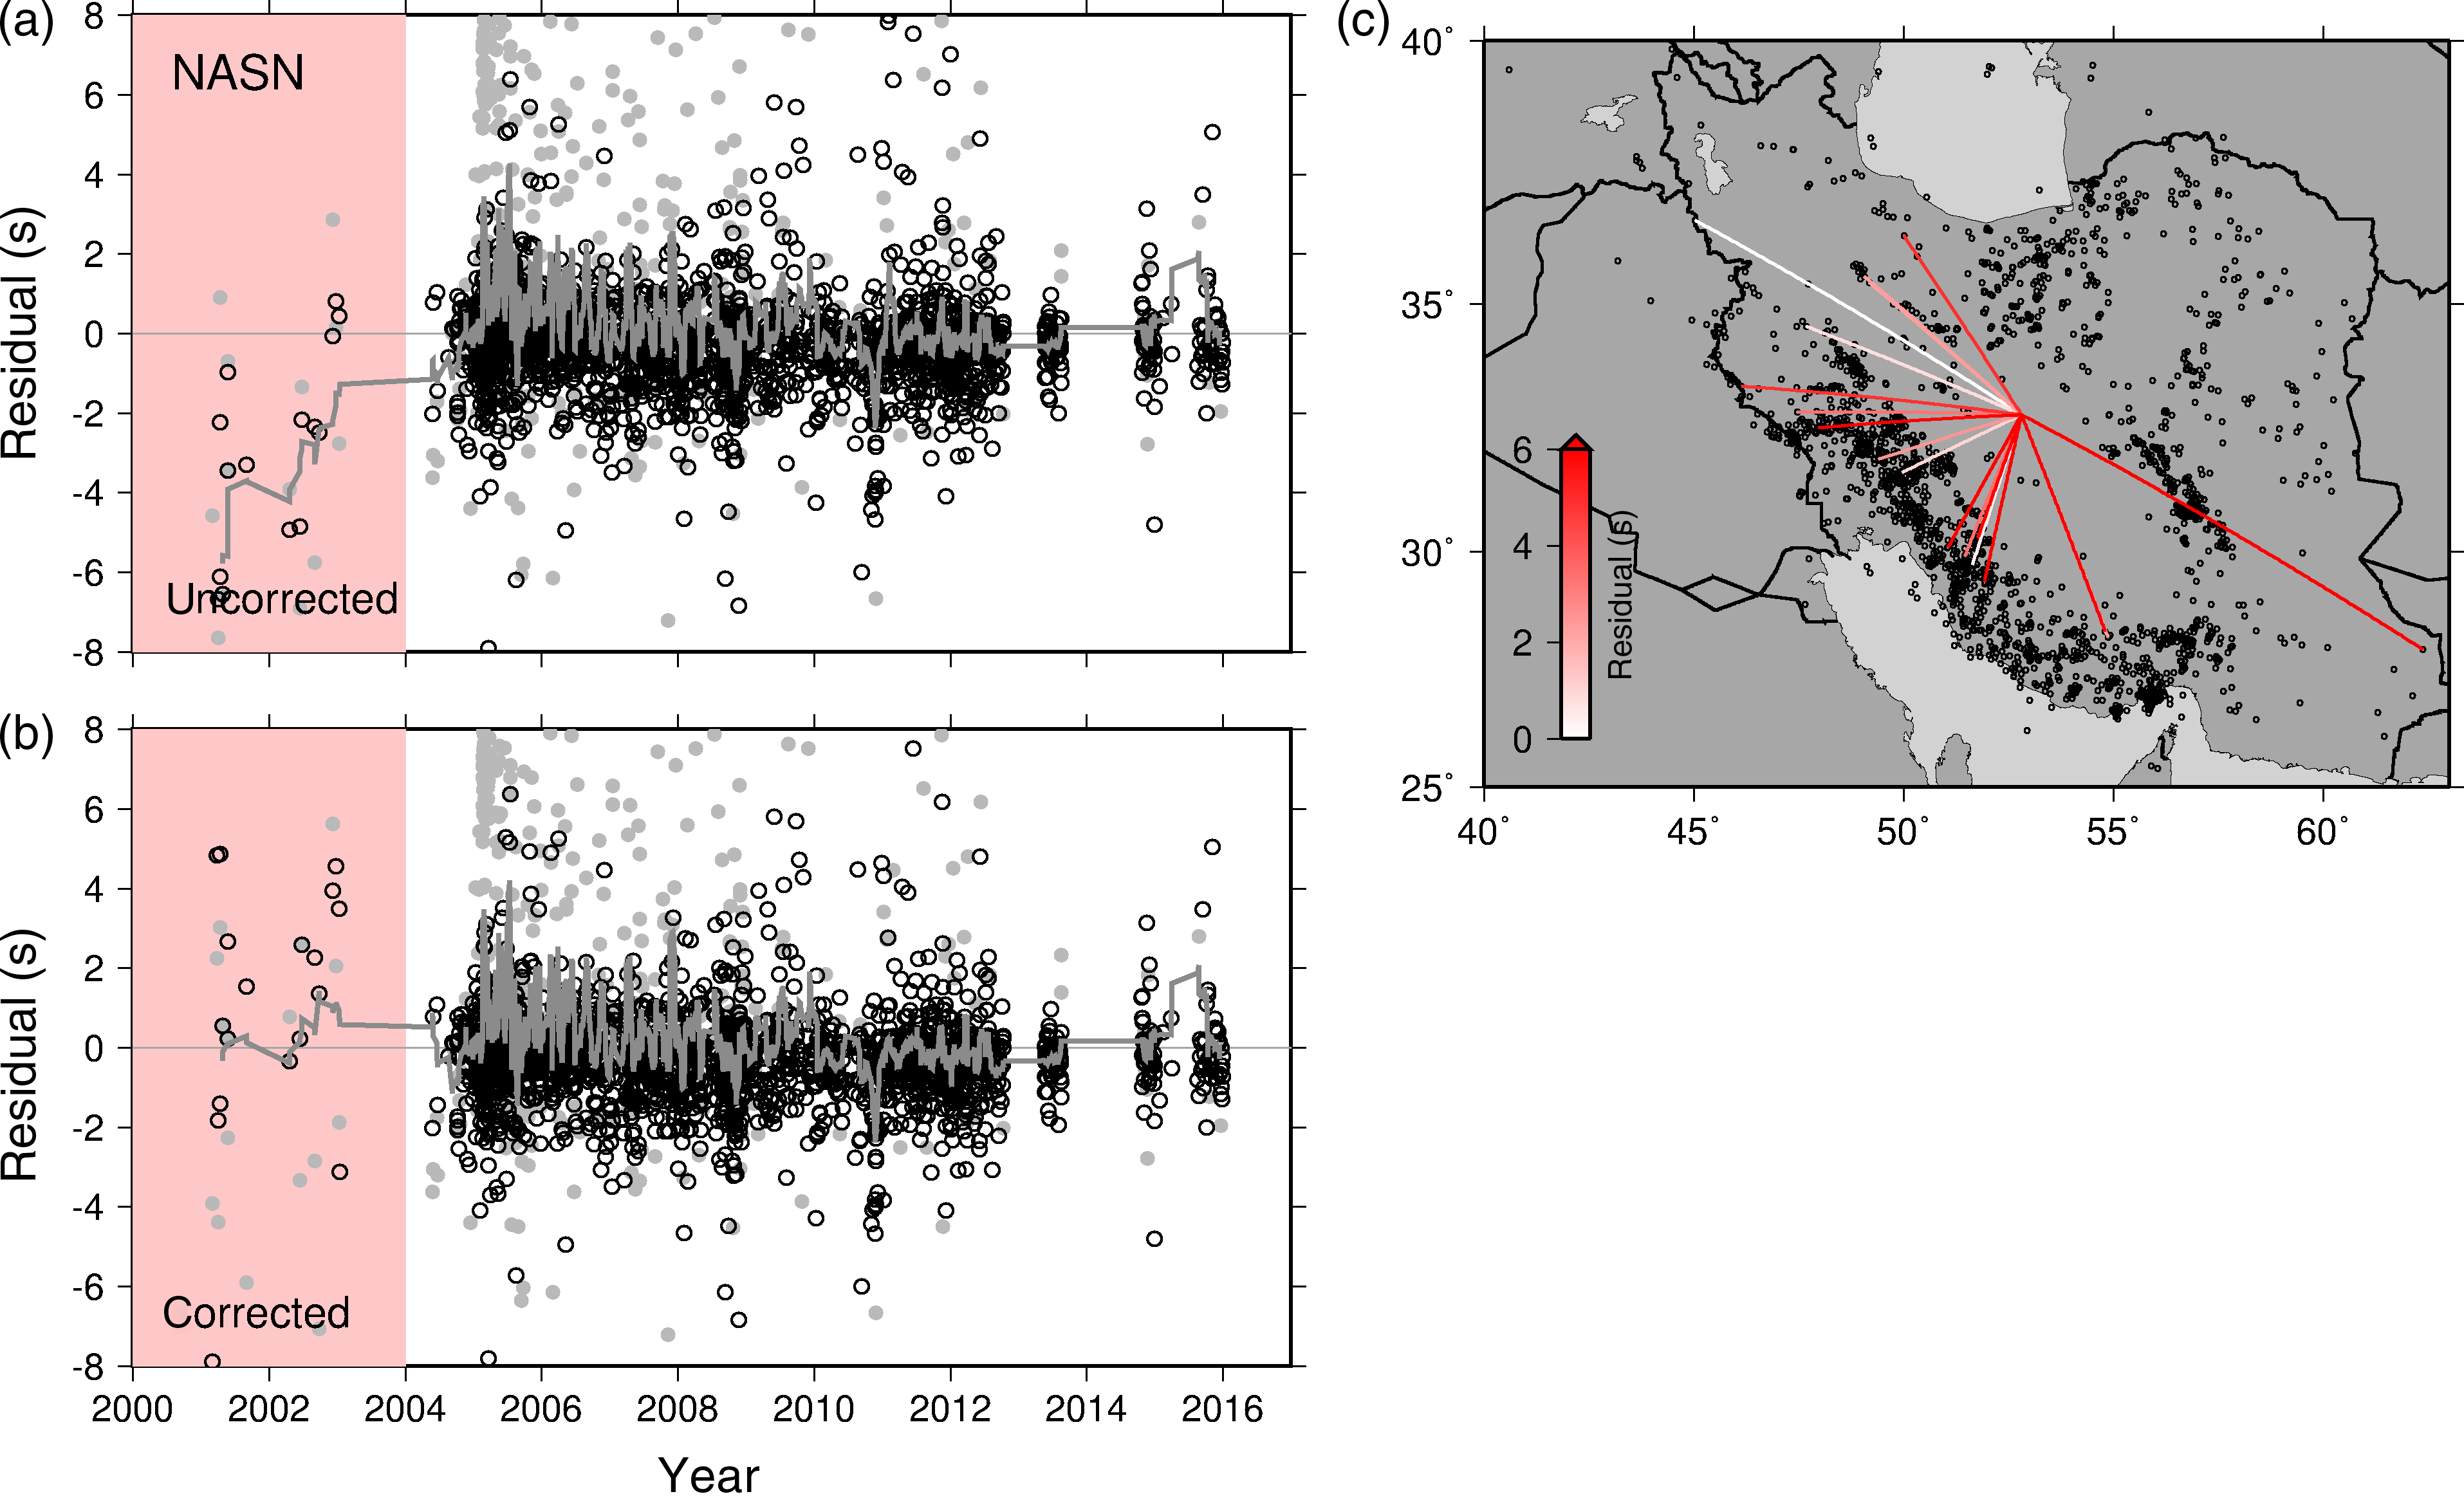
Figure S11. (a) Uncorrected residuals over time for Station NASN. The period of interest is highlighted in pink. P-wave residuals are shown as open circles, and S-wave residuals are shown as gray circles. The jagged gray line shows the 20-point moving average of all residuals over time. (b) Residuals over time, with those in the period of interest corrected by 7.1 s (Table 1 in the main article). (c) Ray paths for P waves recorded at Station NASN during the period of interest. Small circles show the locations of all earthquakes recorded at Station NASN, and line color indicates the magnitude of the residual.
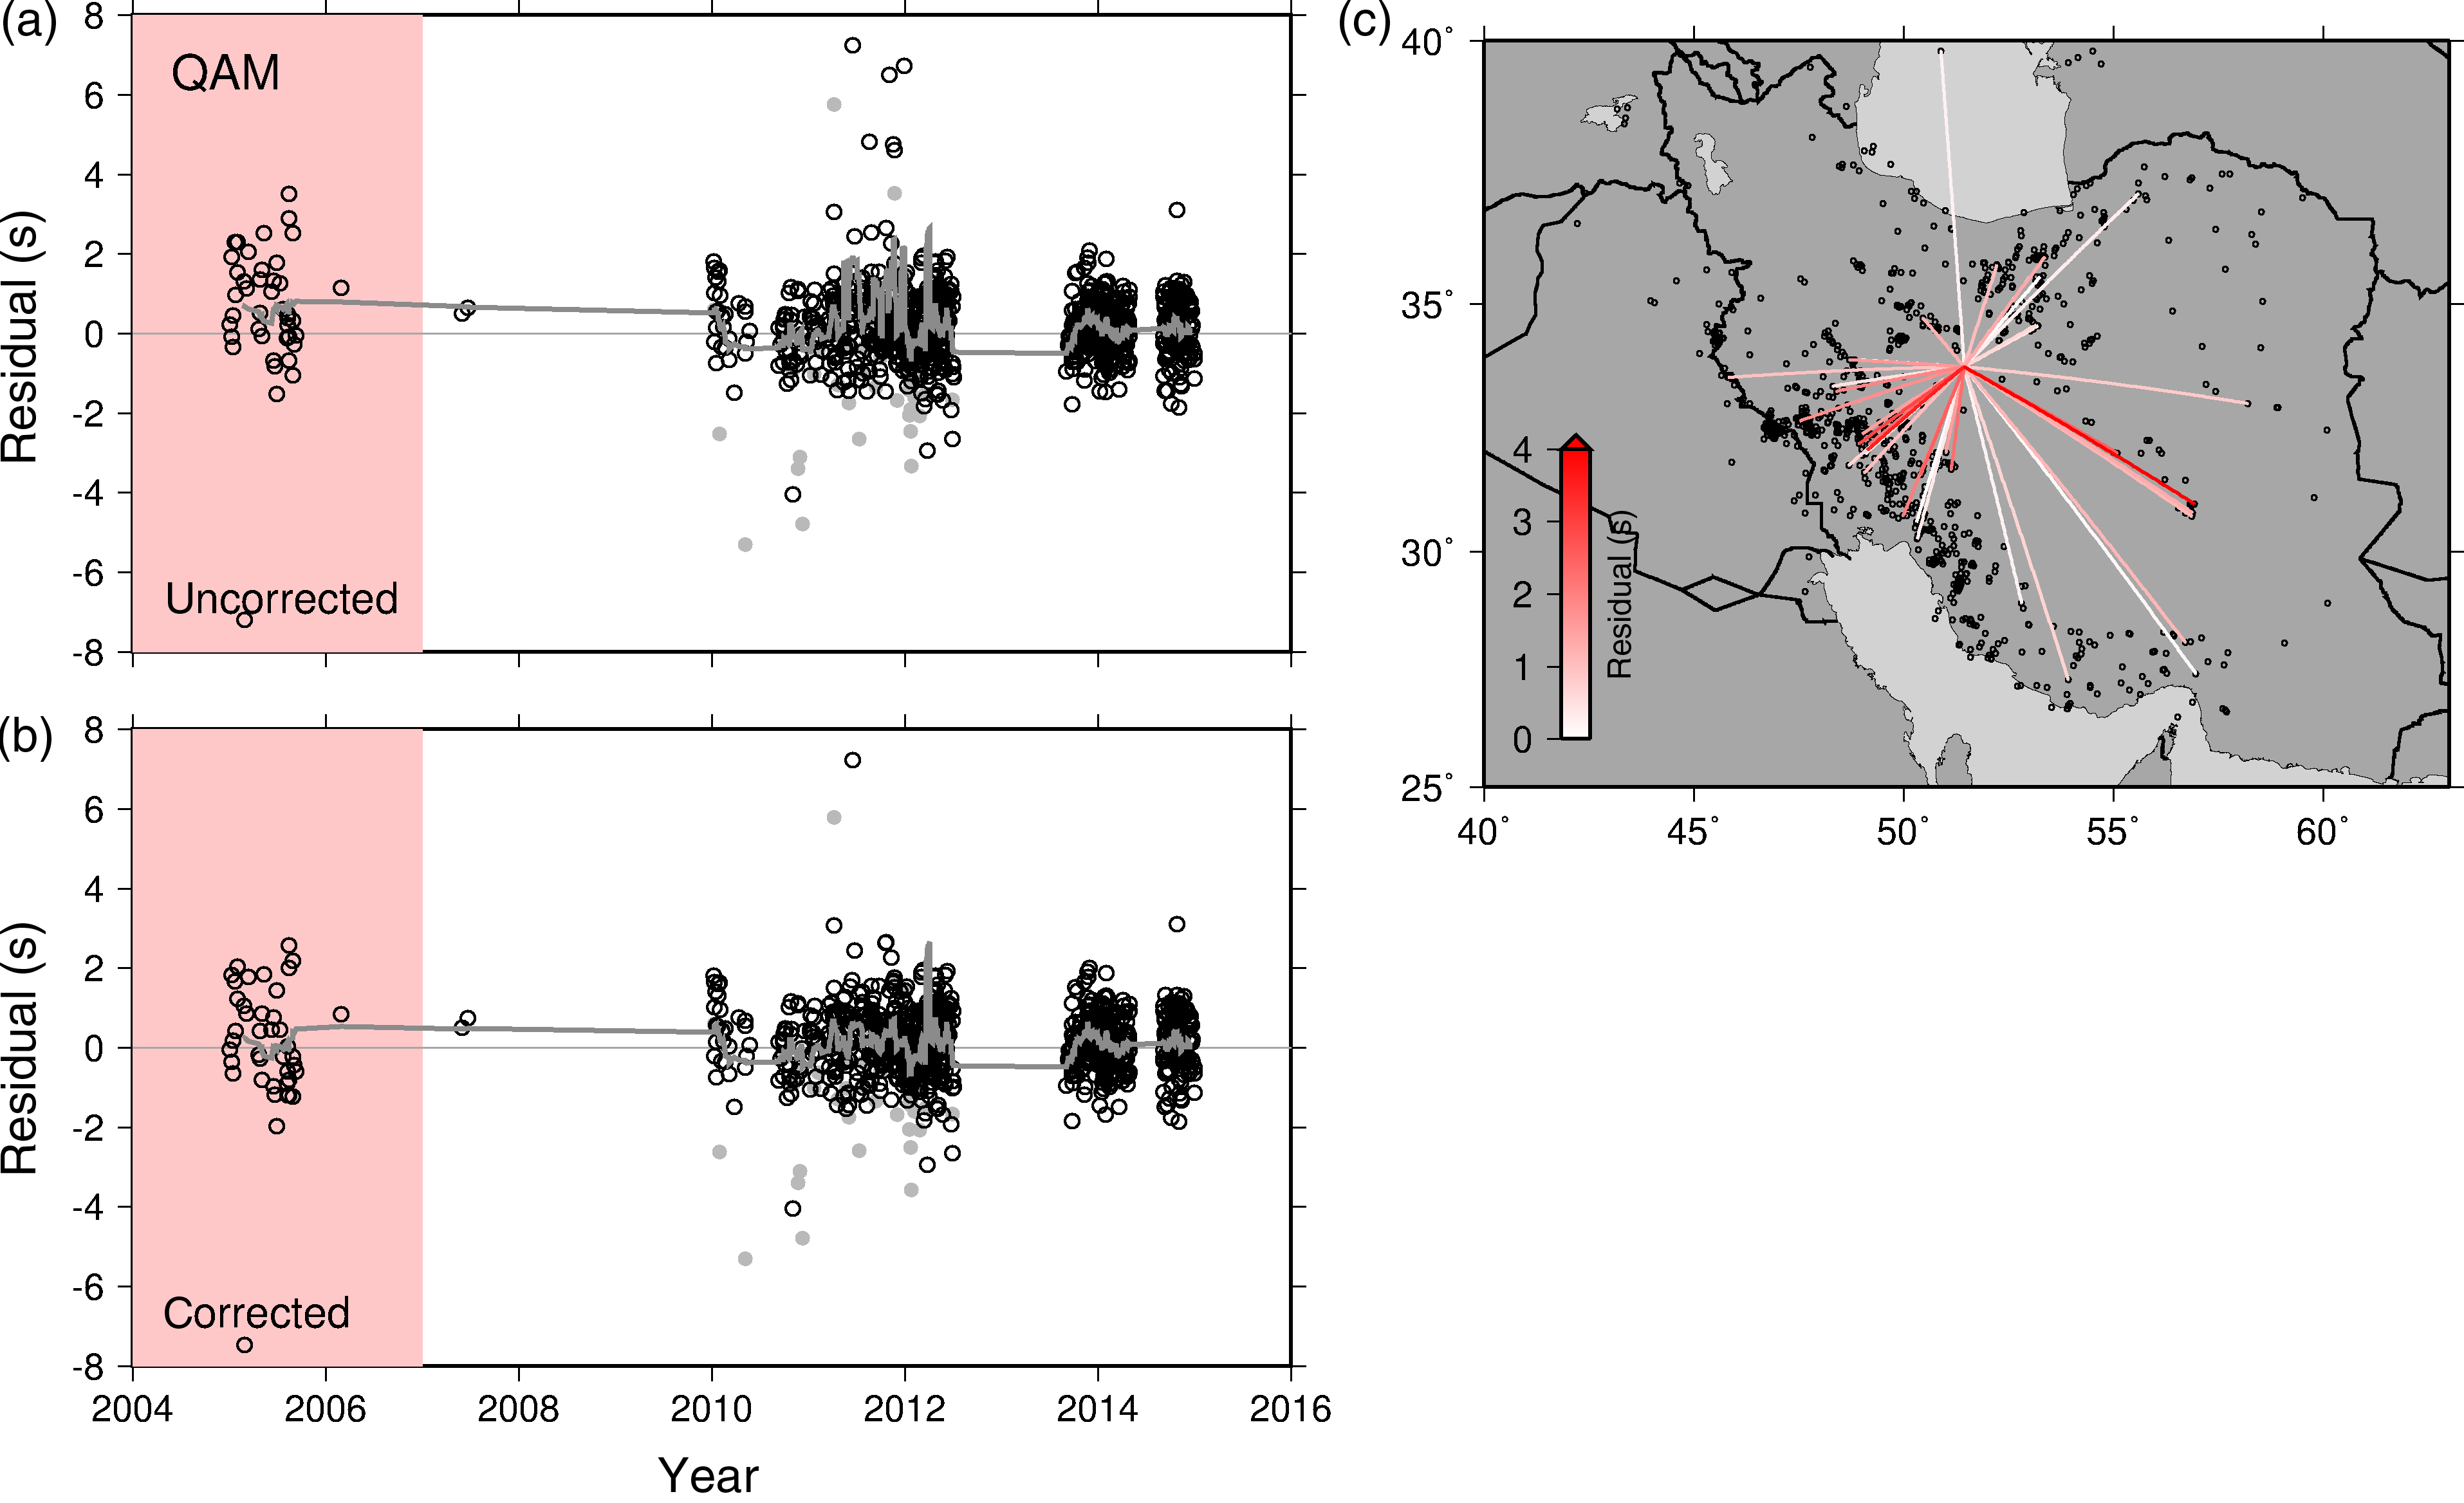
Figure S12. (a) Uncorrected residuals over time for Station QAM. The period of interest is highlighted in pink. P-wave residuals are shown as open circles, and S-wave residuals are shown as gray circles. The jagged gray line shows the 20-point moving average of all residuals over time. (b) Residuals over time, with those in the period of interest corrected by −0.3 s (Table 1 in the main article). (c) Ray paths for P waves recorded at Station QAM during the period of interest. Small circles show the locations of all earthquakes recorded at Station QAM, and line color indicates the magnitude of the residual.
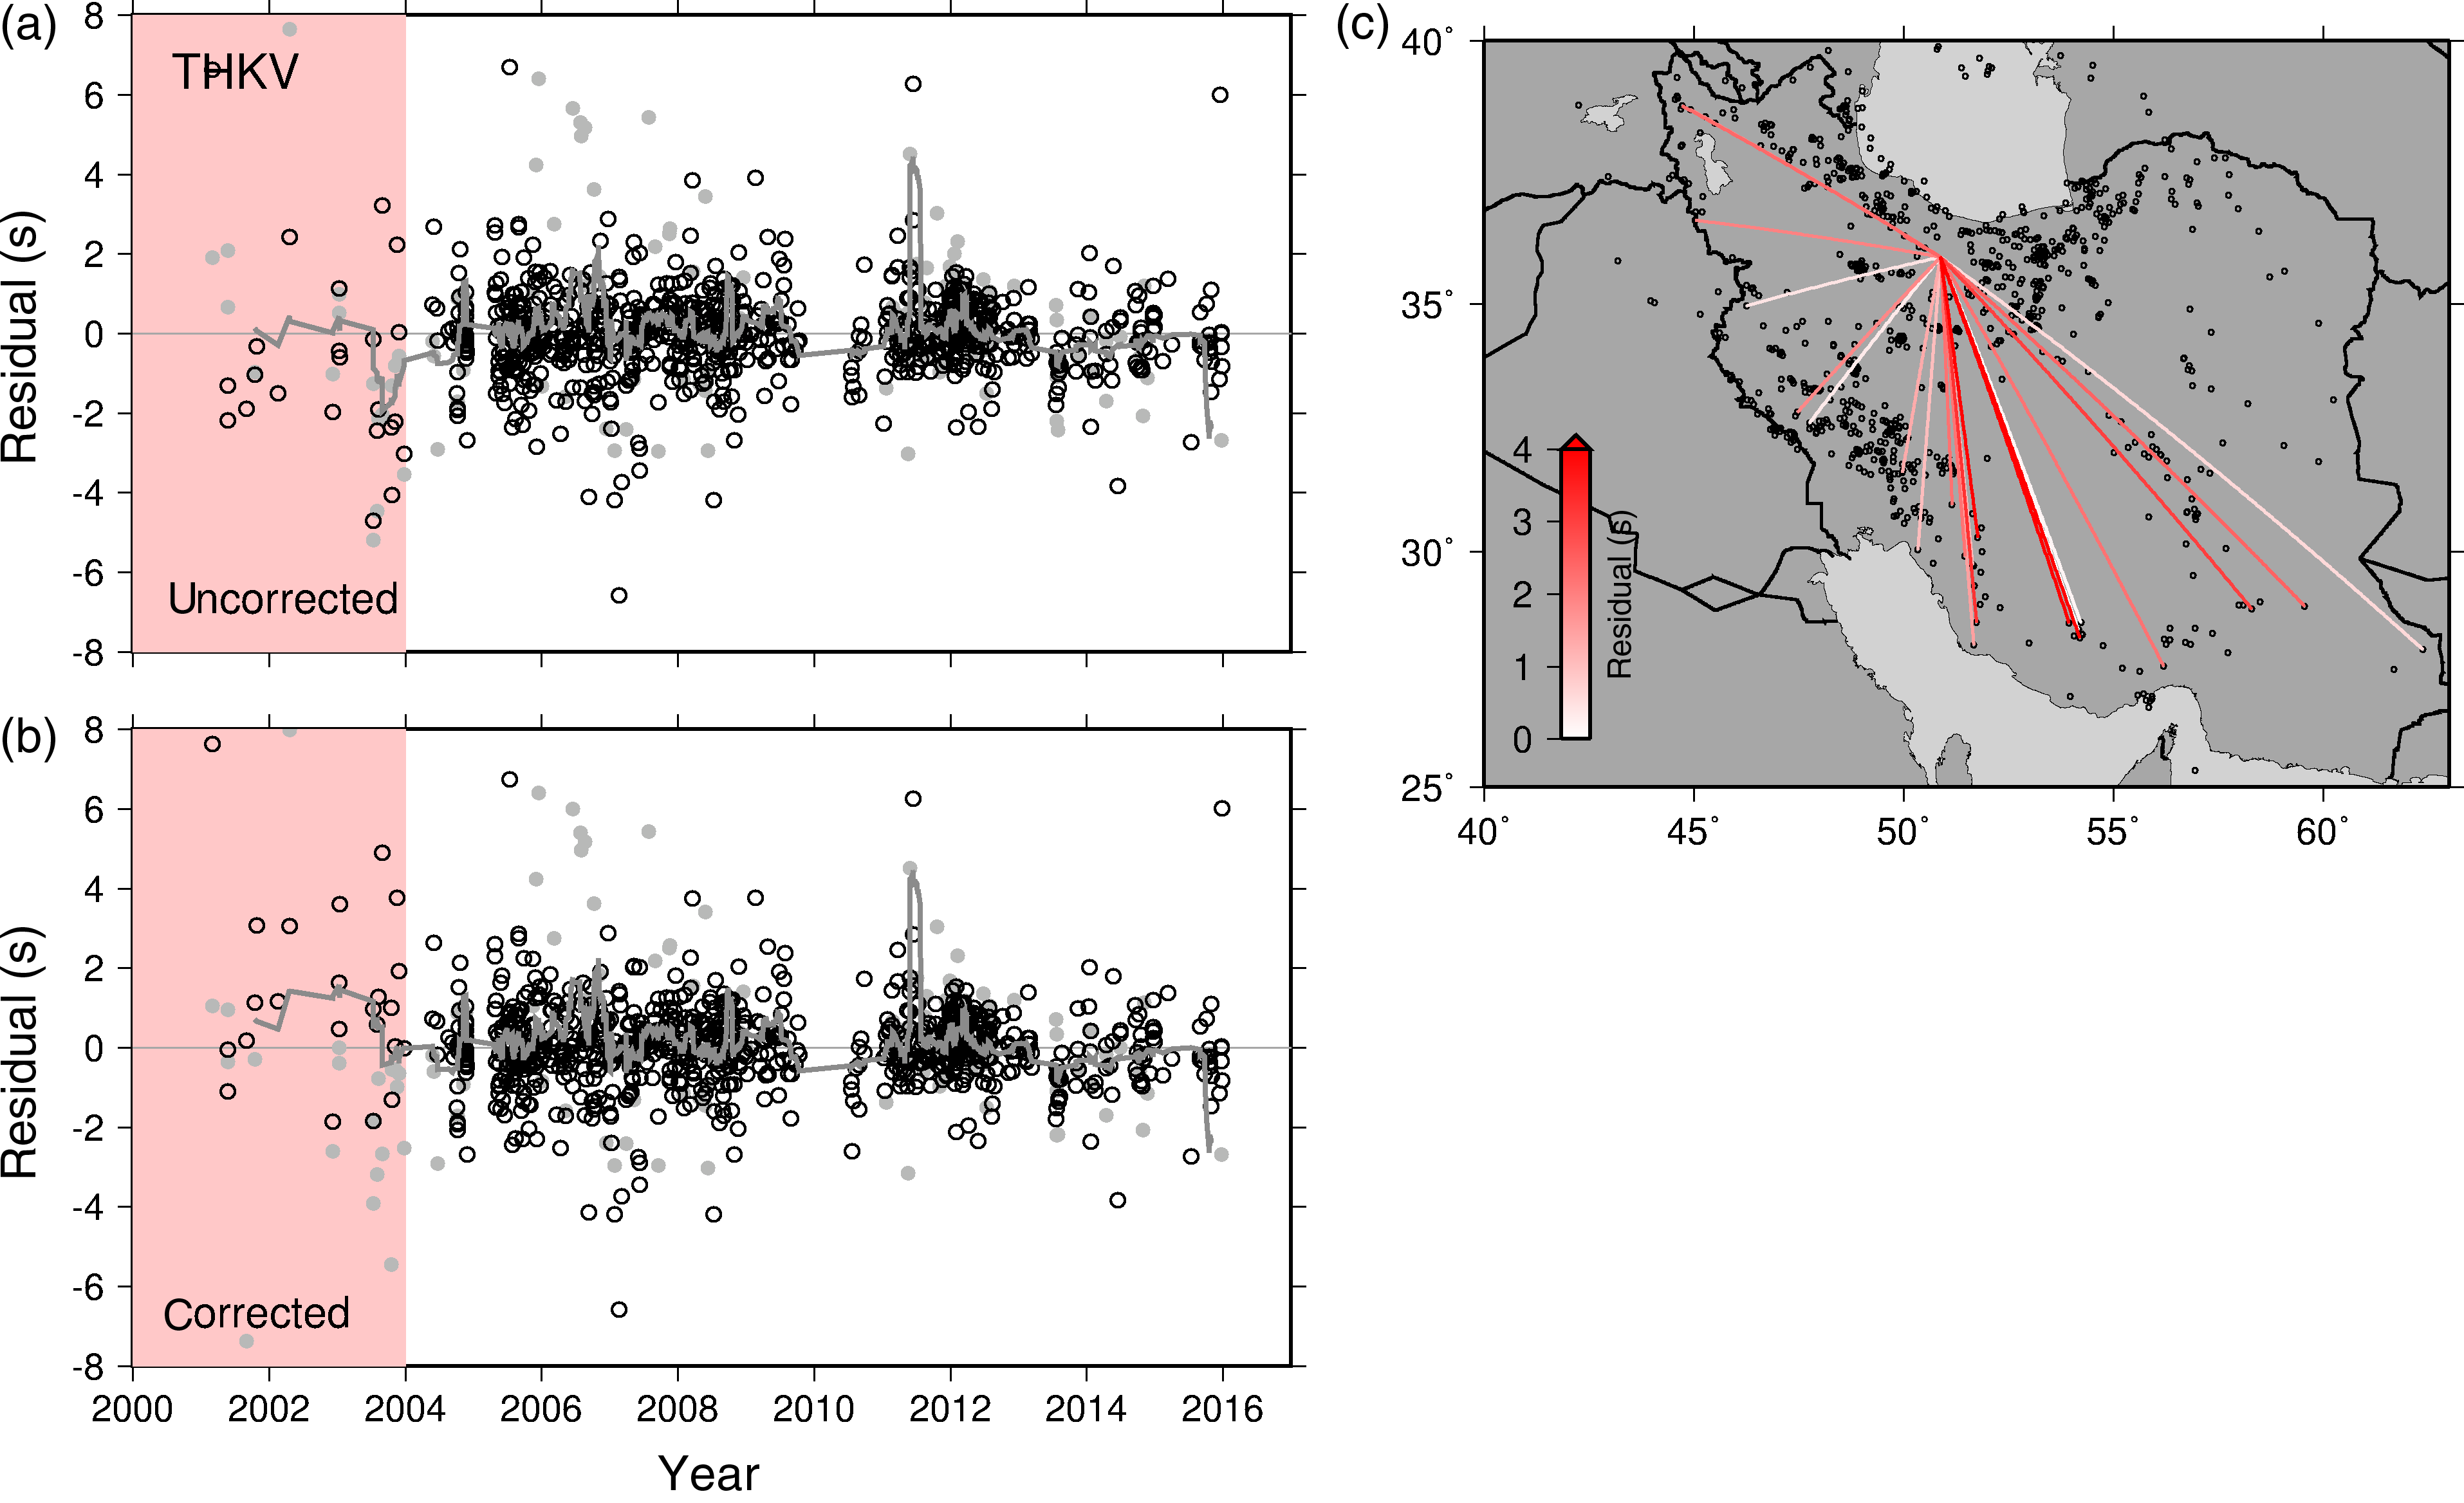
Figure S13. (a) Uncorrected residuals over time for Station THKV. The period of interest is highlighted in pink. P-wave residuals are shown as open circles, and S-wave residuals are shown as gray circles. The jagged gray line shows the 20-point moving average of all residuals over time. (b) Residuals over time, with those in the period of interest corrected by 4.2 s (Table 1 in the main article). (c) Ray paths for P waves recorded at Station THKV during the period of interest. Small circles show the locations of all earthquakes recorded at Station THKV, and line color indicates the magnitude of the residual.
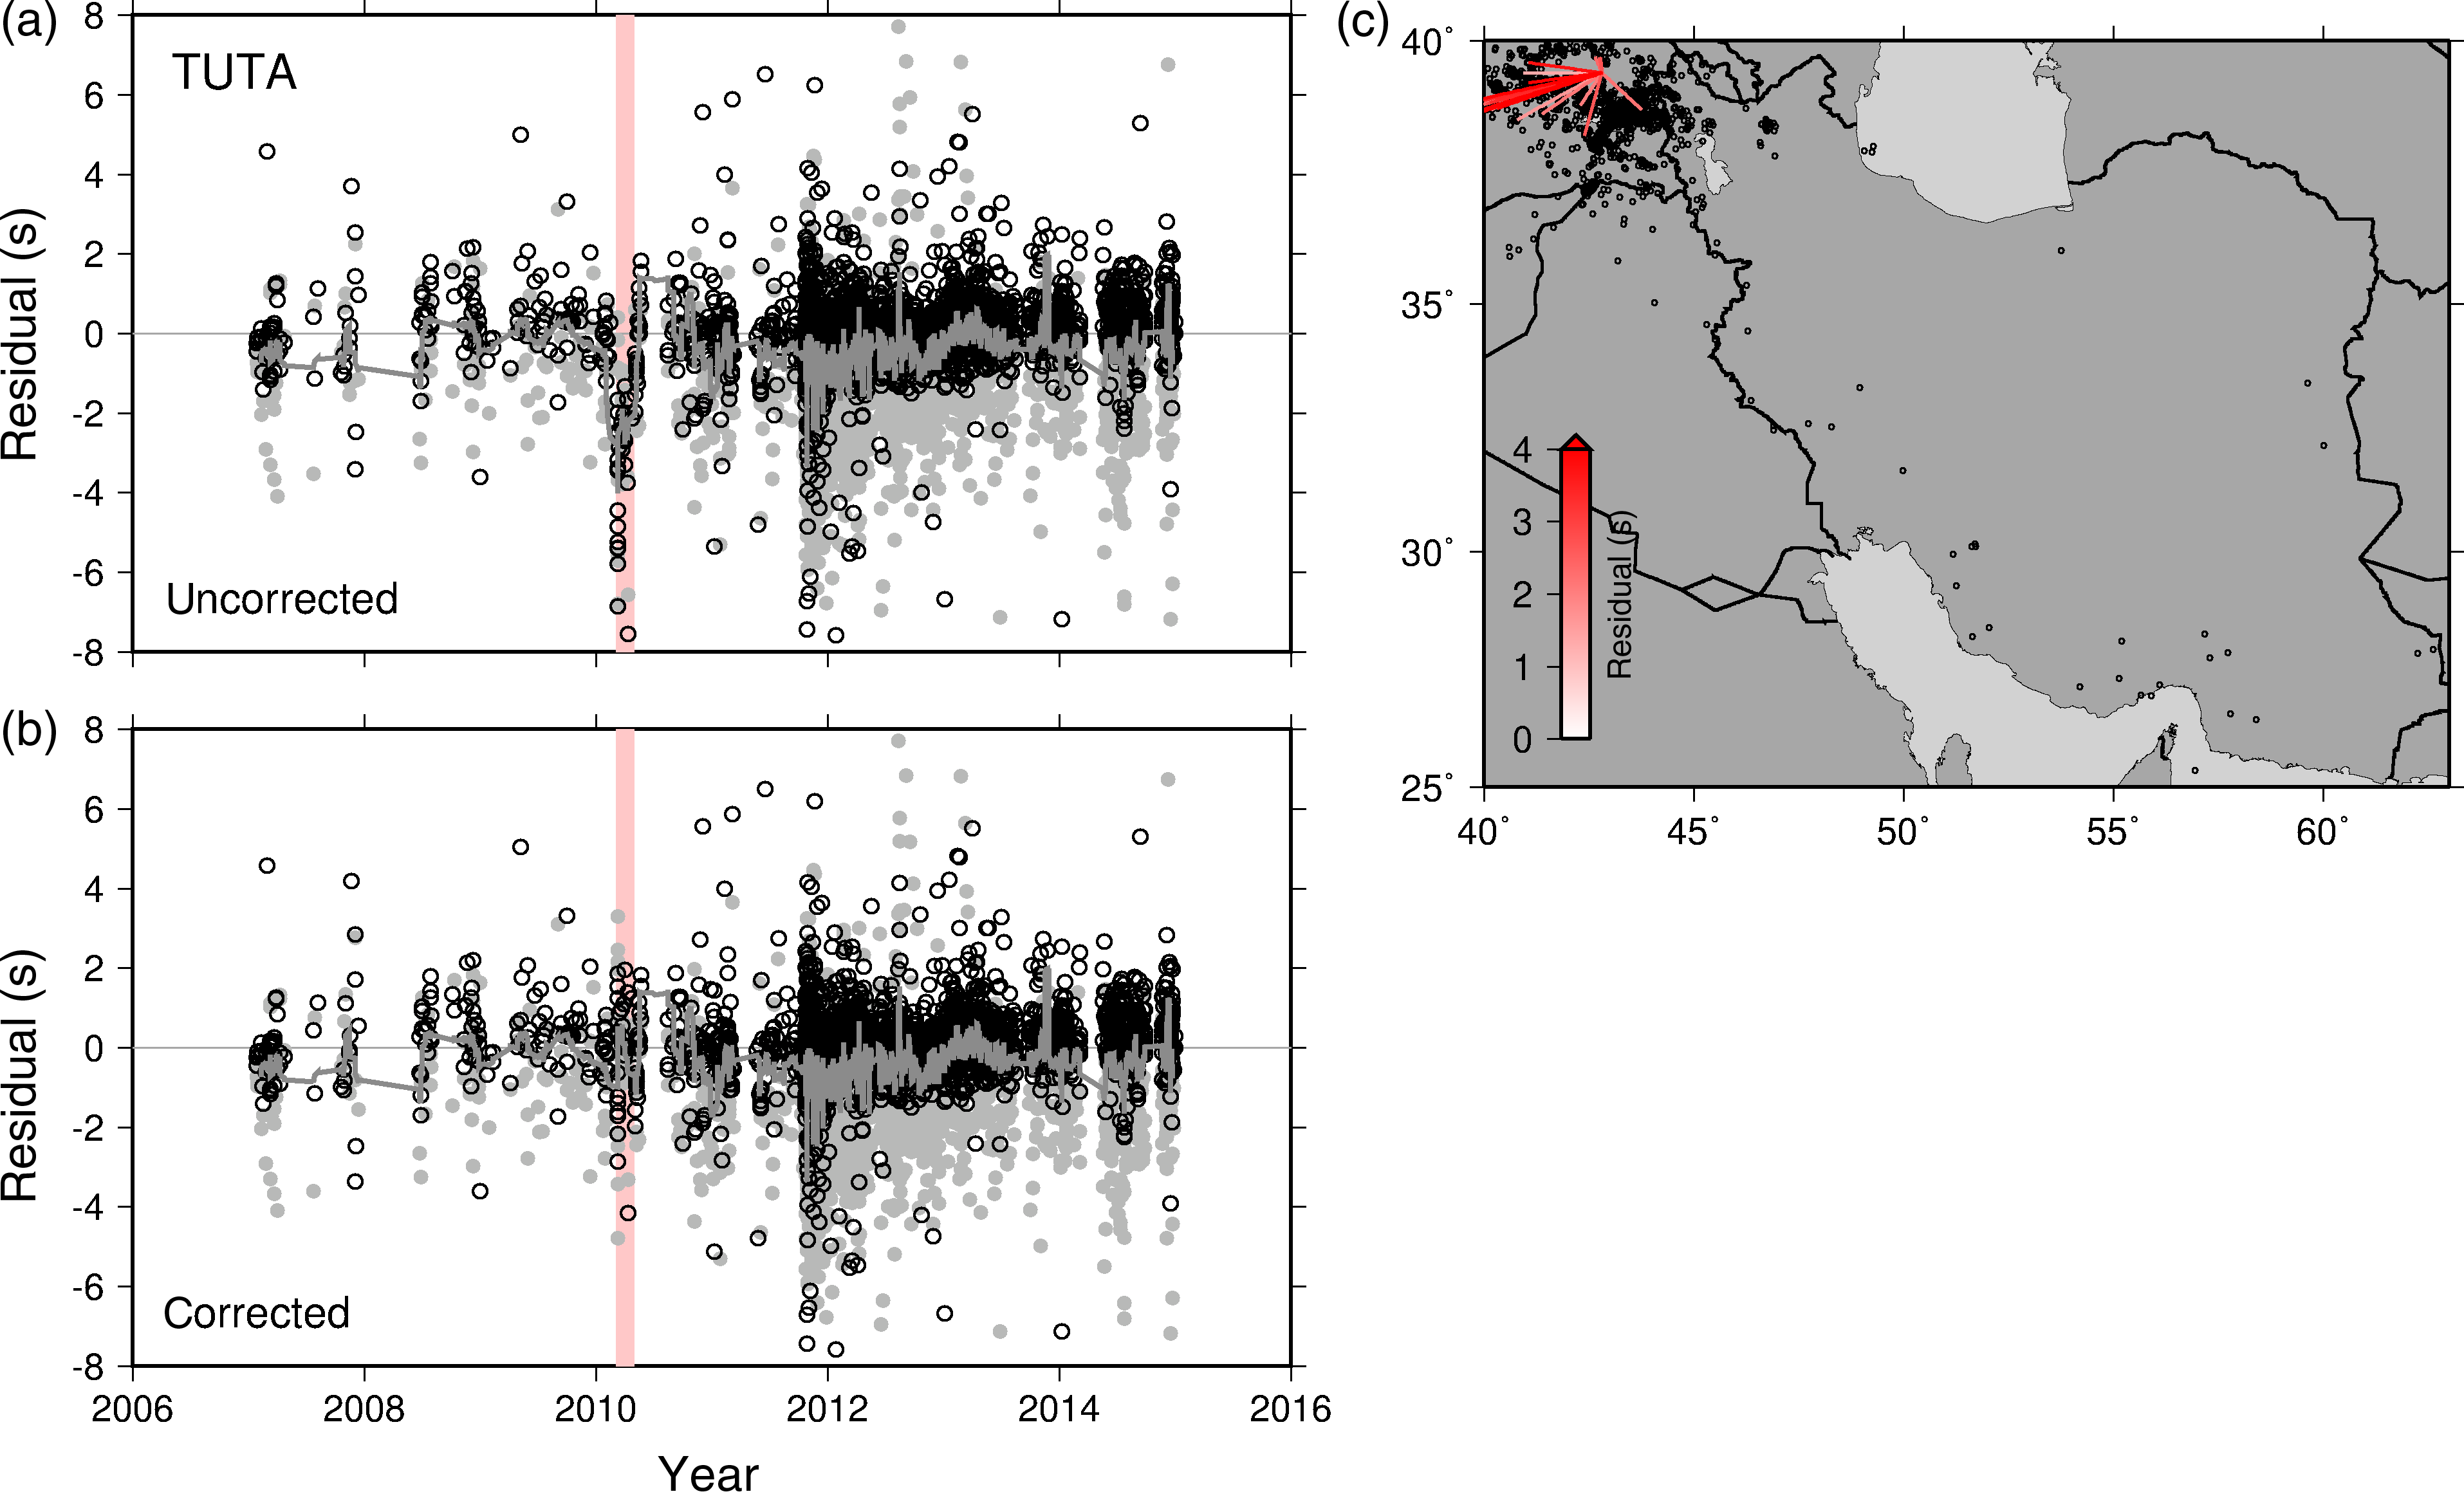
Figure S14. (a) Uncorrected residuals over time for Station TUTA. The period of interest is highlighted in pink. P-wave residuals are shown as open circles, and S-wave residuals are shown as gray circles. The jagged gray line shows the 20-point moving average of all residuals over time. (b) Residuals over time, with those in the period of interest corrected by 4.0 s (Table 1 in the main article). (c) Ray paths for P waves recorded at Station TUTA during the period of interest. Small circles show the locations of all earthquakes recorded at Station TUTA, and line color indicates the magnitude of the residual.
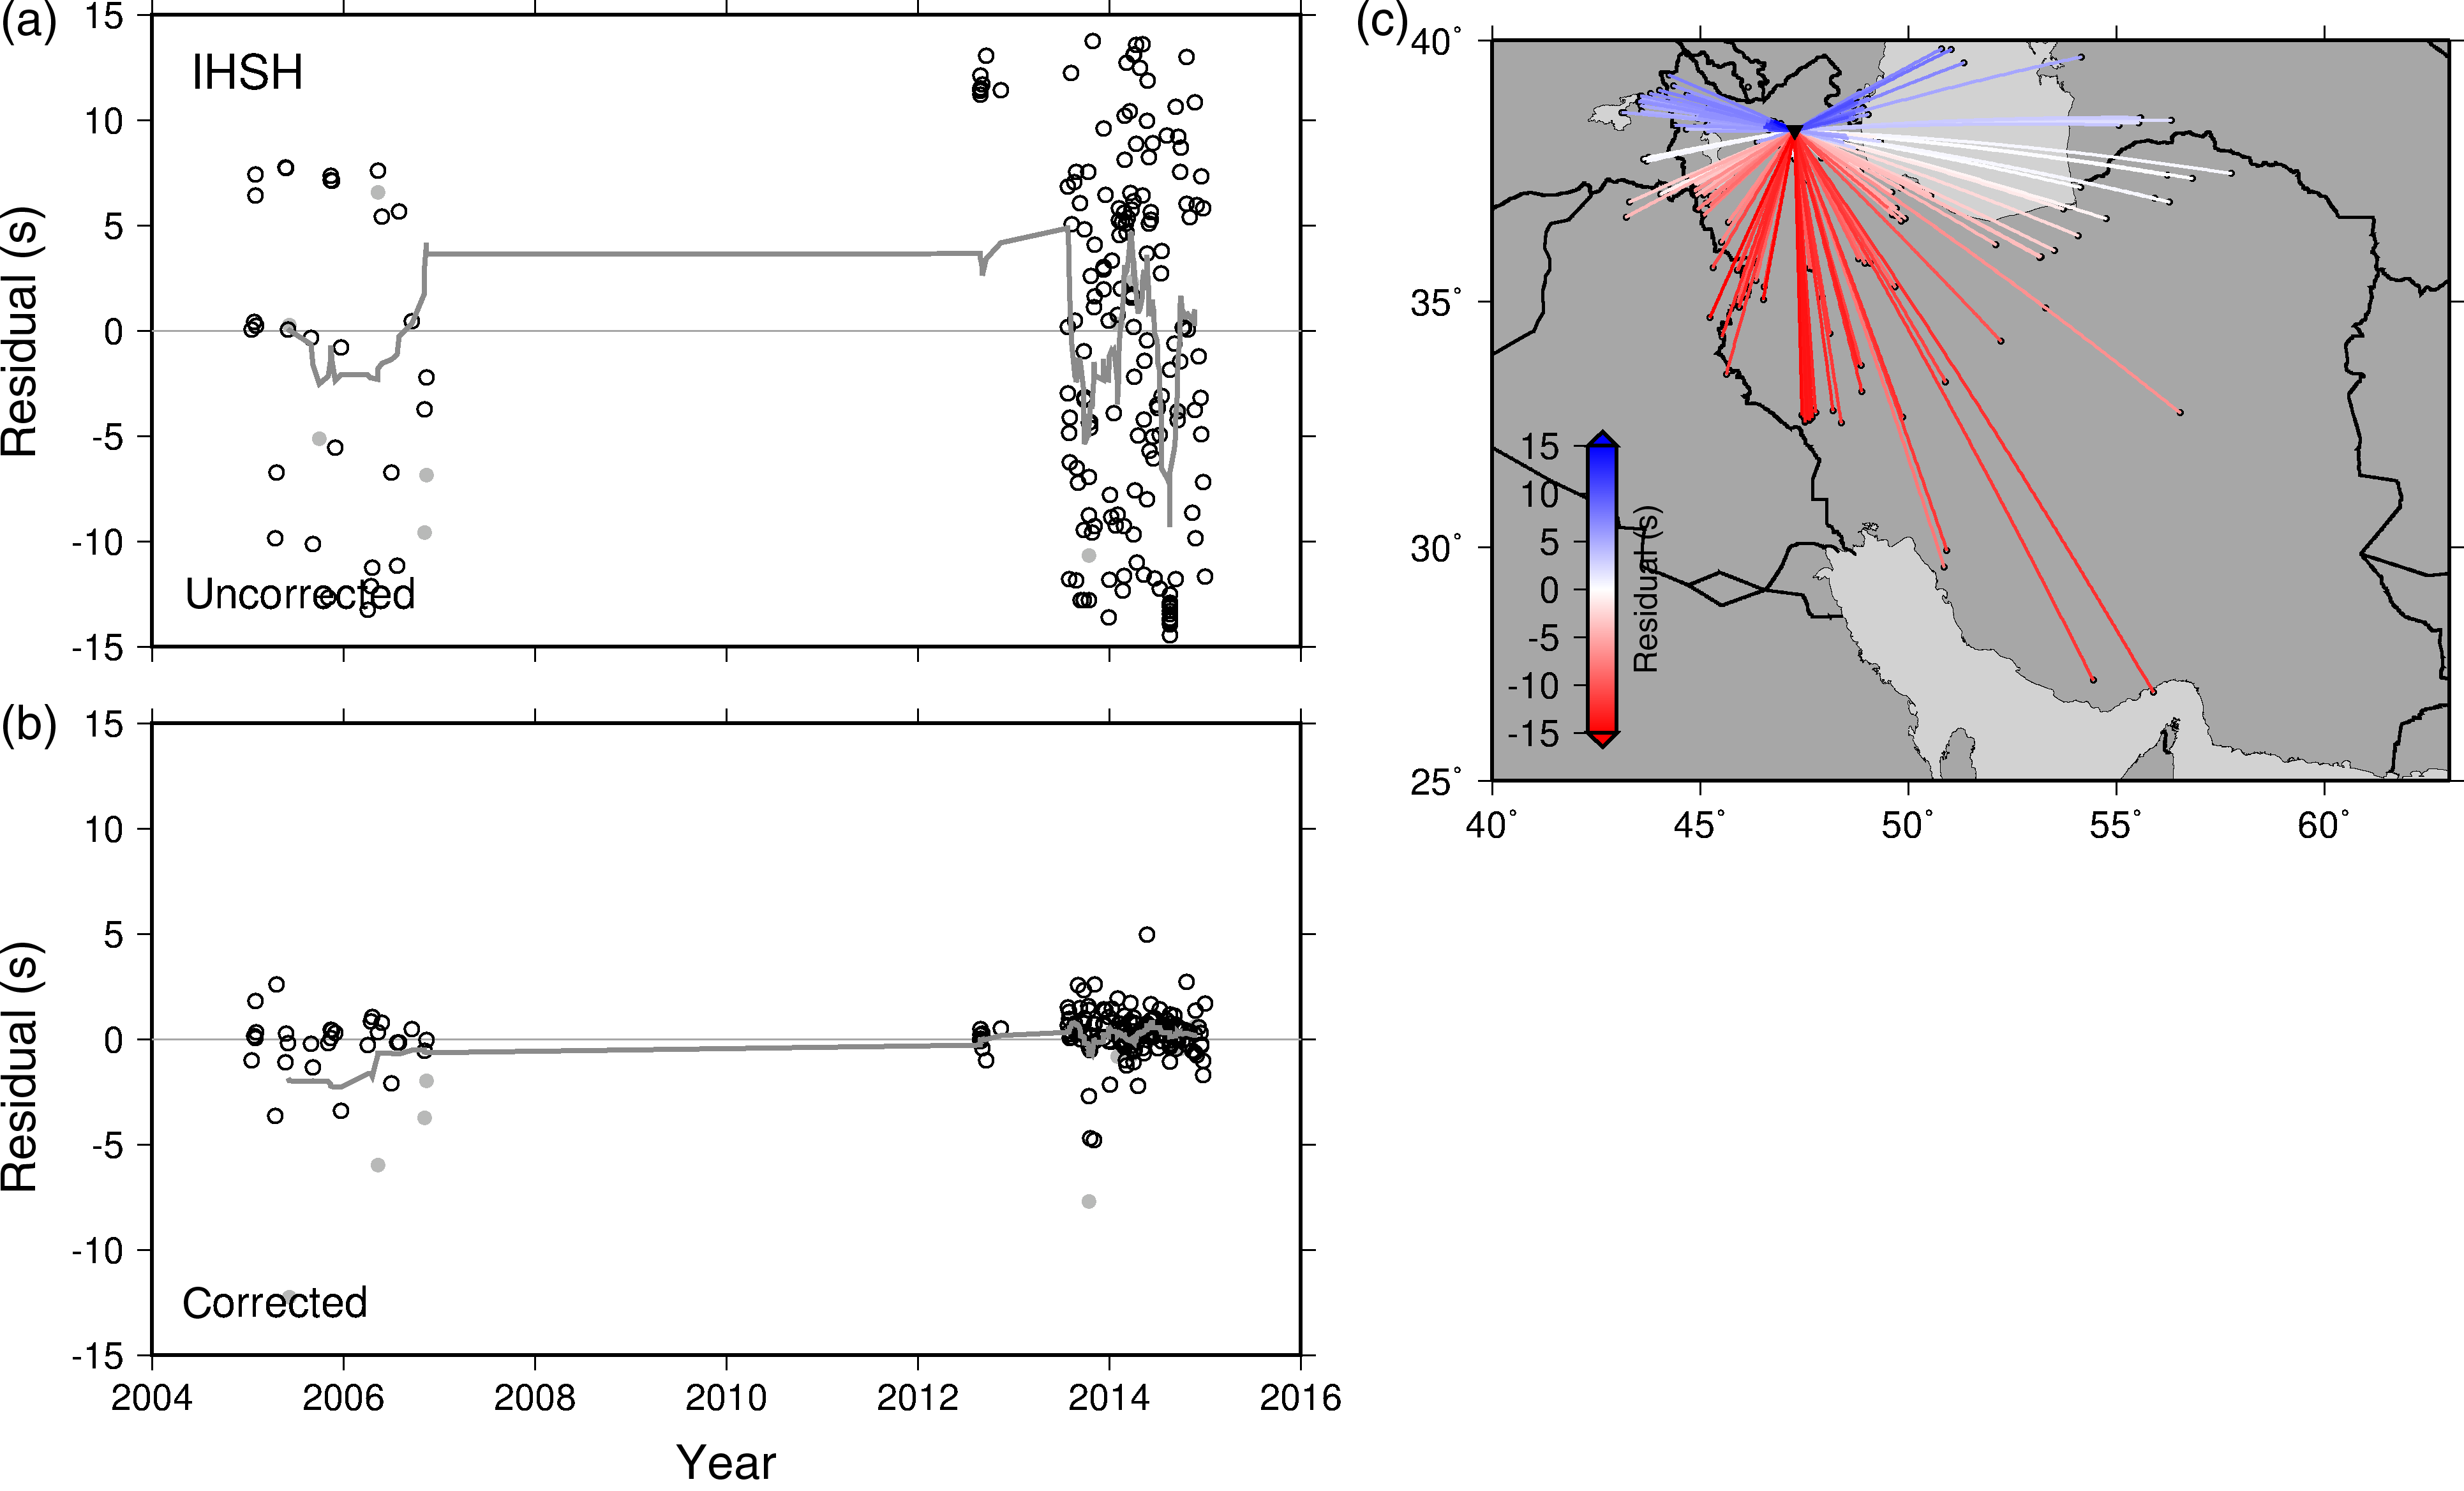
Figure S15. (a) Residuals over time for Station IHSH using the location reported by the International Registry of Seismograph Stations. P-wave residuals are shown as open circles, and S-wave residuals are shown as gray circles. The jagged gray line shows the 20-point moving average of all residuals over time. (b) Residuals over time using the corrected location (Table 1 in the main article). (c) Ray paths for P waves recorded at Station IKRD, with line color indicating the polarity and size of residuals using the reported location.
Figure S16. (a) Residuals over time for Station IKRD using the location reported by the International Registry of Seismograph Stations. P-wave residuals are shown as open circles, and S-wave residuals are shown as gray circles. The jagged gray line shows the 20-point moving average of all residuals over time. (b) Residuals over time using the corrected location (Table 1 in the main article). (c) Ray paths for P waves recorded at Station IKRD, with line color indicating the polarity and size of residuals using the reported location.
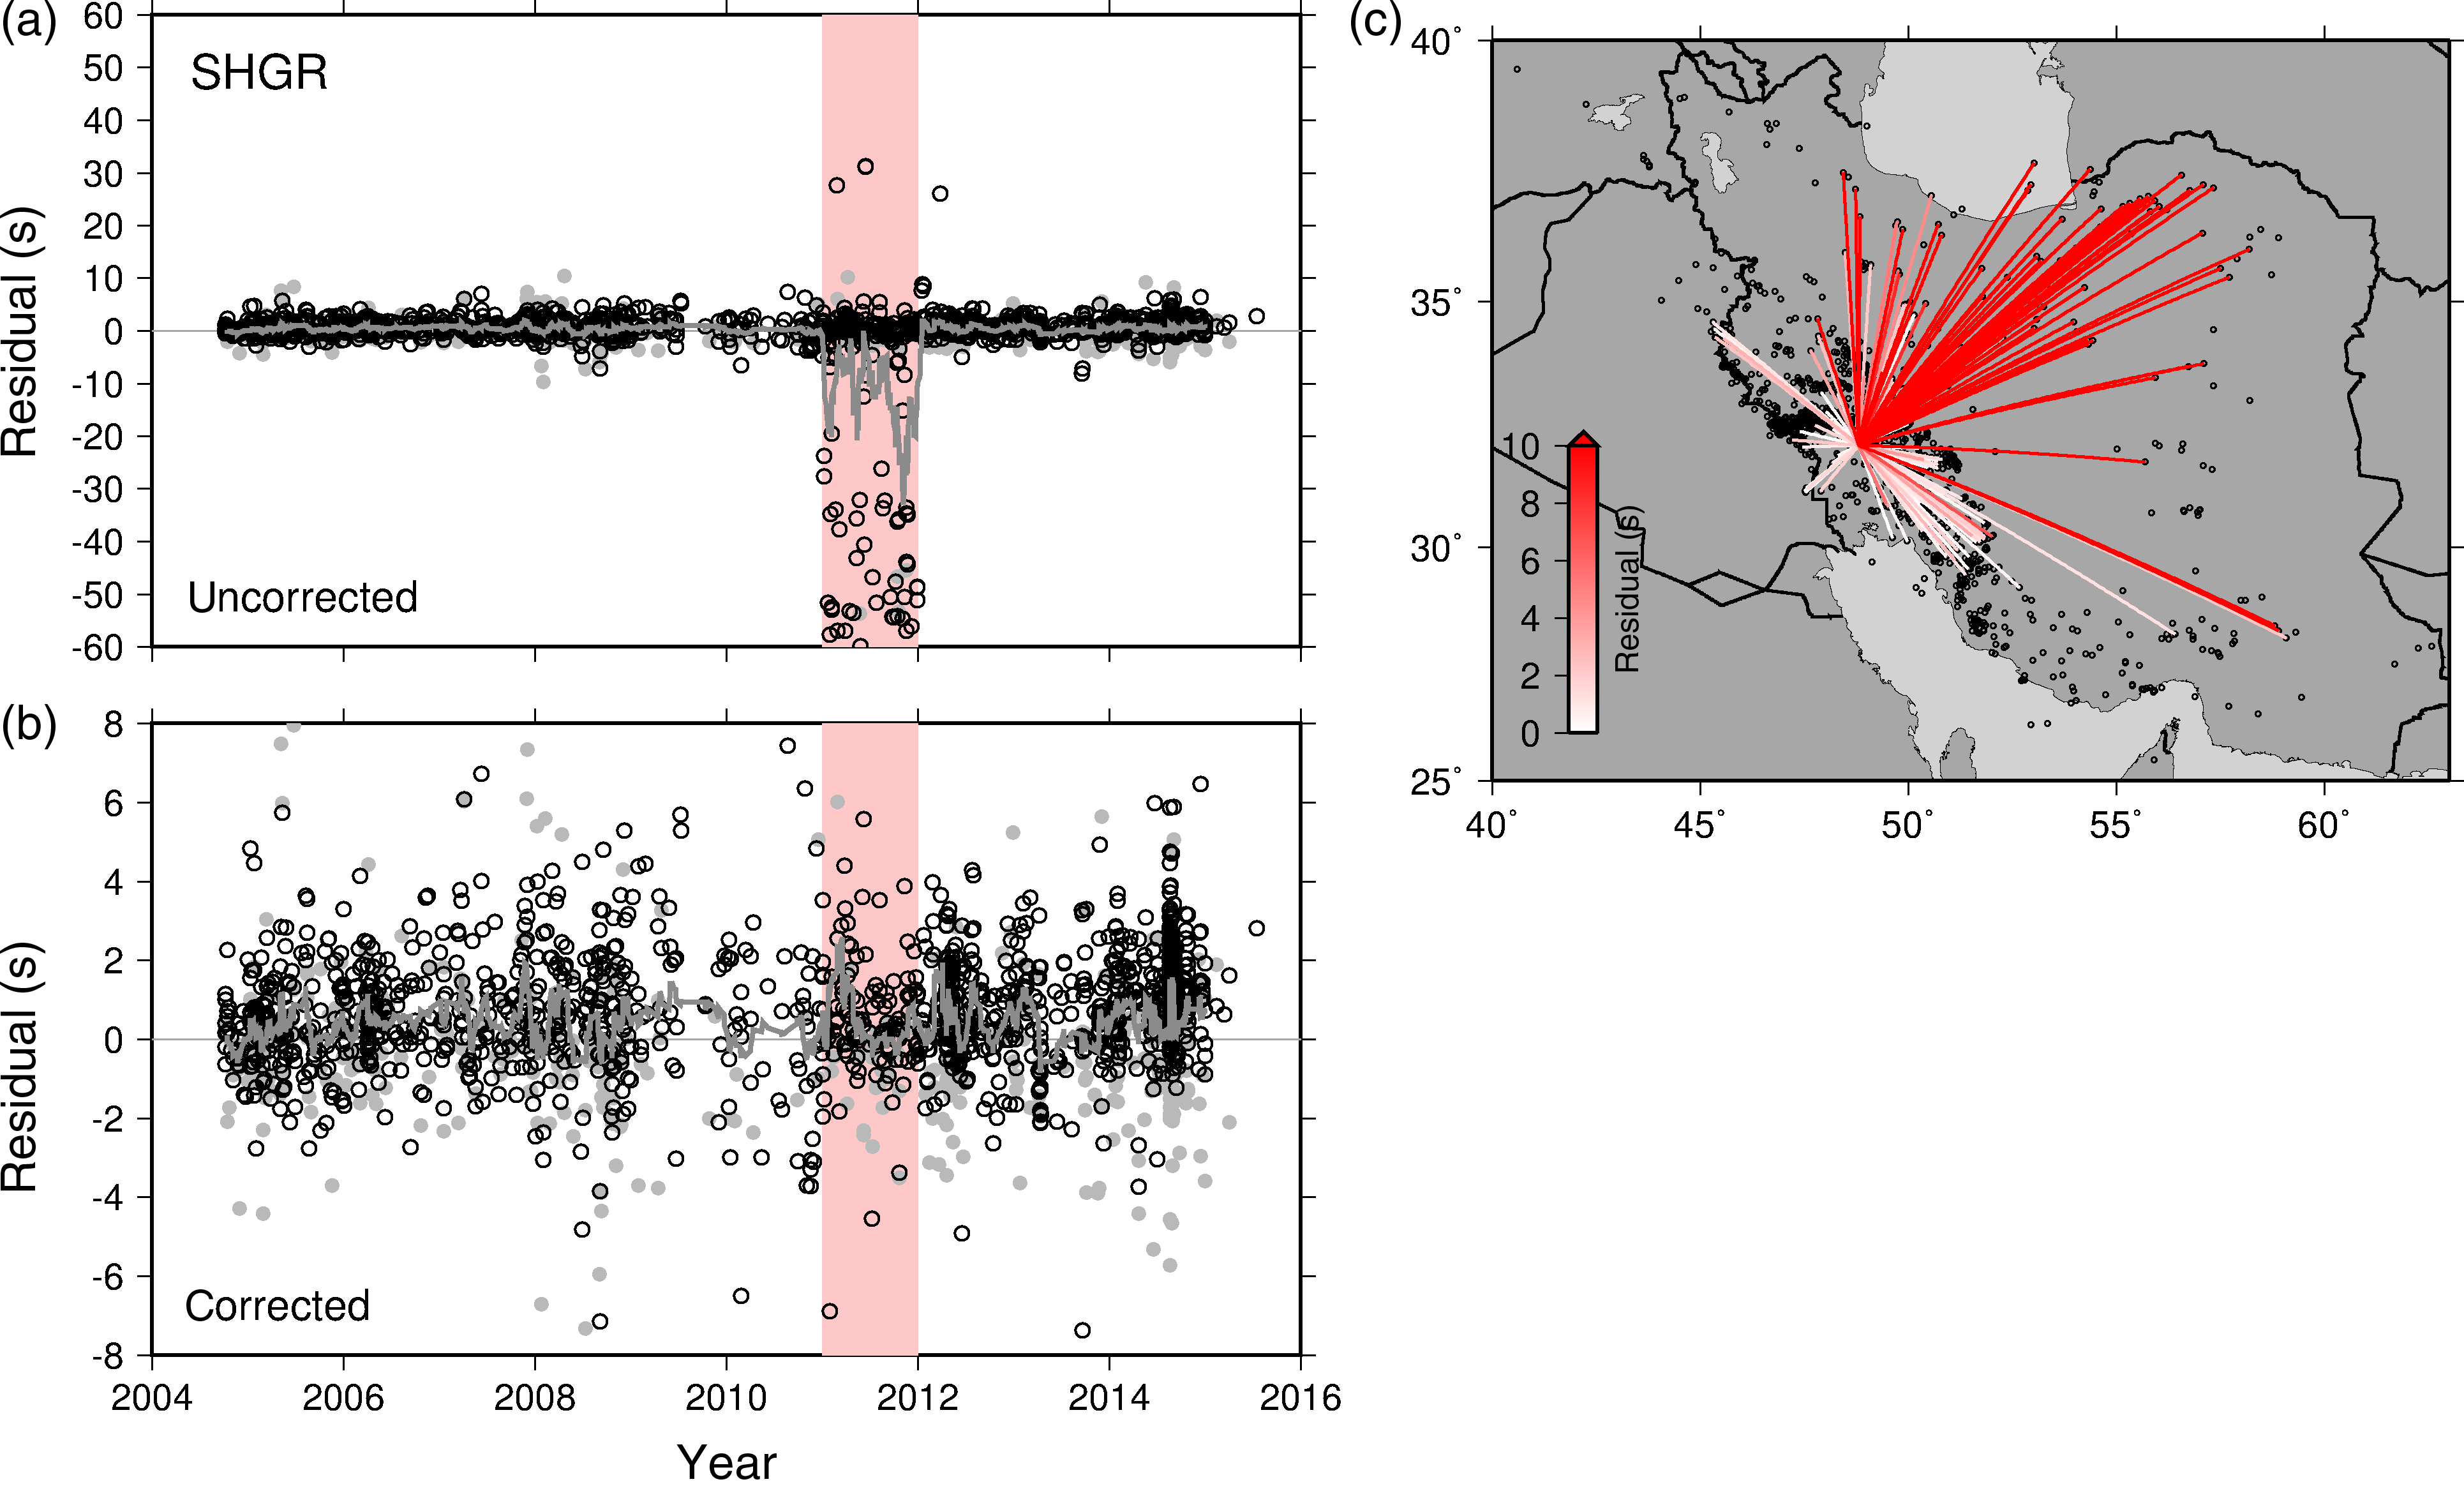
Figure S17. (a) Residuals over time for Station SHGR. The period of interest is highlighted in pink. P-wave residuals are shown as open circles, and S-wave residuals are shown as gray circles. The jagged gray line shows the 20-point moving average of all residuals over time. (b) Residuals over time with arrivals matching those reported for Stations ISHM, ISHV, SHRO, or SHRT removed. Note the change of scale on the vertical axis from (a). (c) Ray paths for P waves recorded at Station SHGR during the period of interest. Small circles show the locations of all earthquakes recorded at Station SHGR, and line color indicates the magnitude of the residual.
[ Back ]