This supplemental material contains figures showing the seismic station distribution and negative and positive examples for a Doppler effect visible in the spectrograms.
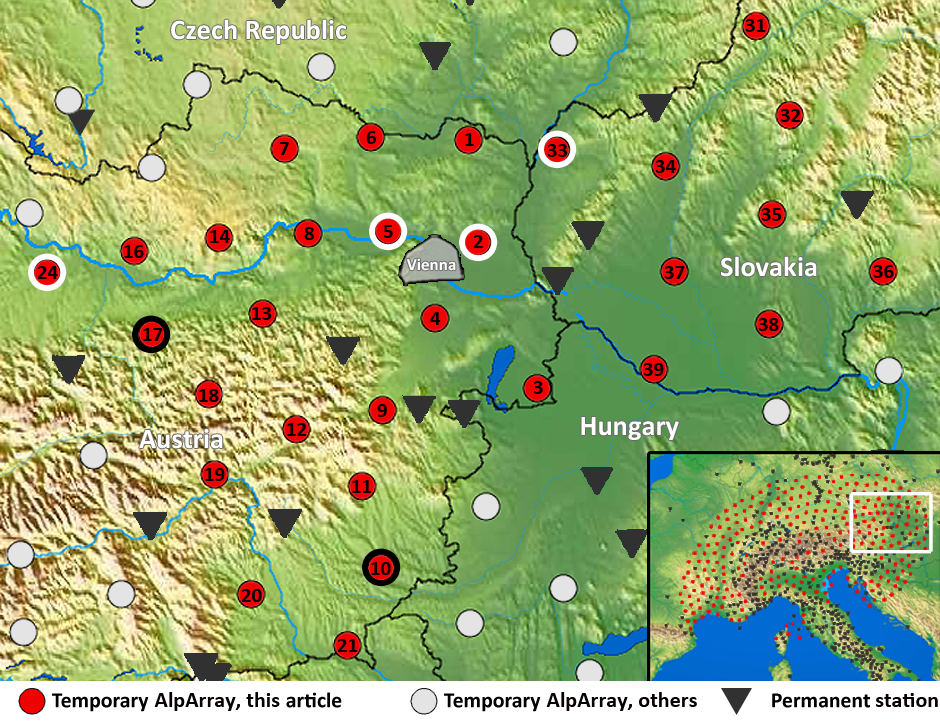
Figure S1. Map of all temporary seismic stations investigated for this study (red dots). Dots highlighted in white denote stations with data examples shown in this article. Dots highlighted in black denote stations where similar train signals were observed, but data are not shown in this article. All stations marked with dots are part of the temporary AlpArray Seismic Network (2015).
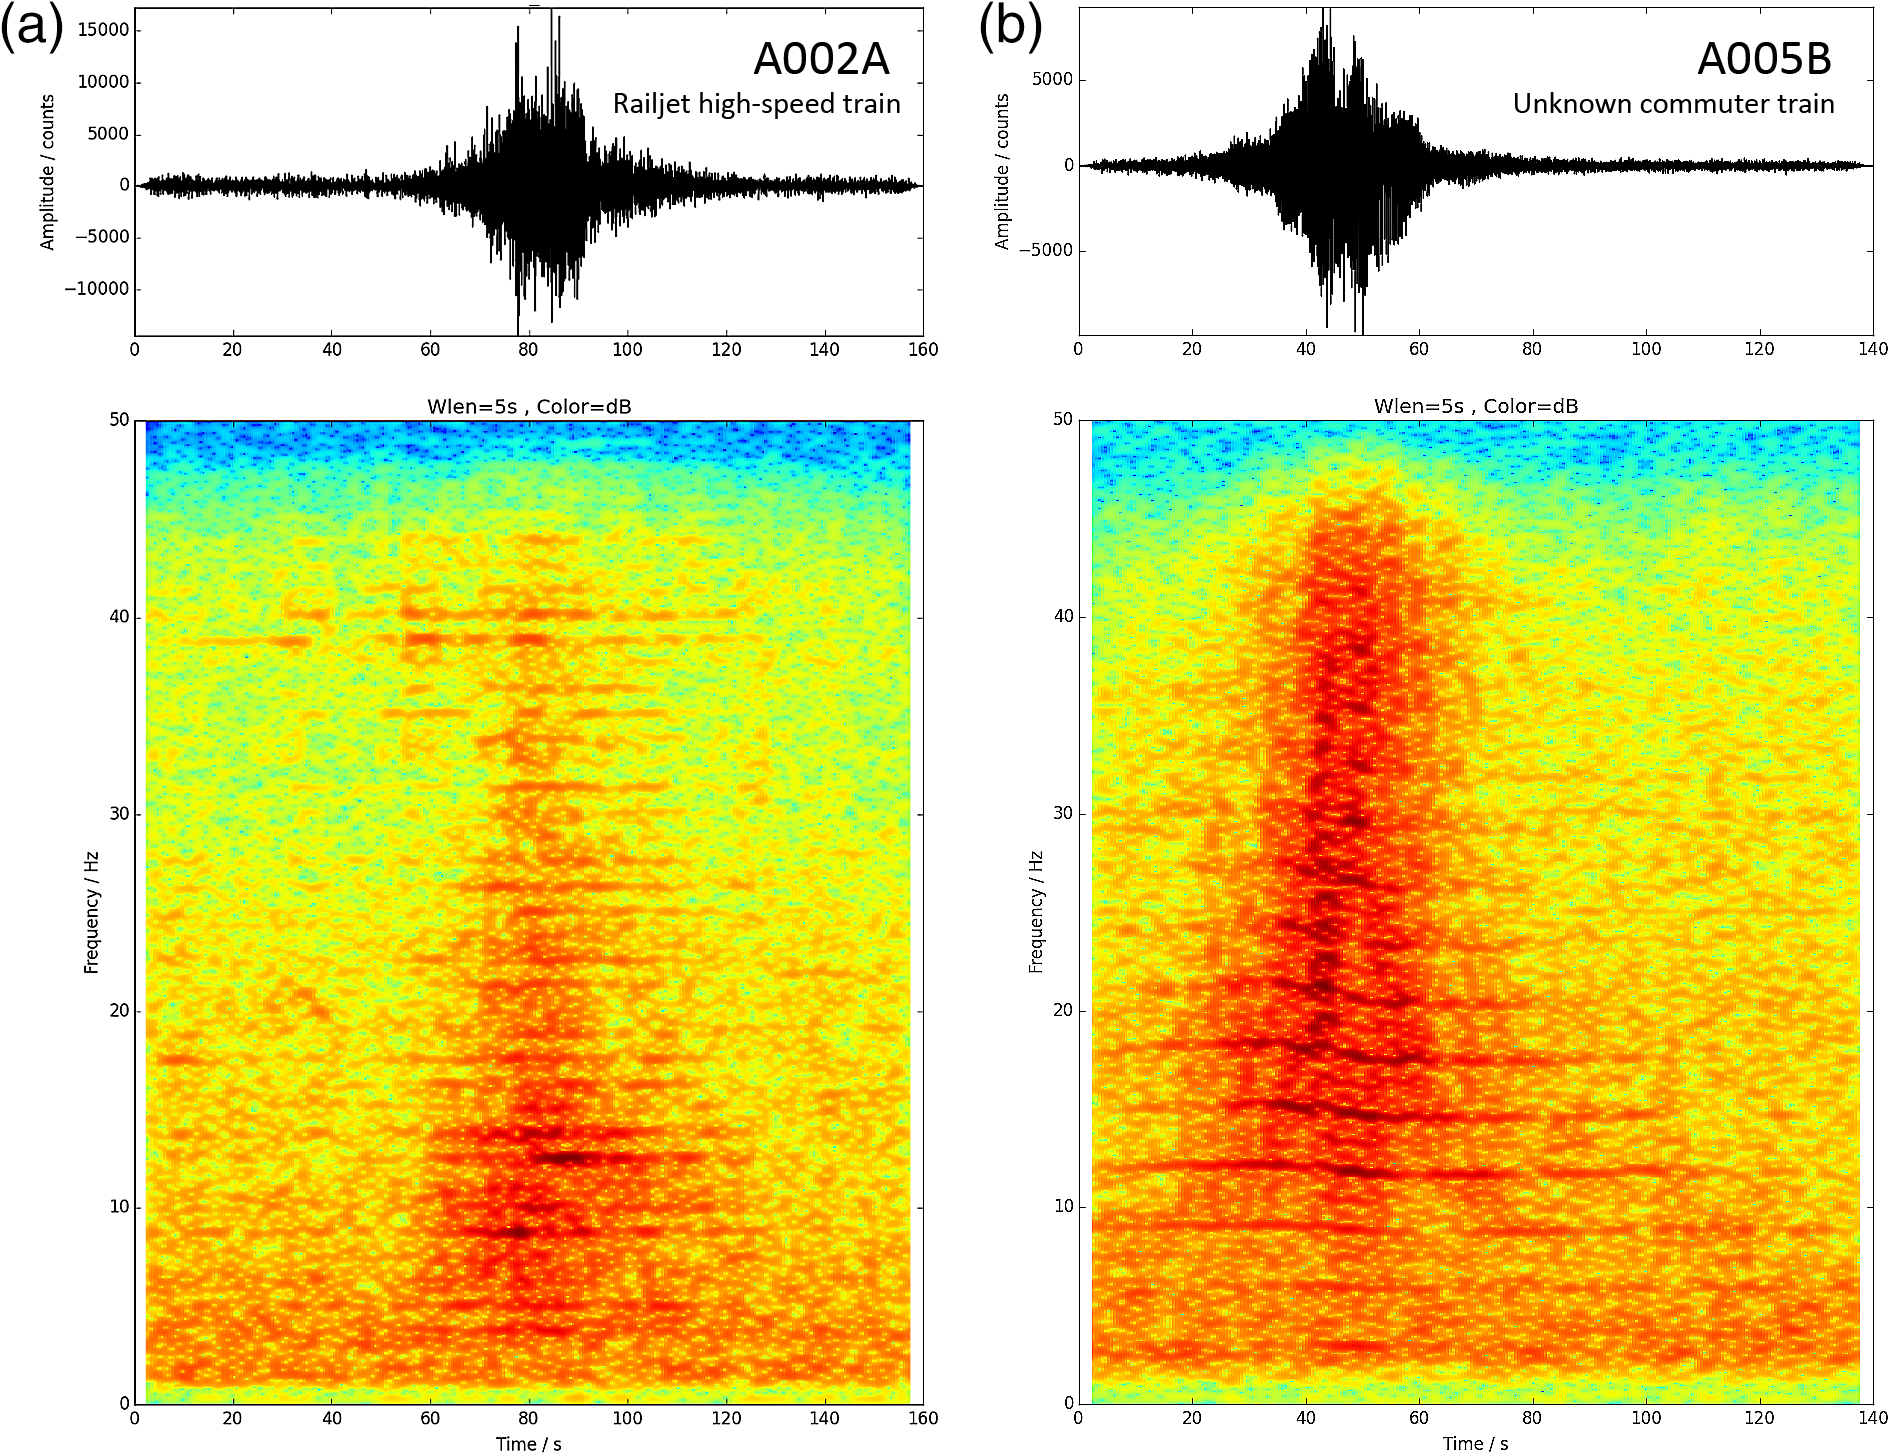
Figure S2. (a) Example for a high-speed train recorded at A002A. This is the same example as in Figures 1 and 4 of the main article. No Doppler effect can be identified. (b) Example from A005B, Stockerau, Austria. Signal of an unknown train unit, potentially showing Doppler effect. Note the apparent transition to lower frequencies between the approaching and departing part (left and right of the center, respectively) of the signal. The shift in frequency is steeper for higher frequencies, which would be expected for a Doppler effect.
AlpArray Seismic Network (2015). AlpArray Seismic Network (AASN) Temporary Component, AlpArray Working Group, Datacite link: http://data.datacite.org/10.12686/alparray/z3_2015; Project webpage: http://www.alparray.ethz.ch (last accessed October 2017).
[ Back ]