This electronic supplement contains 14 figures and 4 tables. Each figure shows the preprocessed original waveforms aligned with the synthetics for the corresponding event. The alignment and the travel-time delay shown in each panel are obtained after following the procedure described in the Travel-Time Picks section in the main article. The tables give a list of stations and the values for the applied corrections, that is, mantle correction, station correction, and event correction.
Table S1 [Plain Text Comma-Separated Values; 4 KB]. Station list.
Table S2 [Plain Text Comma-Separated Values; 7 KB]. Mantle corrections derived from S40RTS. Values are given for each station, event, and phase in seconds.
Table S3 [Plain Text Comma-Separated Values; 970 Bytes]. Station corrections.
Table S4 [Plain Text Comma-Separated Values; 164 Bytes]. Event corrections.
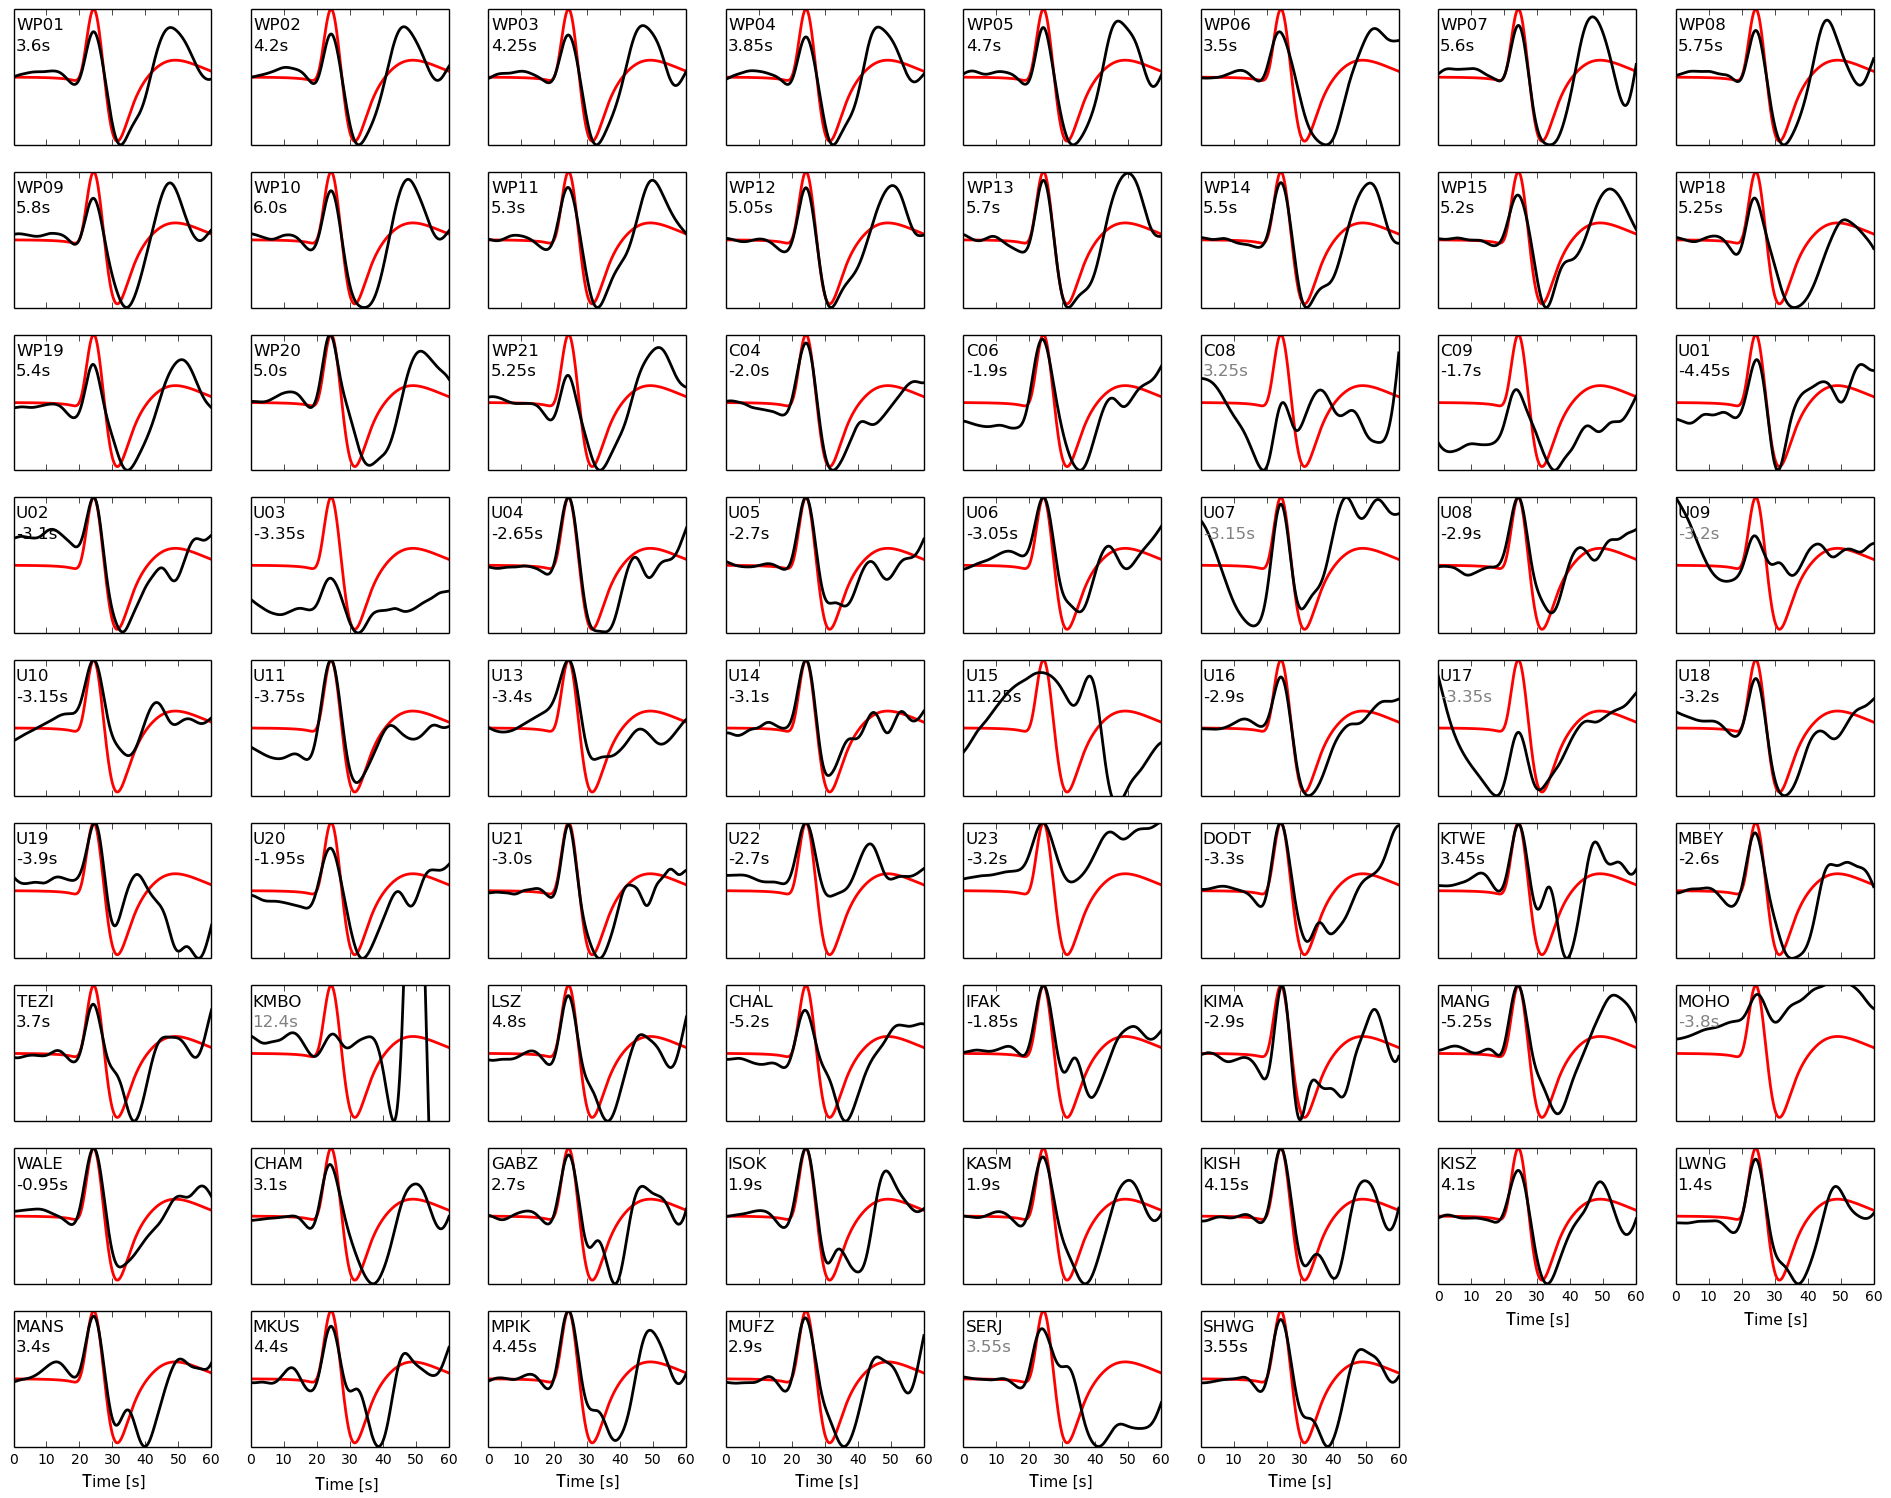
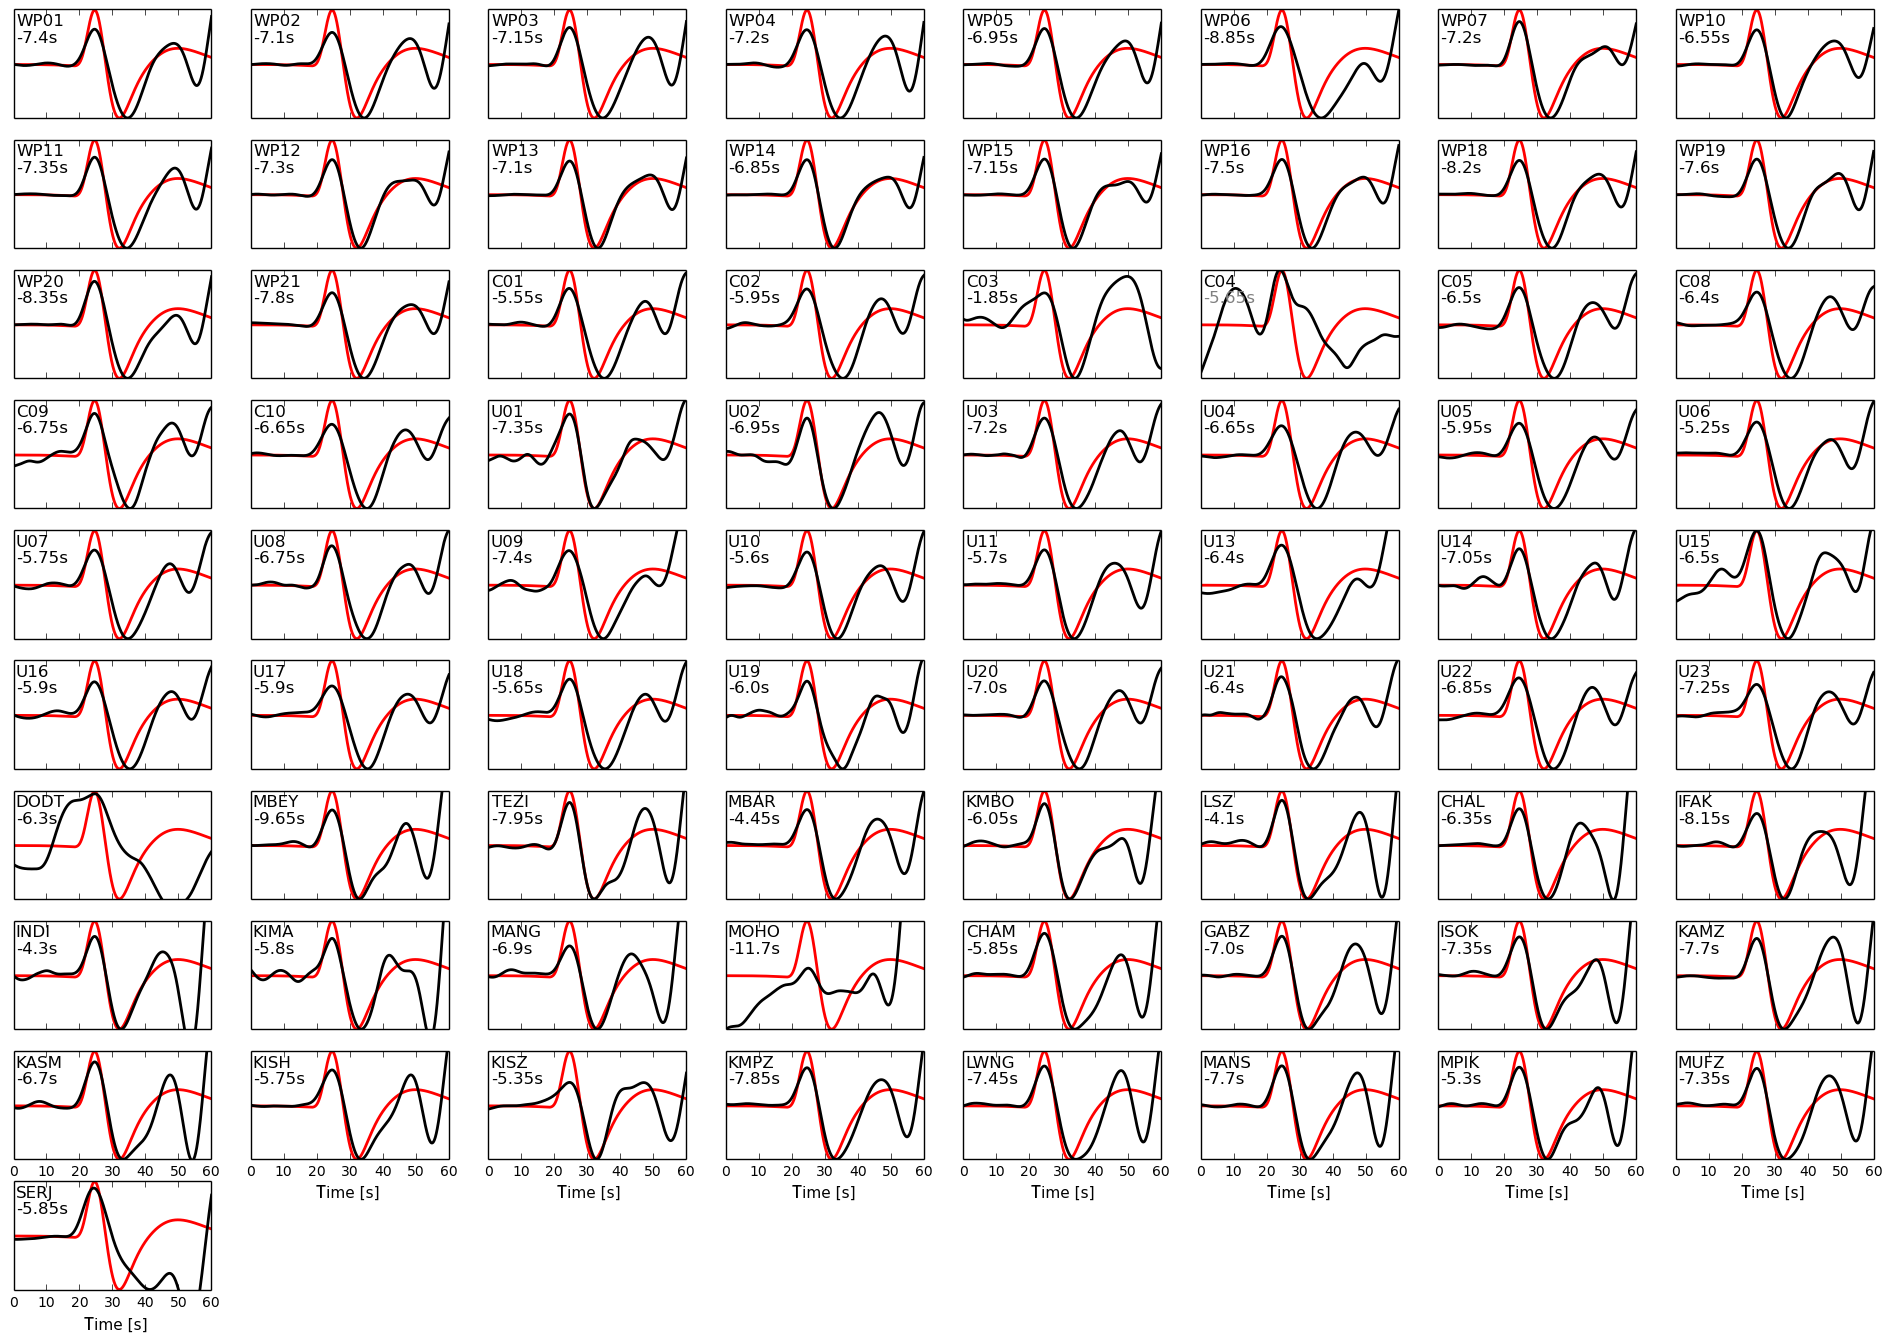
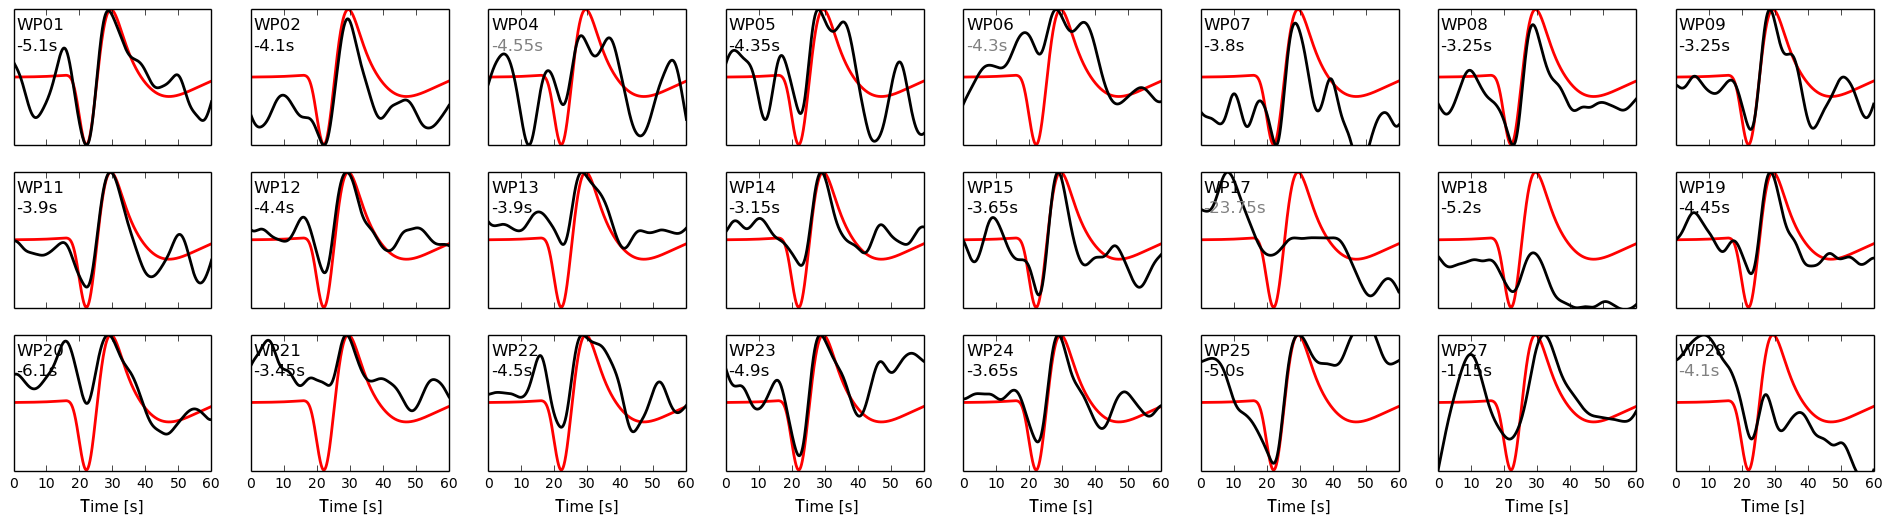
Figure S1. Event SS2011-03-06 and phase S (SV). Original waveforms (black) and synthetics (red) aligned at the correlation maximum. Station names and resulting travel-time delays (without corrections) are given in each panel. For correlation coefficients lower than 0.8, the travel-time delay is given in gray; these data have not been used in the study.
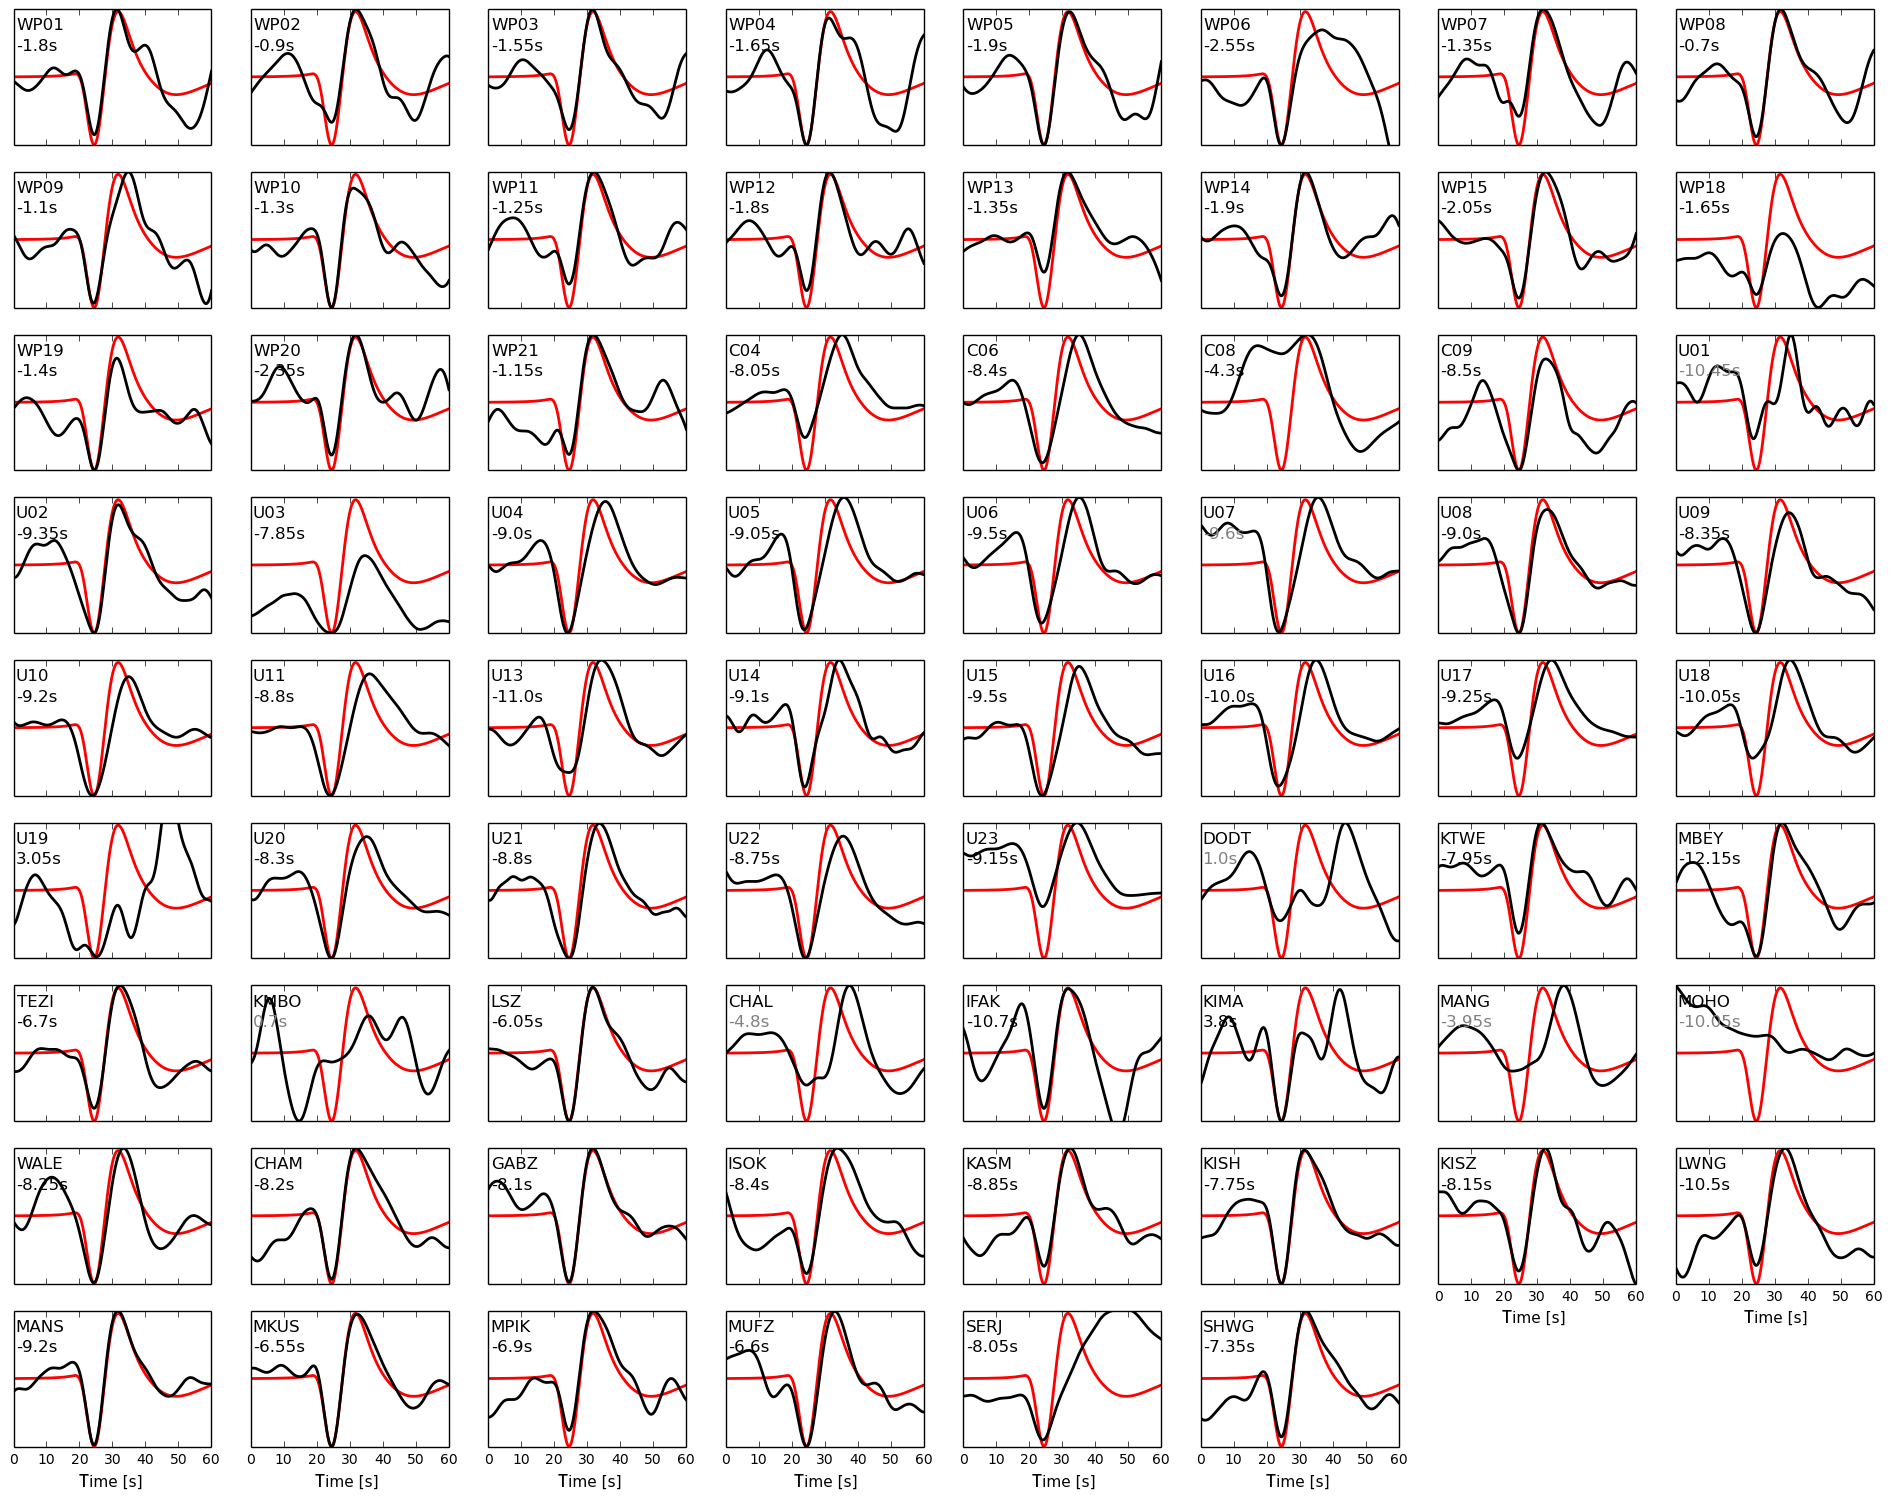
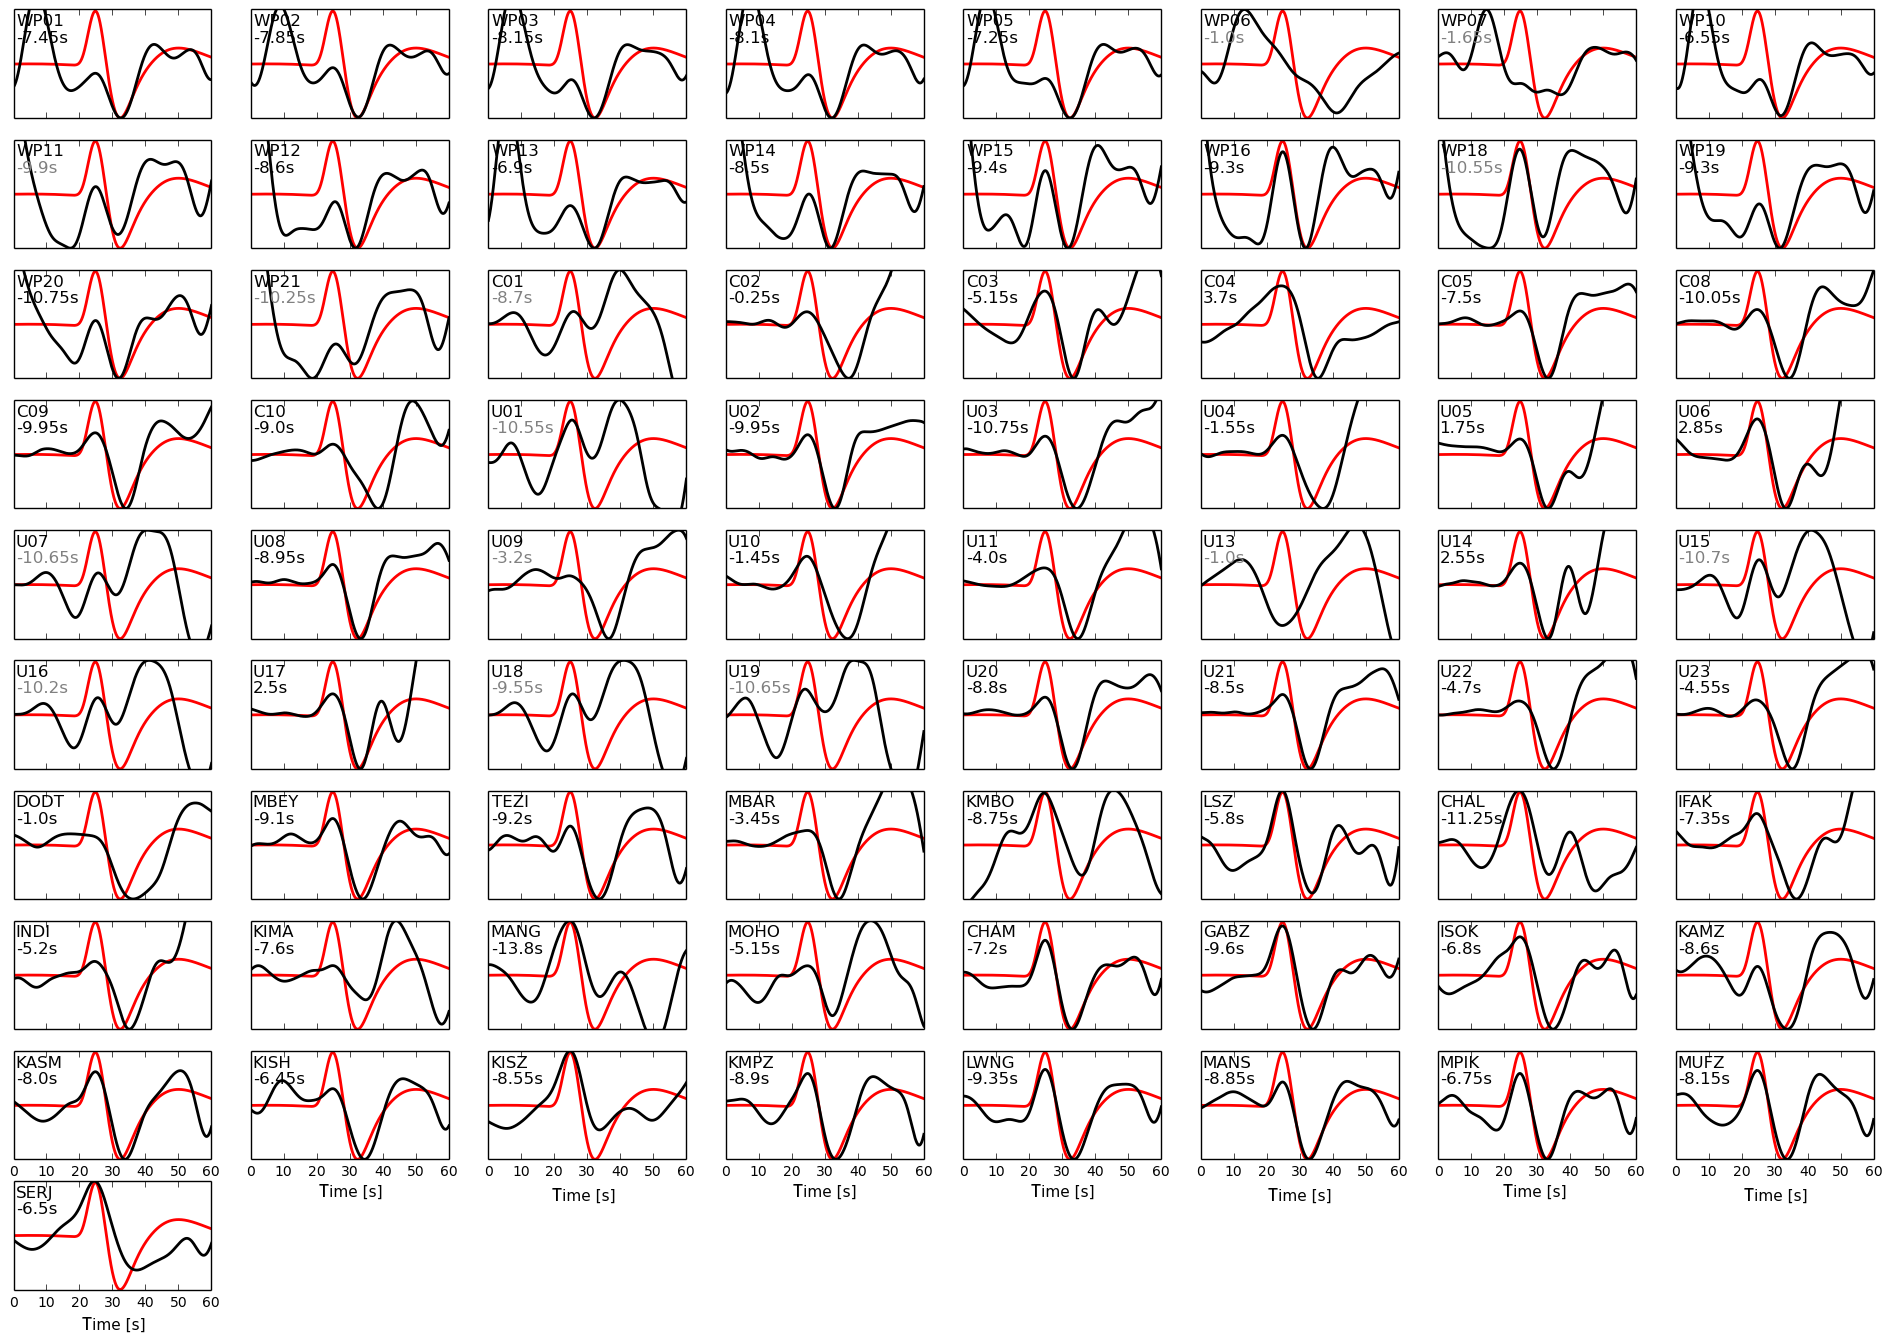
Figure S2. Event SS2011-03-06 and phase ScS (SV). Original waveforms (black) and synthetics (red) aligned at the correlation maximum. Station names and resulting travel-time delays (without corrections) are given in each panel. For correlation coefficients lower than 0.8, the travel-time delay is given in gray; these data have not been used in the study.
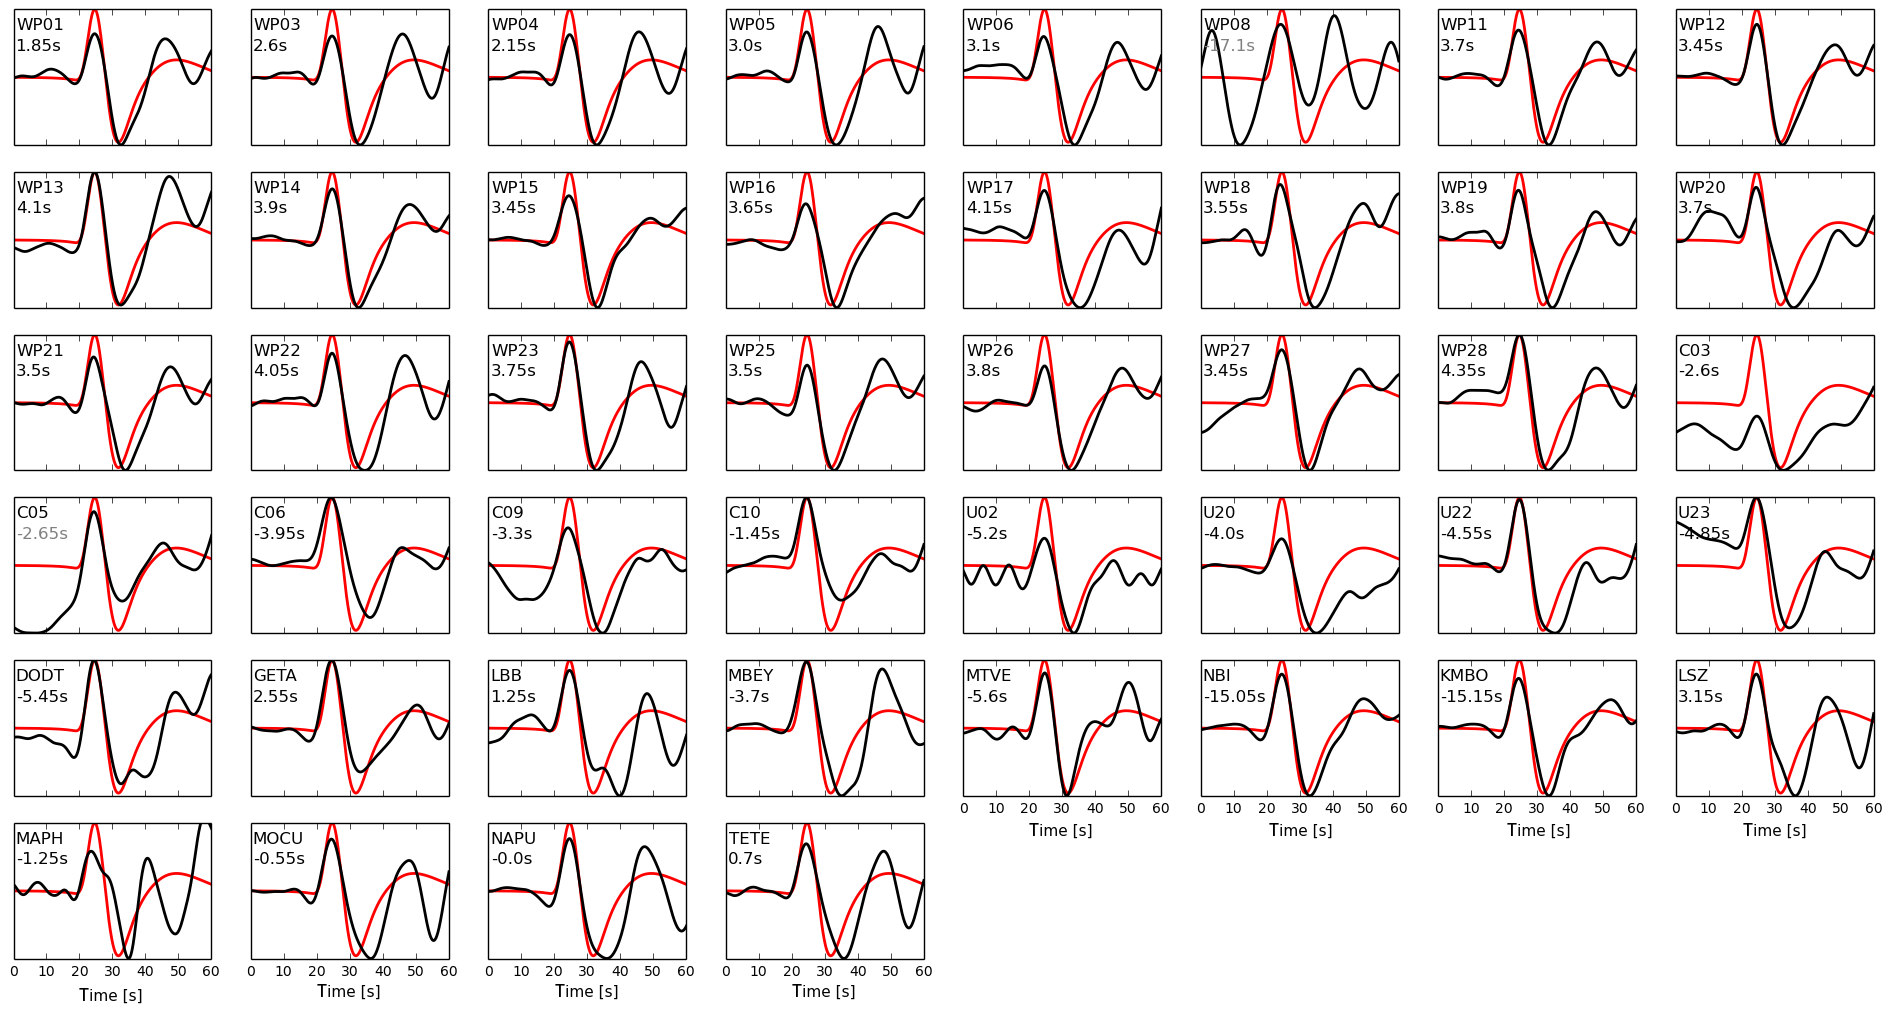
Figure S3. Event SS2011-09-03 and phase S (SV). Original waveforms (black) and synthetics (red) aligned at the correlation maximum. Station names and resulting travel-time delays (without corrections) are given in each panel. For correlation coefficients lower than 0.8, the travel-time delay is given in gray; these data have not been used in the study.
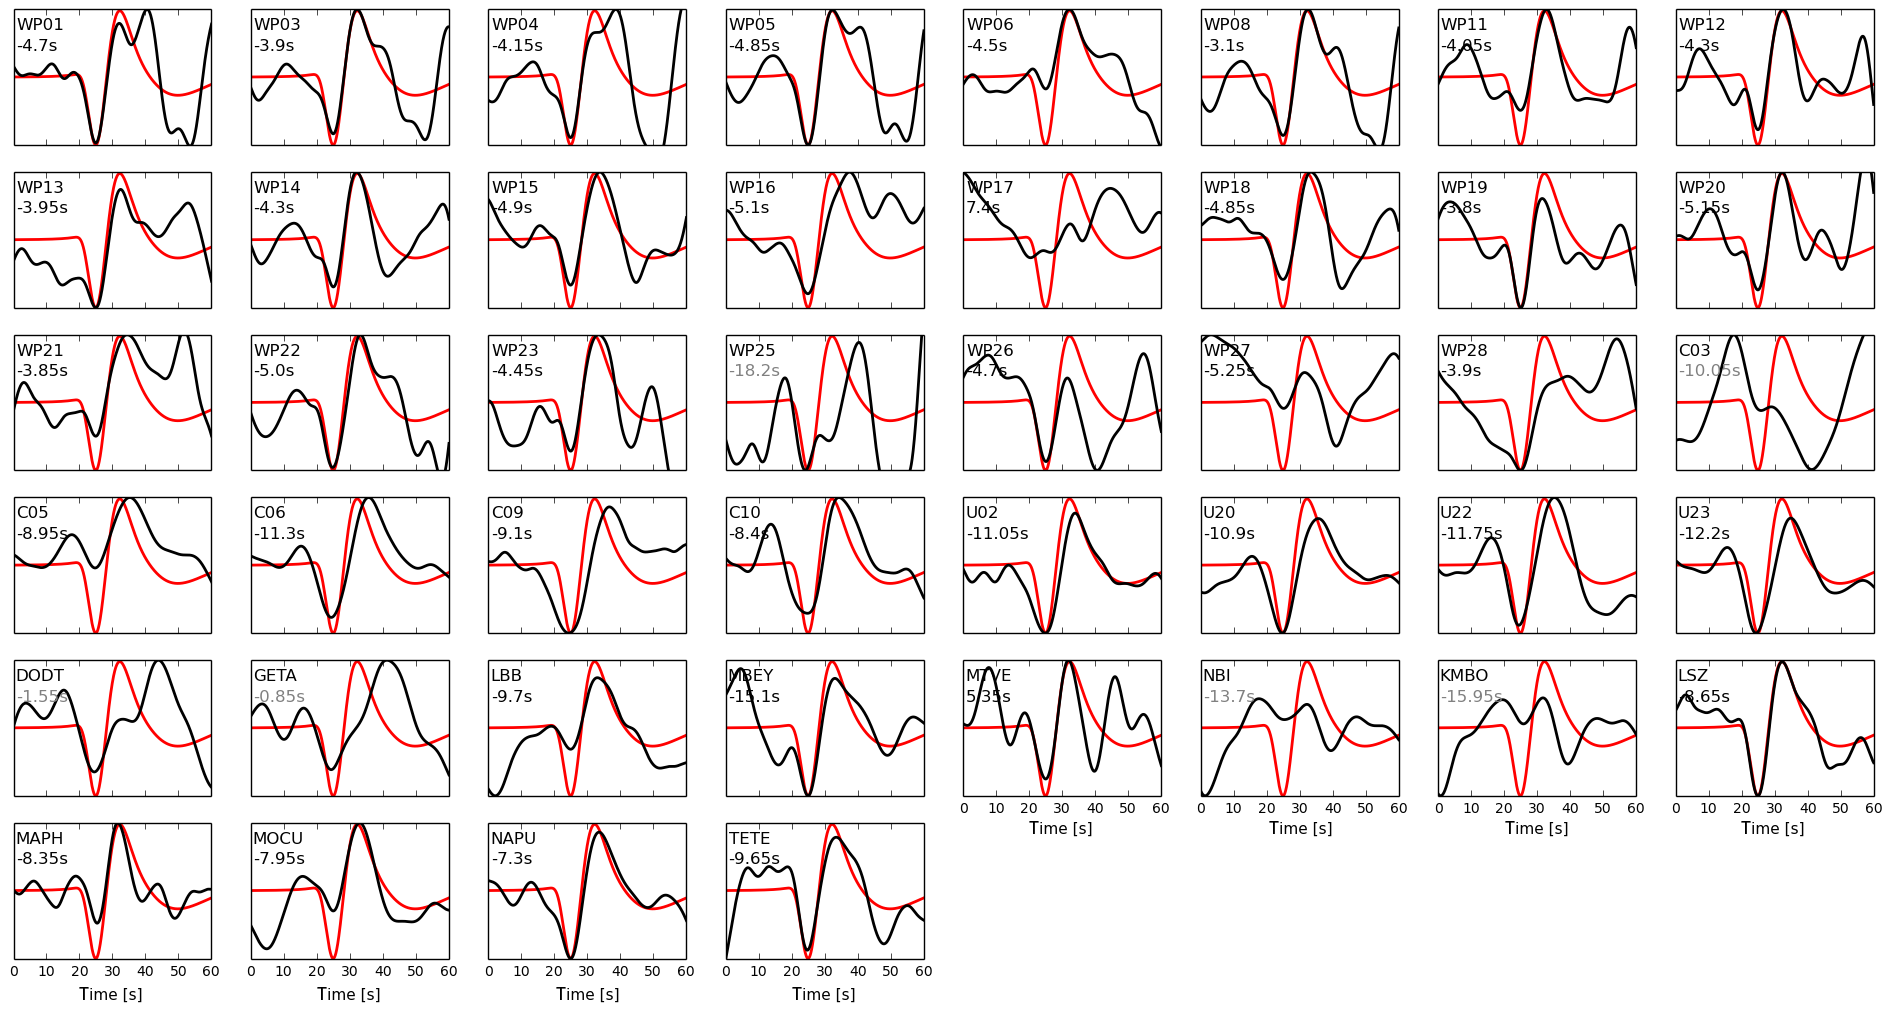
Figure S4. Event SS2011-09-03 and phase ScS (SV). Original waveforms (black) and synthetics (red) aligned at the correlation maximum. Station names and resulting travel-time delays (without corrections) are given in each panel. For correlation coefficients lower than 0.8, the travel-time delay is given in gray; these data have not been used in the study.
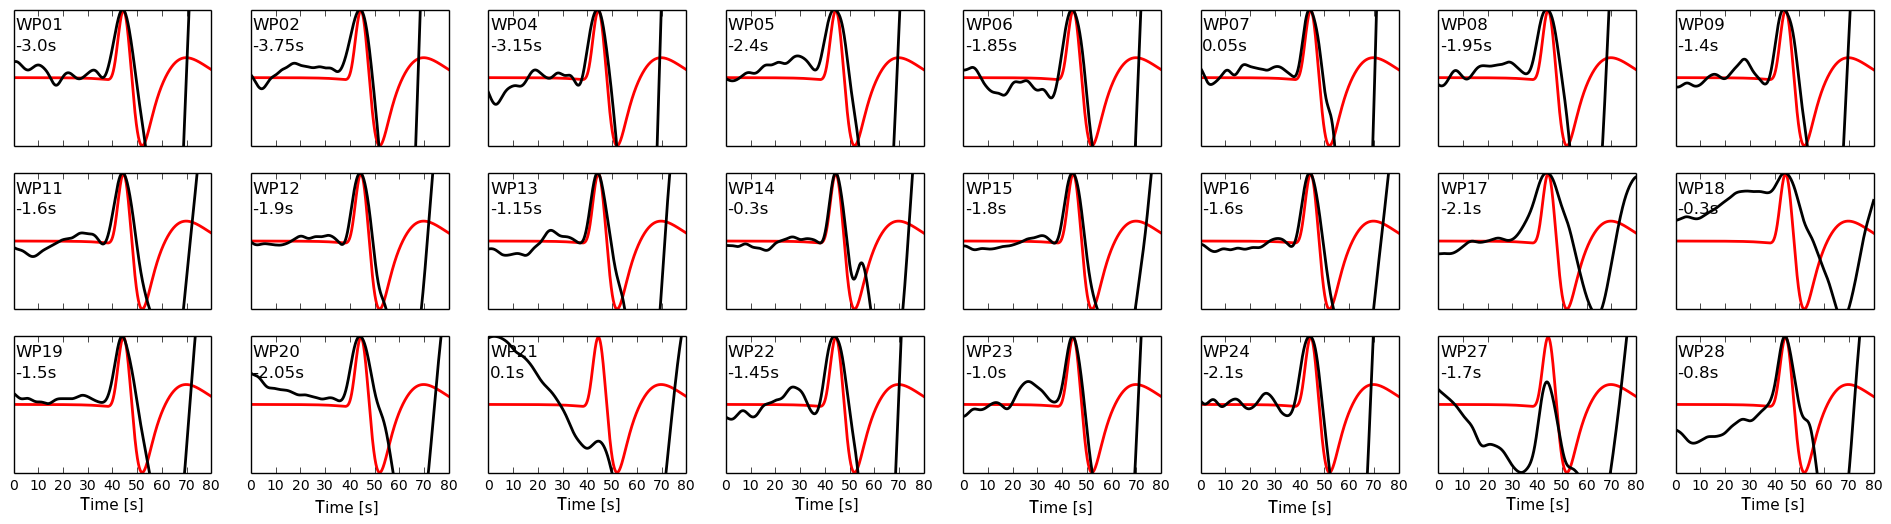
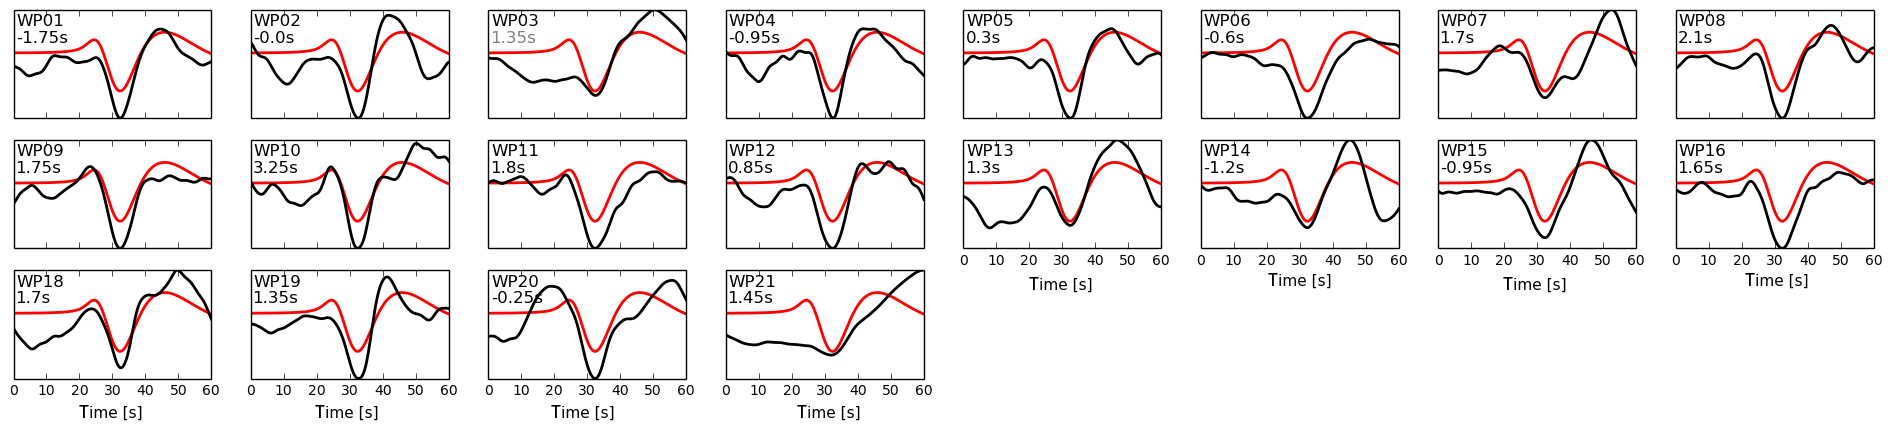
Figure S5. Event DP2012-01-15 and phase S (SV). Original waveforms (black) and synthetics (red) aligned at the correlation maximum only for the WALPASS stations. Station names and resulting travel-time delays (without corrections) are given in each panel. For correlation coefficients lower than 0.8, the travel-time delay is given in gray; these data have not been used in the study.
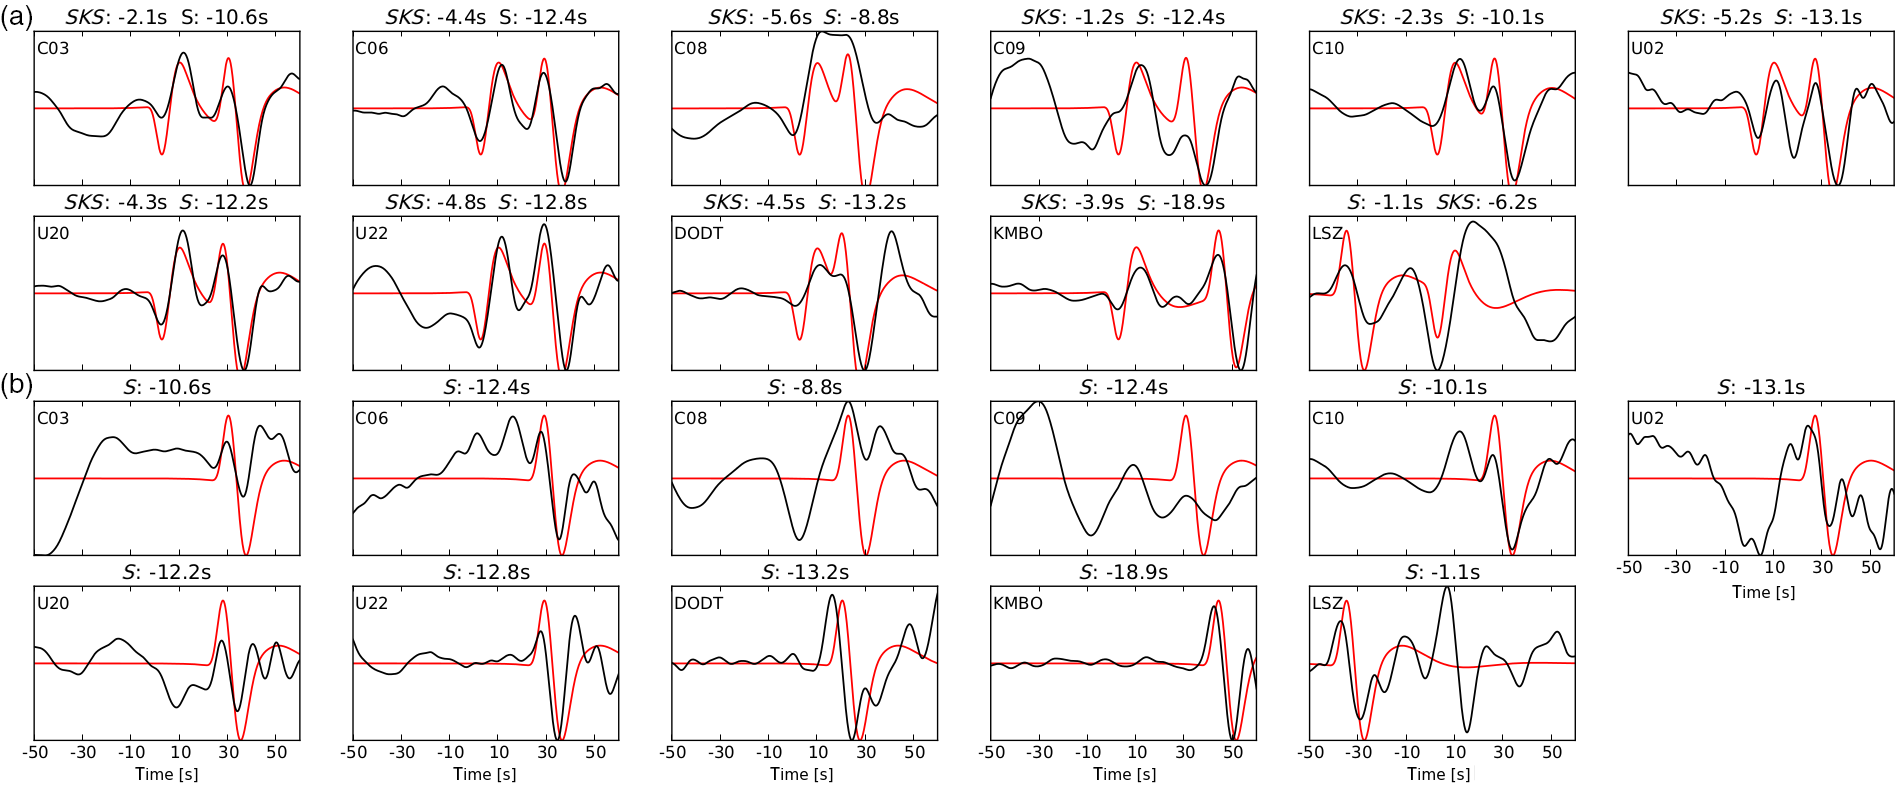
Figure S6. Event DP2012-01-15 and phase SKS (SV/SH). Original waveforms (black) and synthetics (red) aligned at the correlation maximum. Station names and resulting travel-time delays (without corrections) are given in each panel. For correlation coefficients lower than 0.8, the travel-time delay is given in gray; these data have not been used in the study. (a) Both SKS and S arrivals are given for the SV component. (b) The S-SH synthetic is plotted at the same delay time as determined on the SV component above for comparison. The SH component contains no SKS wave.
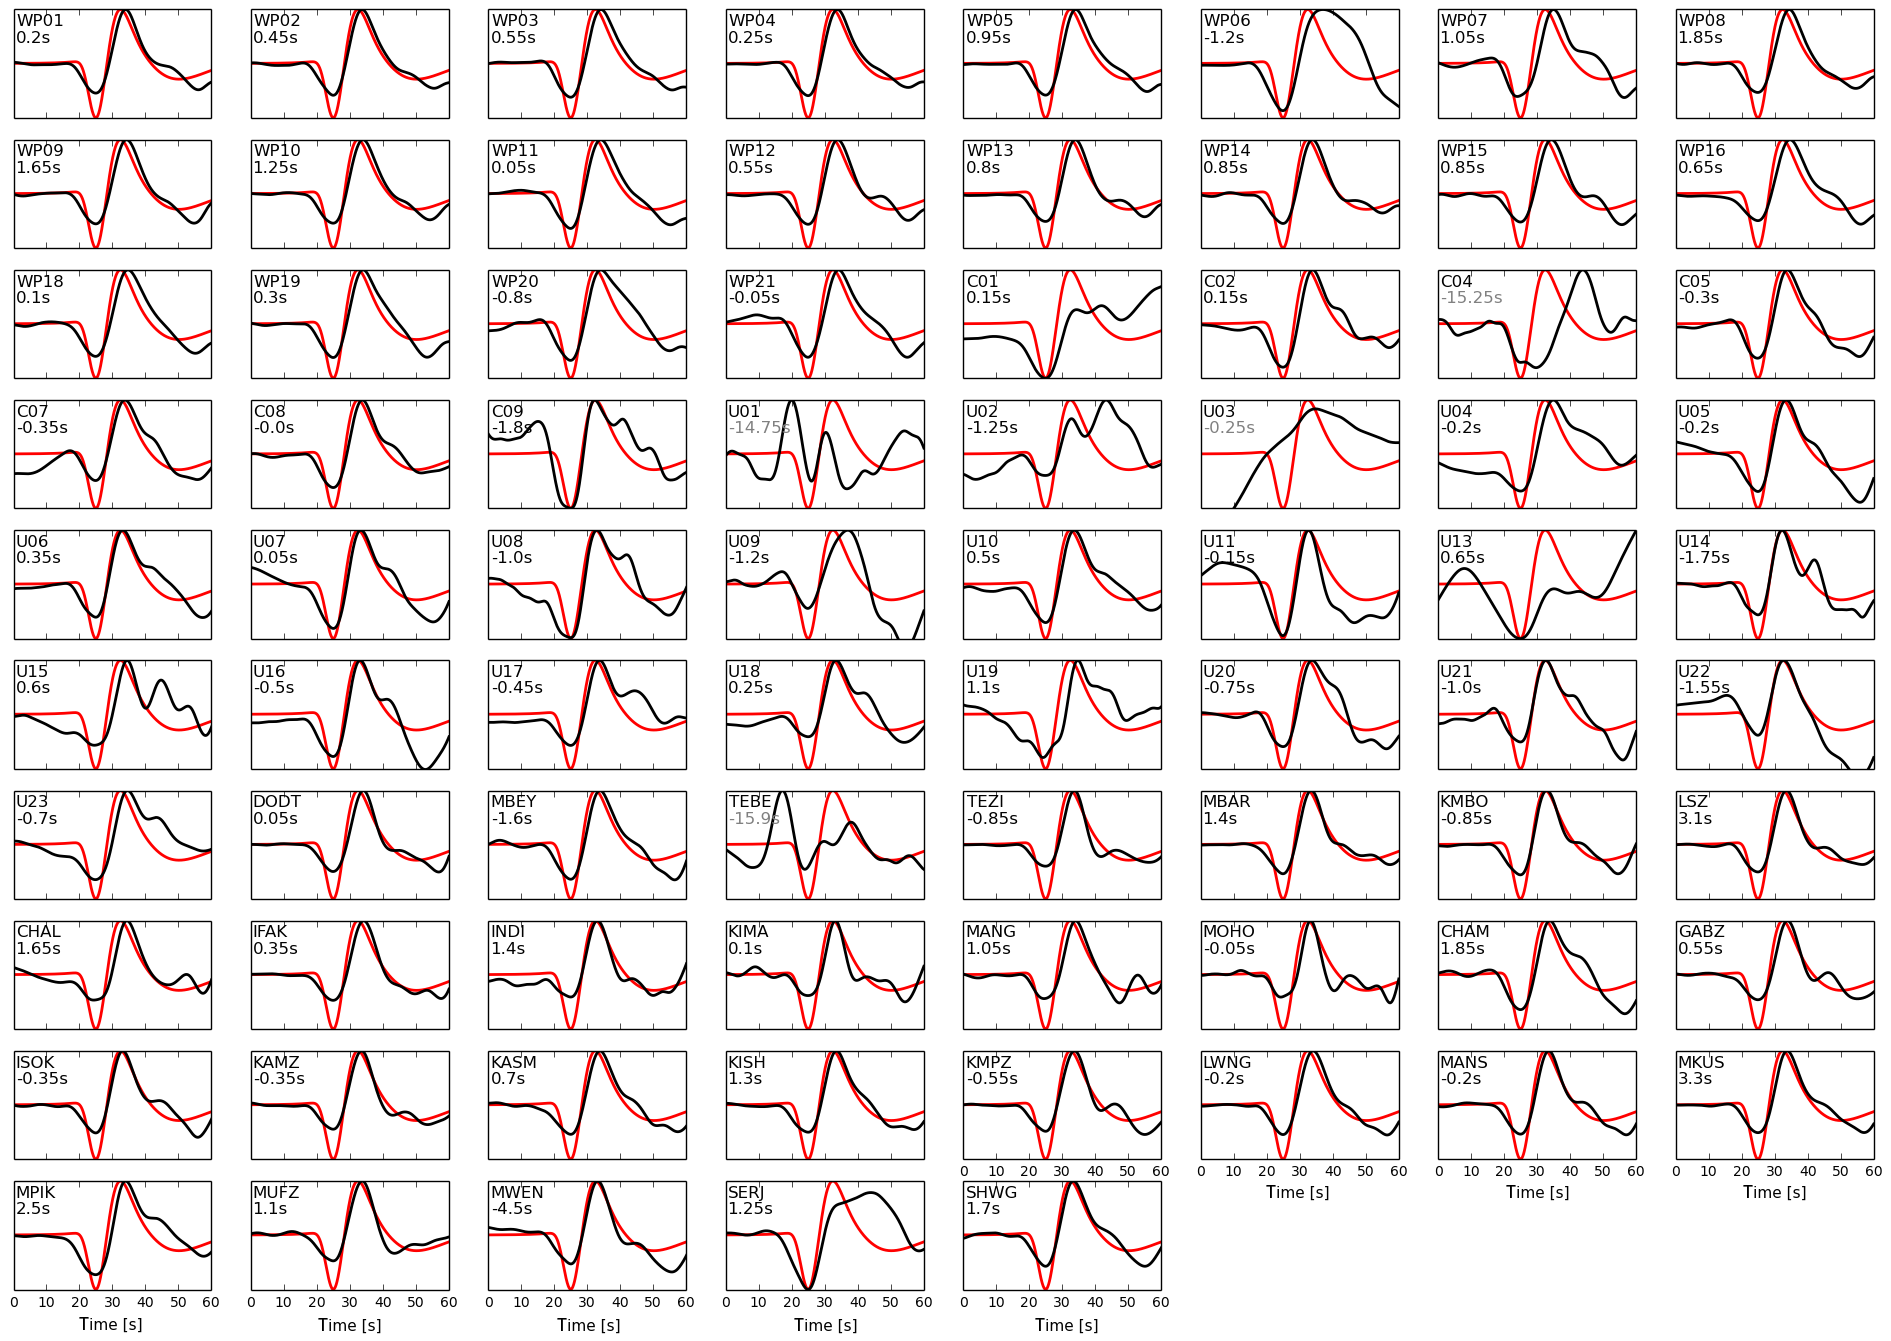
Figure S7. Event IR2010-12-20 and phase S (SH). Original waveforms (black) and synthetics (red) aligned at the correlation maximum. Station names and resulting travel-time delays (without corrections) are given in each panel. For correlation coefficients lower than 0.8, the travel-time delay is given in gray; these data have not been used in the study.
Figure S8. Event IR2010-12-20 and phase ScS (SH). Original waveforms (black) and synthetics (red) aligned at the correlation maximum. Station names and resulting travel-time delays (without corrections) are given in each panel. For correlation coefficients lower than 0.6, the travel-time delay is given in gray; these data have not been used in the study. This is the only event for which the correlation coefficient threshold has been lowered.
Figure S9. Event PAK2011-01-18 and phase S (SH). Original waveforms (black) and synthetics (red) aligned at the correlation maximum. Station names and resulting travel-time delays (without corrections) are given in each panel. For correlation coefficients lower than 0.8, the travel-time delay is given in gray; these data have not been used in the study.
Figure S10. Event PAK2011-01-18 and phase ScS (SH). Original waveforms (black) and synthetics (red) aligned at the correlation maximum. Station names and resulting travel-time delays (without corrections) are given in each panel. For correlation coefficients lower than 0.8, the travel-time delay is given in gray; these data have not been used in the study.
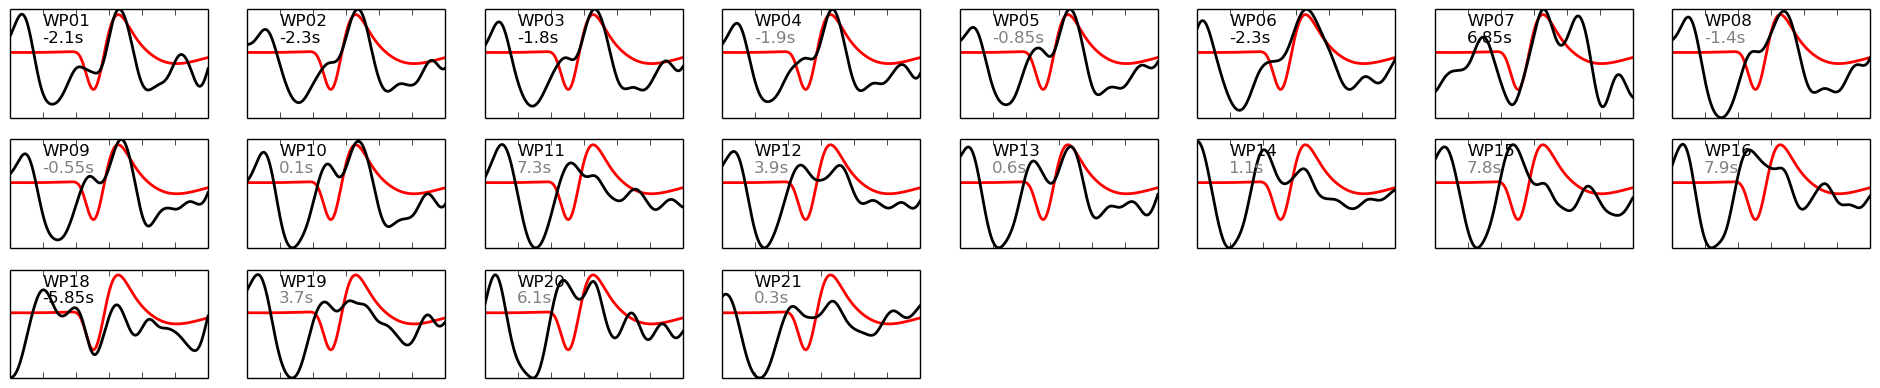
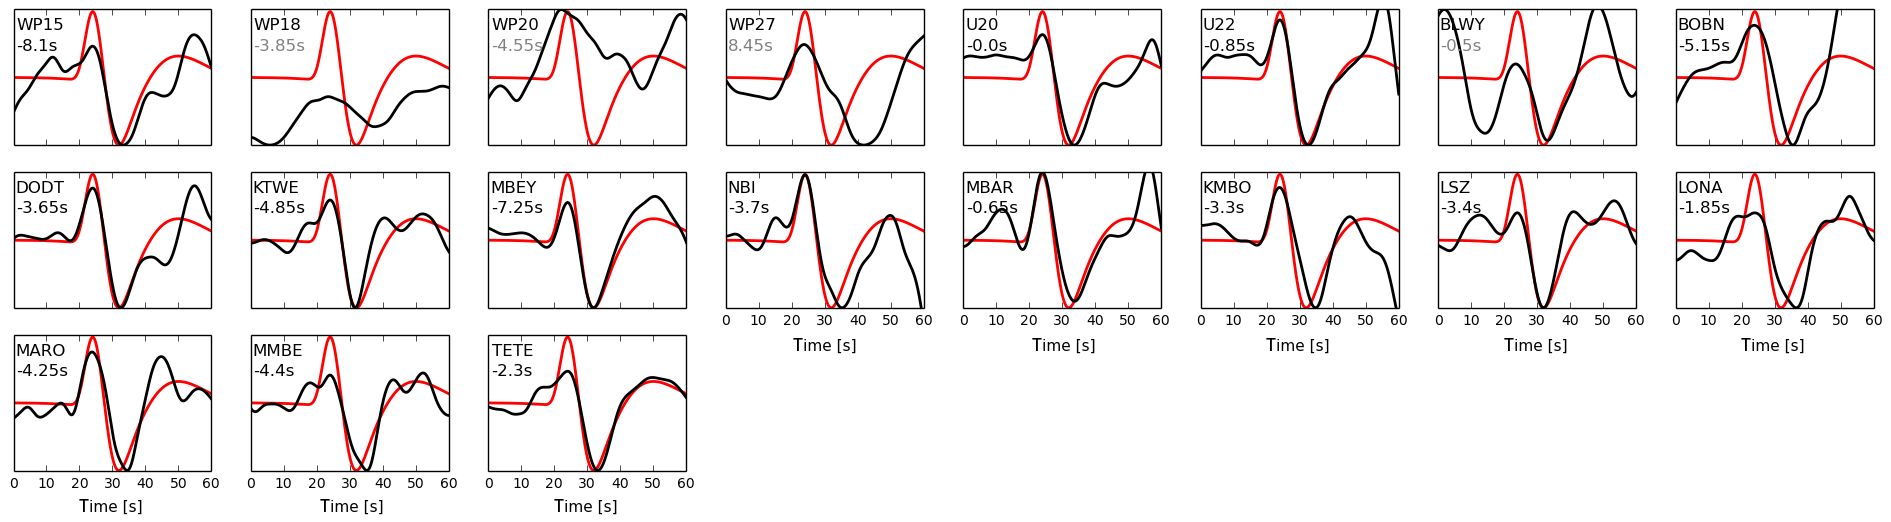
Figure S11. Event EPR2010-11-21 and phase SS (SH). Original waveforms (black) and synthetics (red) aligned at the correlation maximum. Station names and resulting travel-time delays (without corrections) are given in each panel. For correlation coefficients lower than 0.8, the travel-time delay is given in gray; these data have not been used in the study.
Figure S12. Event EPR2010-11-21 and phase SKS (SV). Original waveforms (black) and synthetics (red) aligned at the correlation maximum. Station names and resulting travel-time delays (without corrections) are given in each panel. For correlation coefficients lower than 0.8, the travel-time delay is given in gray; these data have not been used in the study.
Figure S13. Event SIB2012-02-26 and phase S (SV). Original waveforms (black) and synthetics (red) aligned at the correlation maximum. Station names and resulting travel-time delays (without corrections) are given in each panel. For correlation coefficients lower than 0.8, the travel-time delay is given in gray; these data have not been used in the study.
Figure S14. Event SIB2012-02-26 and phase SKS (SV). Original waveforms (black) and synthetics (red) aligned at the correlation maximum. Station names and resulting travel-time delays (without corrections) are given in each panel. For correlation coefficients lower than 0.8, the travel-time delay is given in gray; these data have not been used in the study.
[ Back ]