This electronic supplement contains three tables and seven figures. Tables S1 and S3 list the templates and detected events, respectively. Table S2 shows the velocity model for relocation. Figures S1 and S2 show the characteristic of the templates. Figures S3 and S4 show the result of one station detection on BAJ. Figures S5–S7 show the focal mechanism, aftershock relocation, and Coulomb stress of the ML 3.7 earthquake.
Table S1 [Plain text comma-separated values; 184 KB]. The templates catalog used in detection.
Table S2 [Plain text comma-separated values; 319 Bytes]. Velocity structure model used for relocation.
Table S3 [Plain text comma-separated values; 110 KB]. The detected catalog between 1 January 2008 and 12 May 2008.
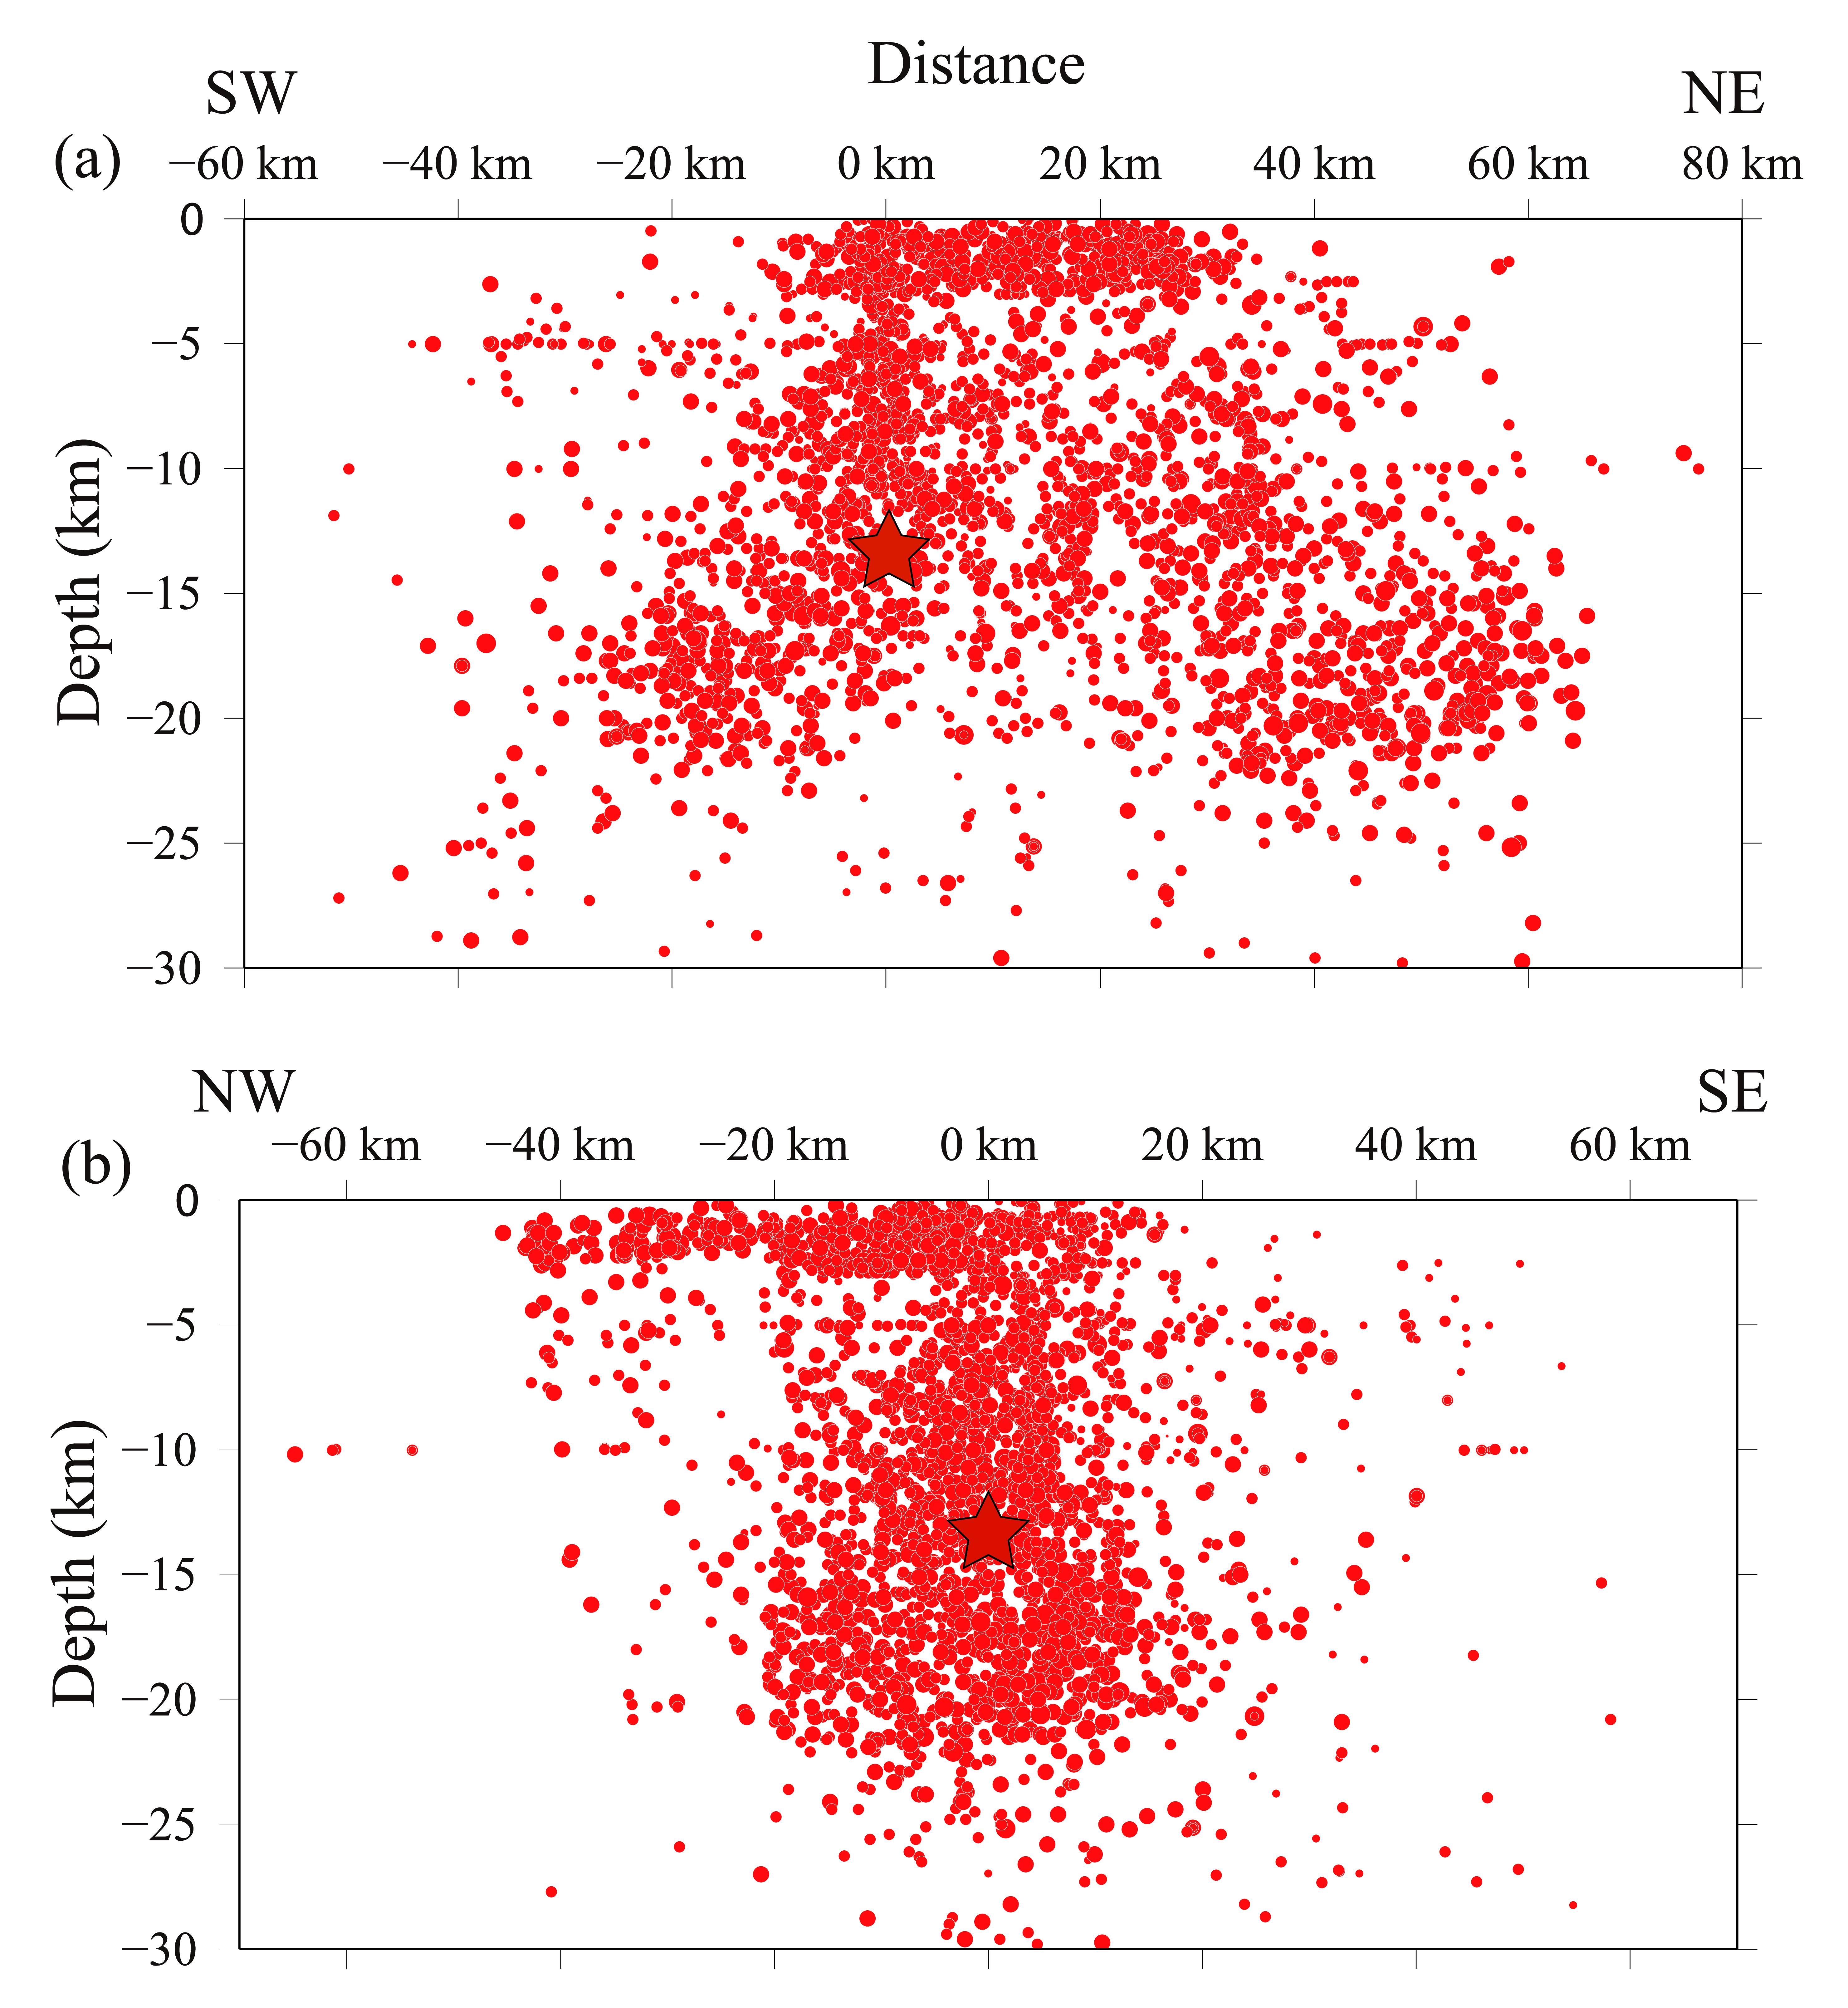
Figure S1. Cross-section view of all templates (a) along the Longmen Shan faults and (b) along the profile perpendicular to the Longmen Shan faults. The red star denotes the location of the Wenchuan mainshock.
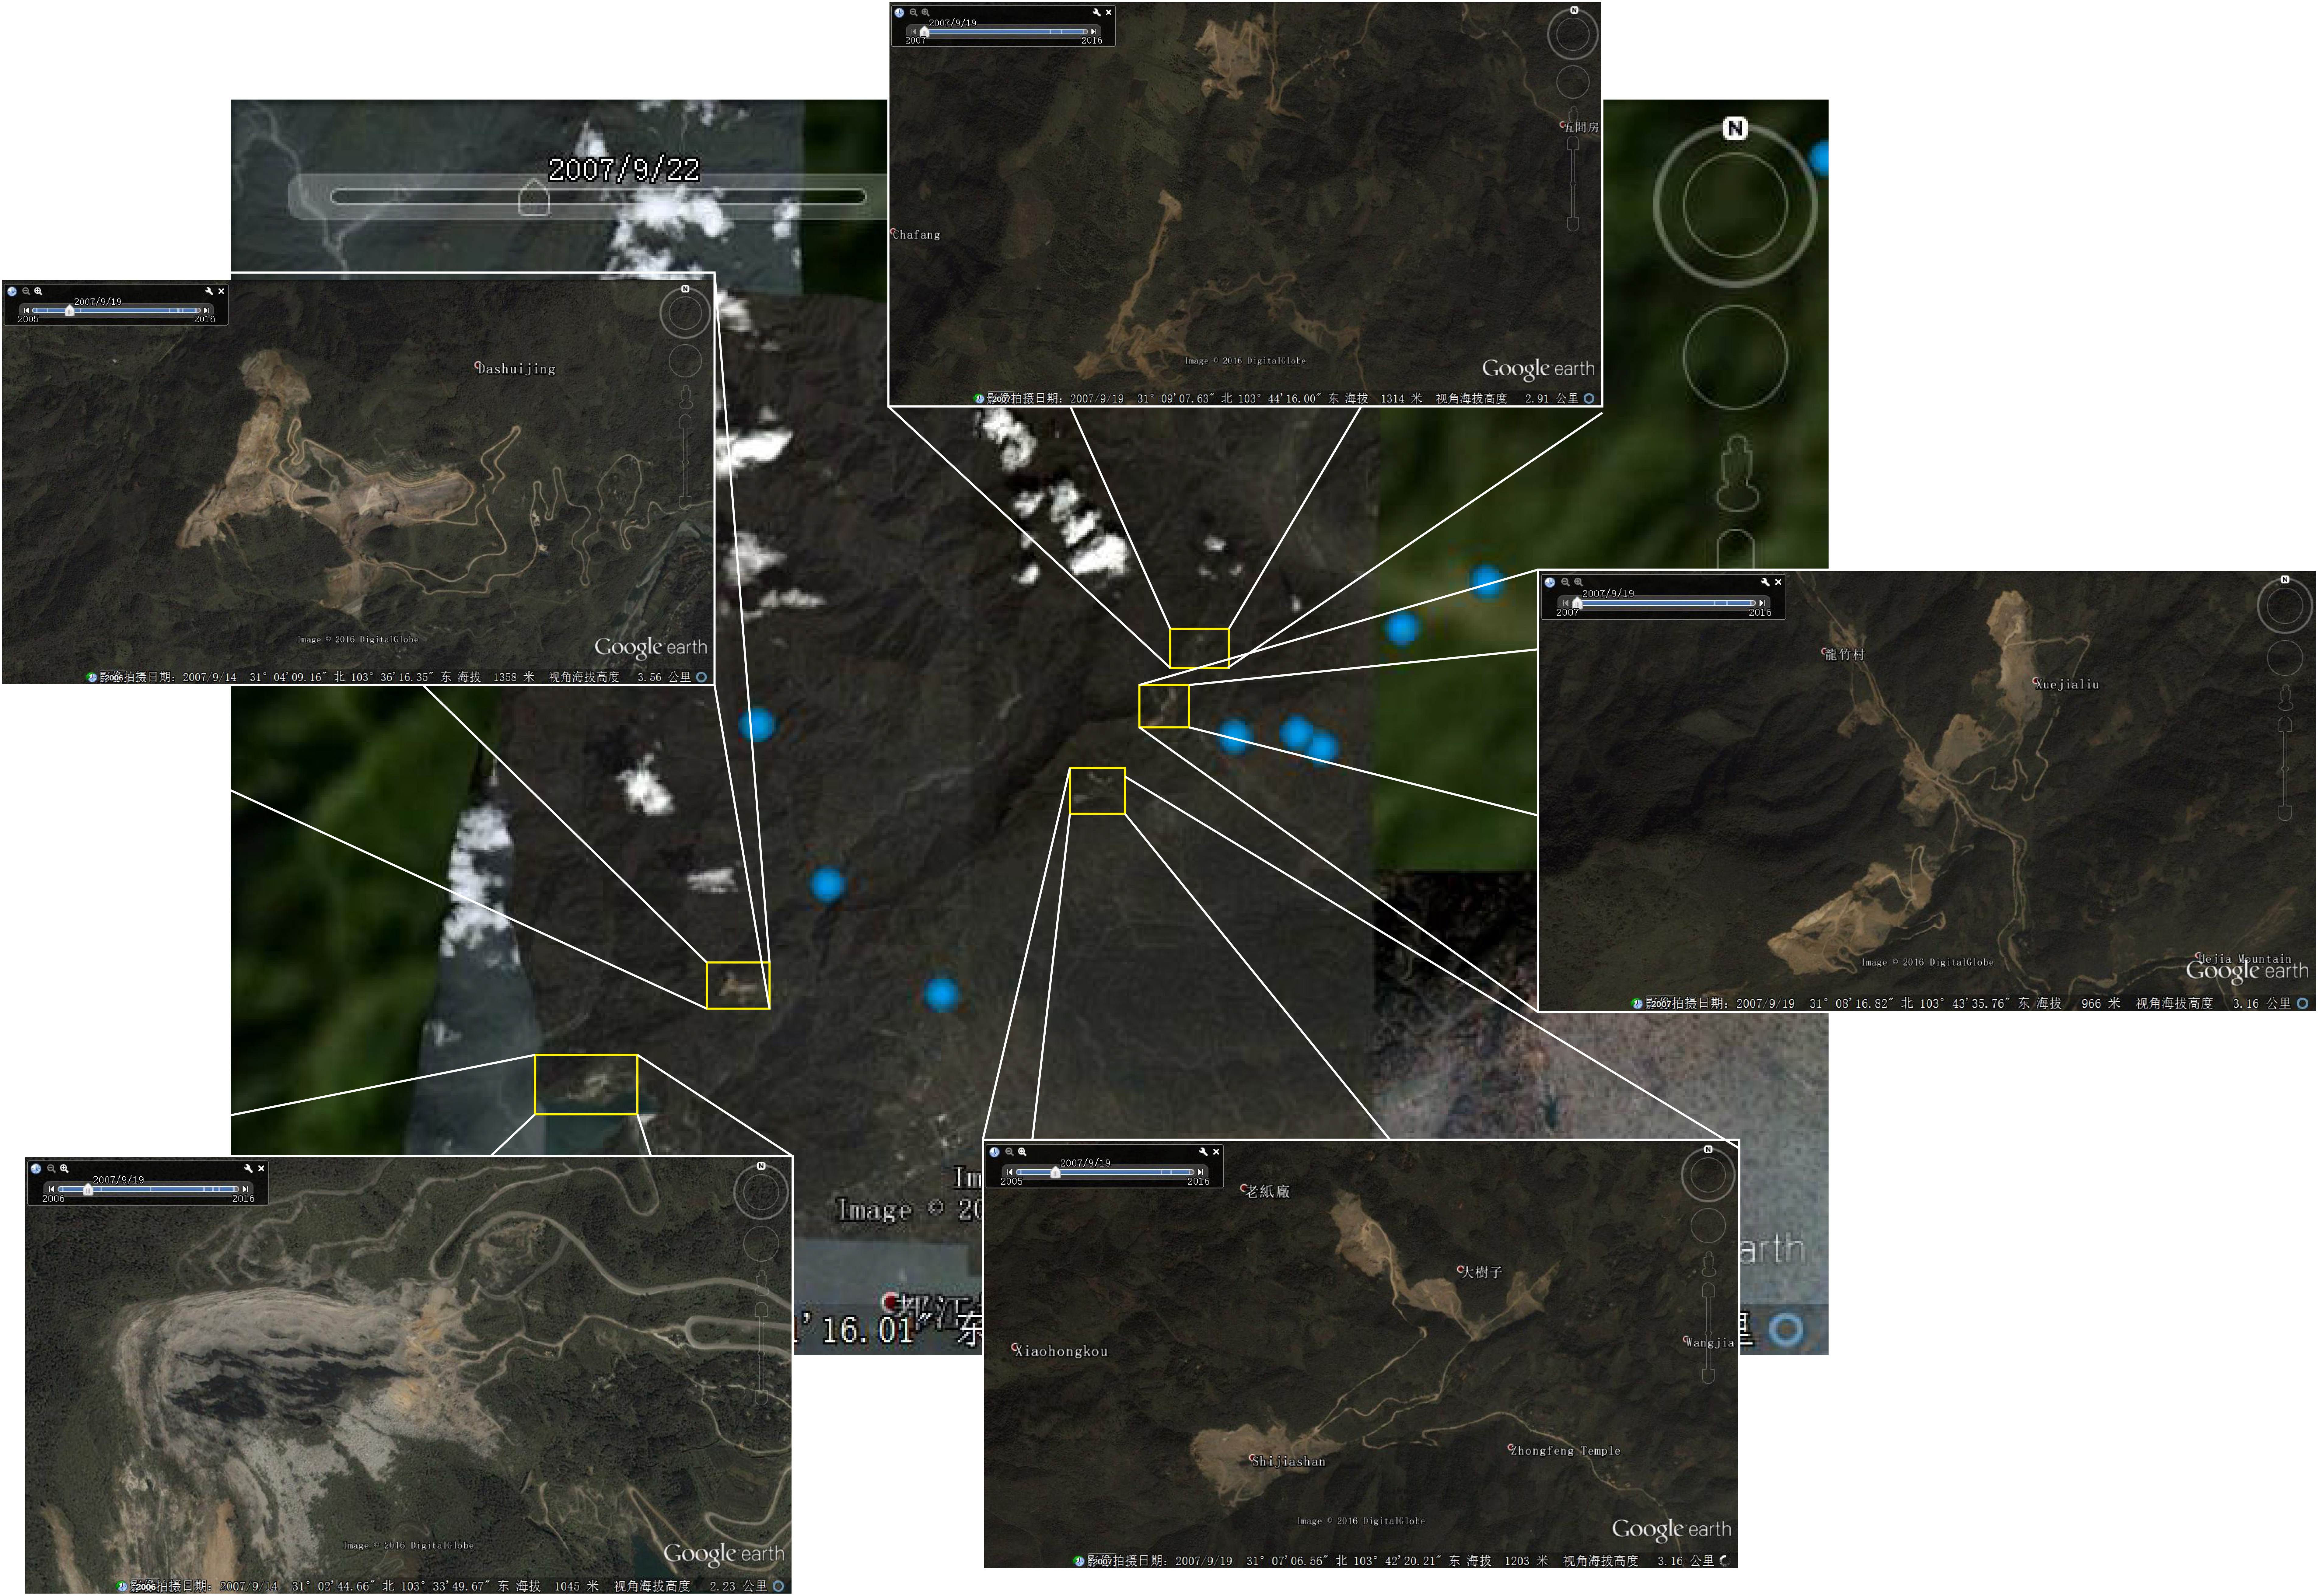
Figure S2. Satellite map of stone pits and distribution of the epicenters of suspected blasting. Solid blue circles are the epicenters of suspected blasting; yellow rectangles mark the location of stone pits. The satellite map was updated on 22 September 2007 by Google Earth.
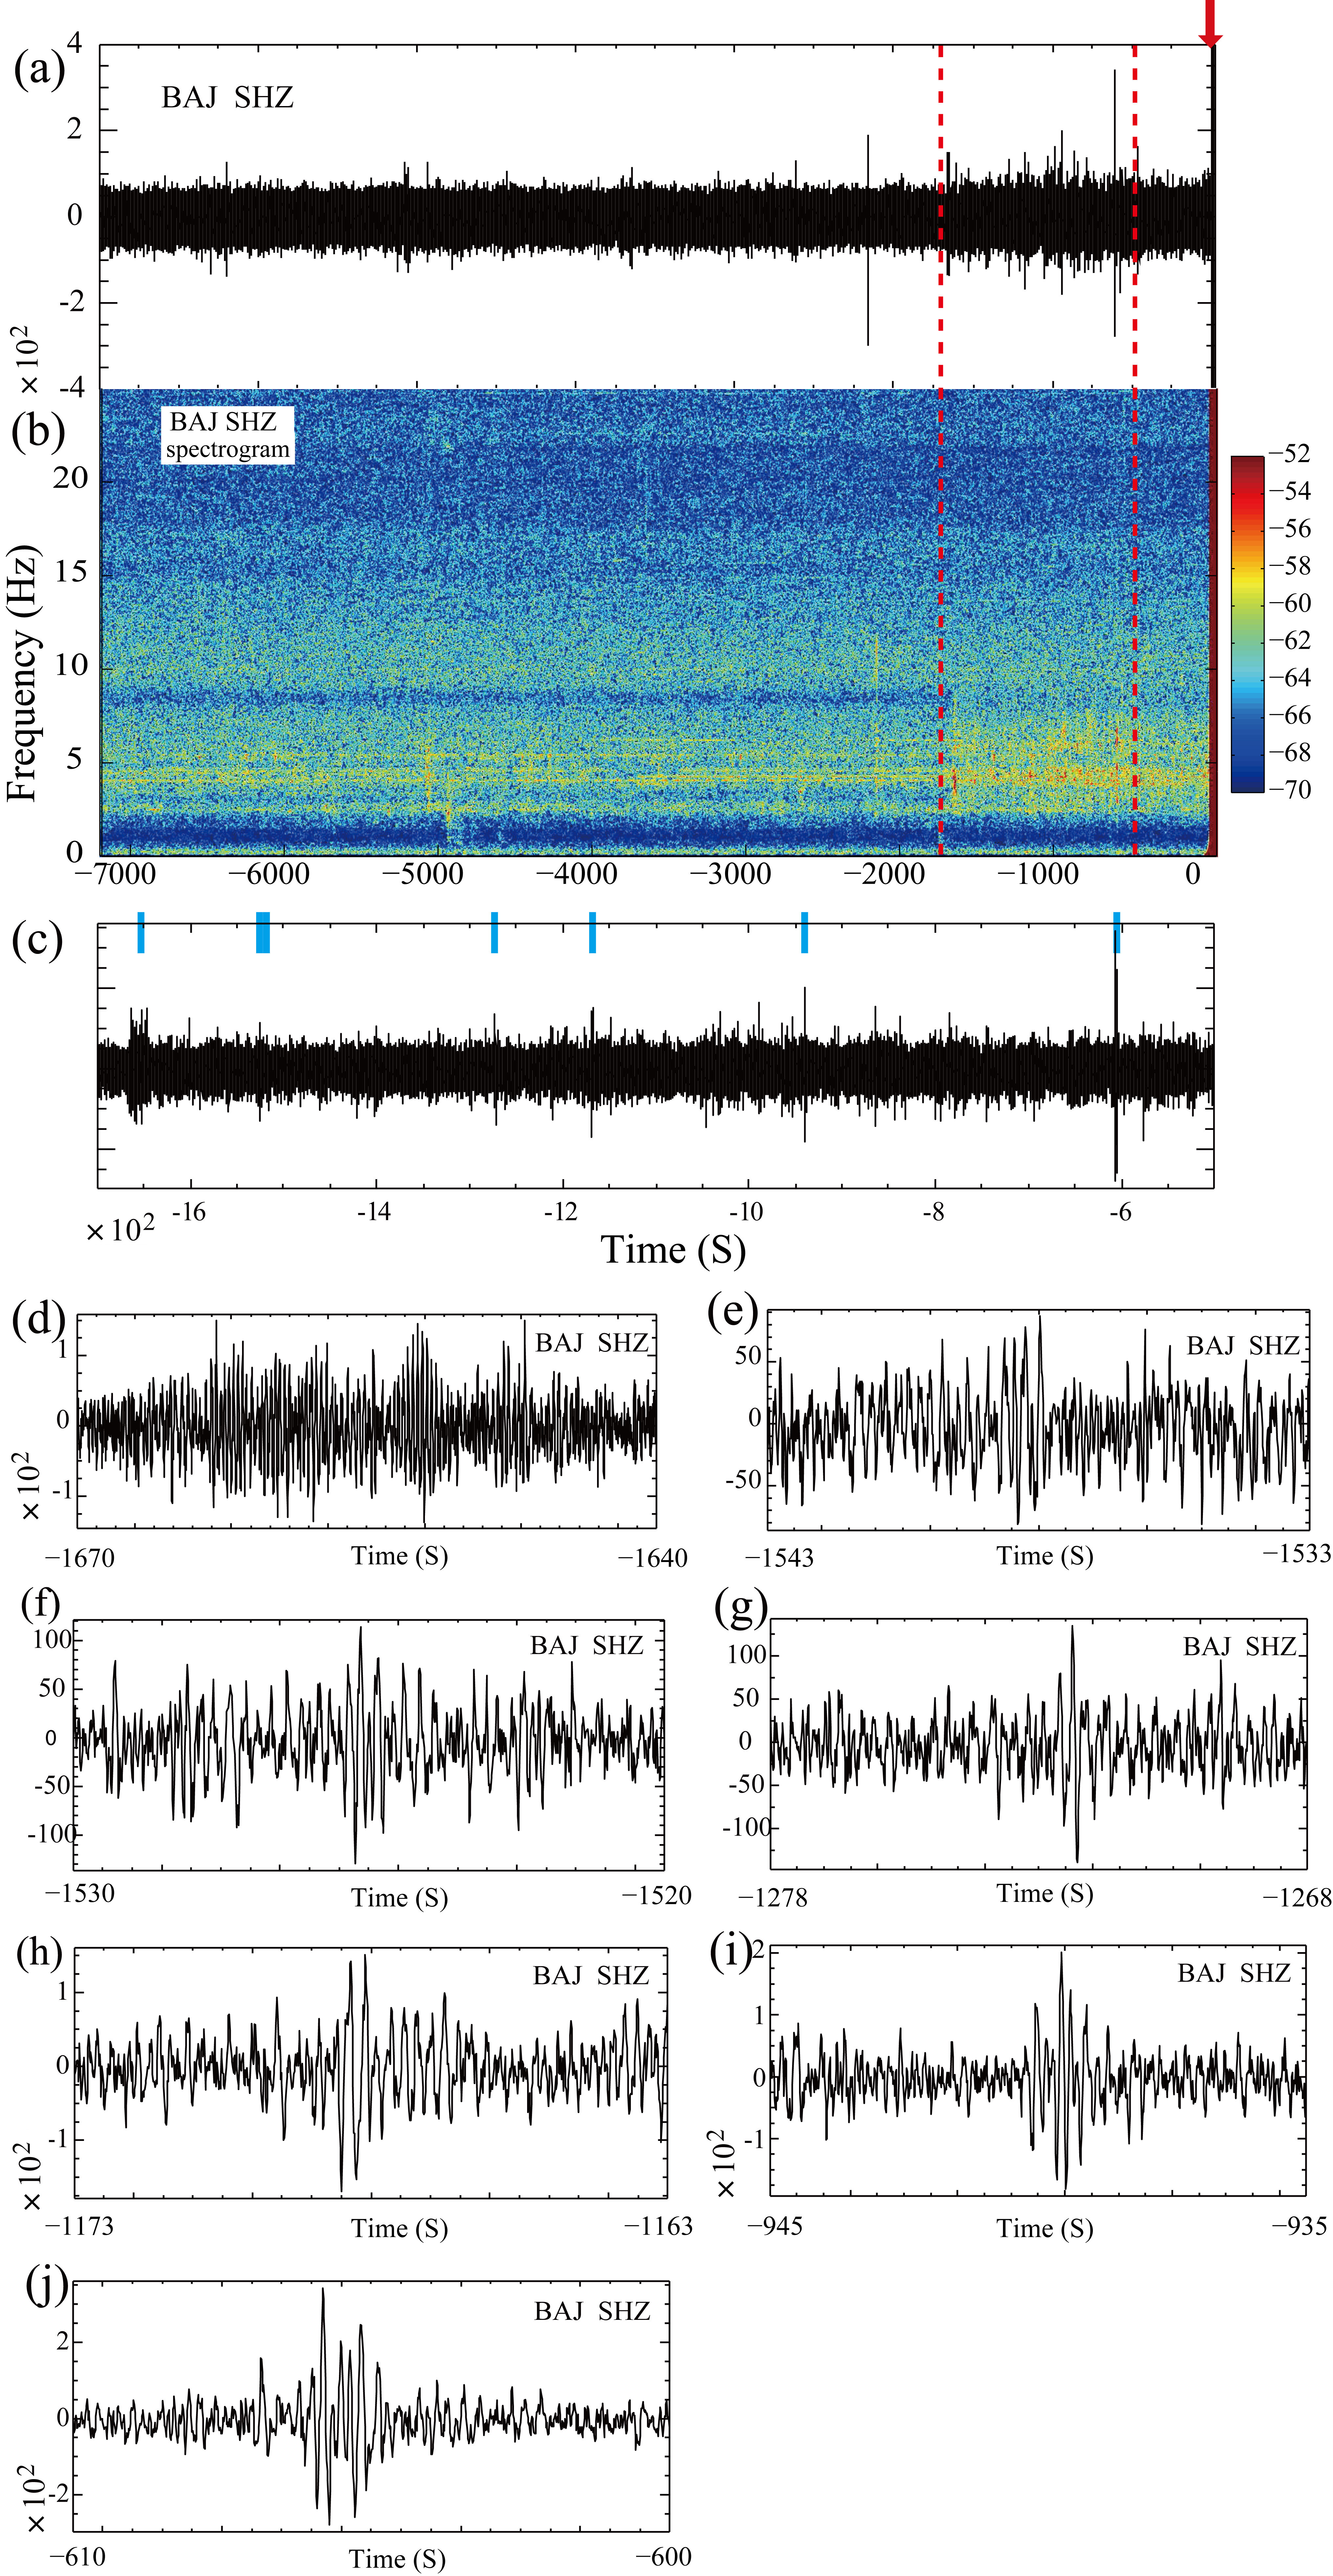
Figure S3. Seven templates cut from a vertical channel at station BAJ. (a) ~7000 s waveform recorded with 100-Hz sample rate. The red arrow marks the occurrence of the Wenchuan mainshock. (b) The corresponding spectrogram at station BAJ. Two red dashed lines denote the time when some weak signals between 3 and 6 Hz occurred. (c) A zoom-in of waveform in (a). The start time and end time are marked with red dashed lines in (a) and (b). Short blue bars on the top mark the seven templates with relative larger amplitudes. (d)–(j) Seven templates with relatively large amplitudes cut from a vertical channel at station BAJ.
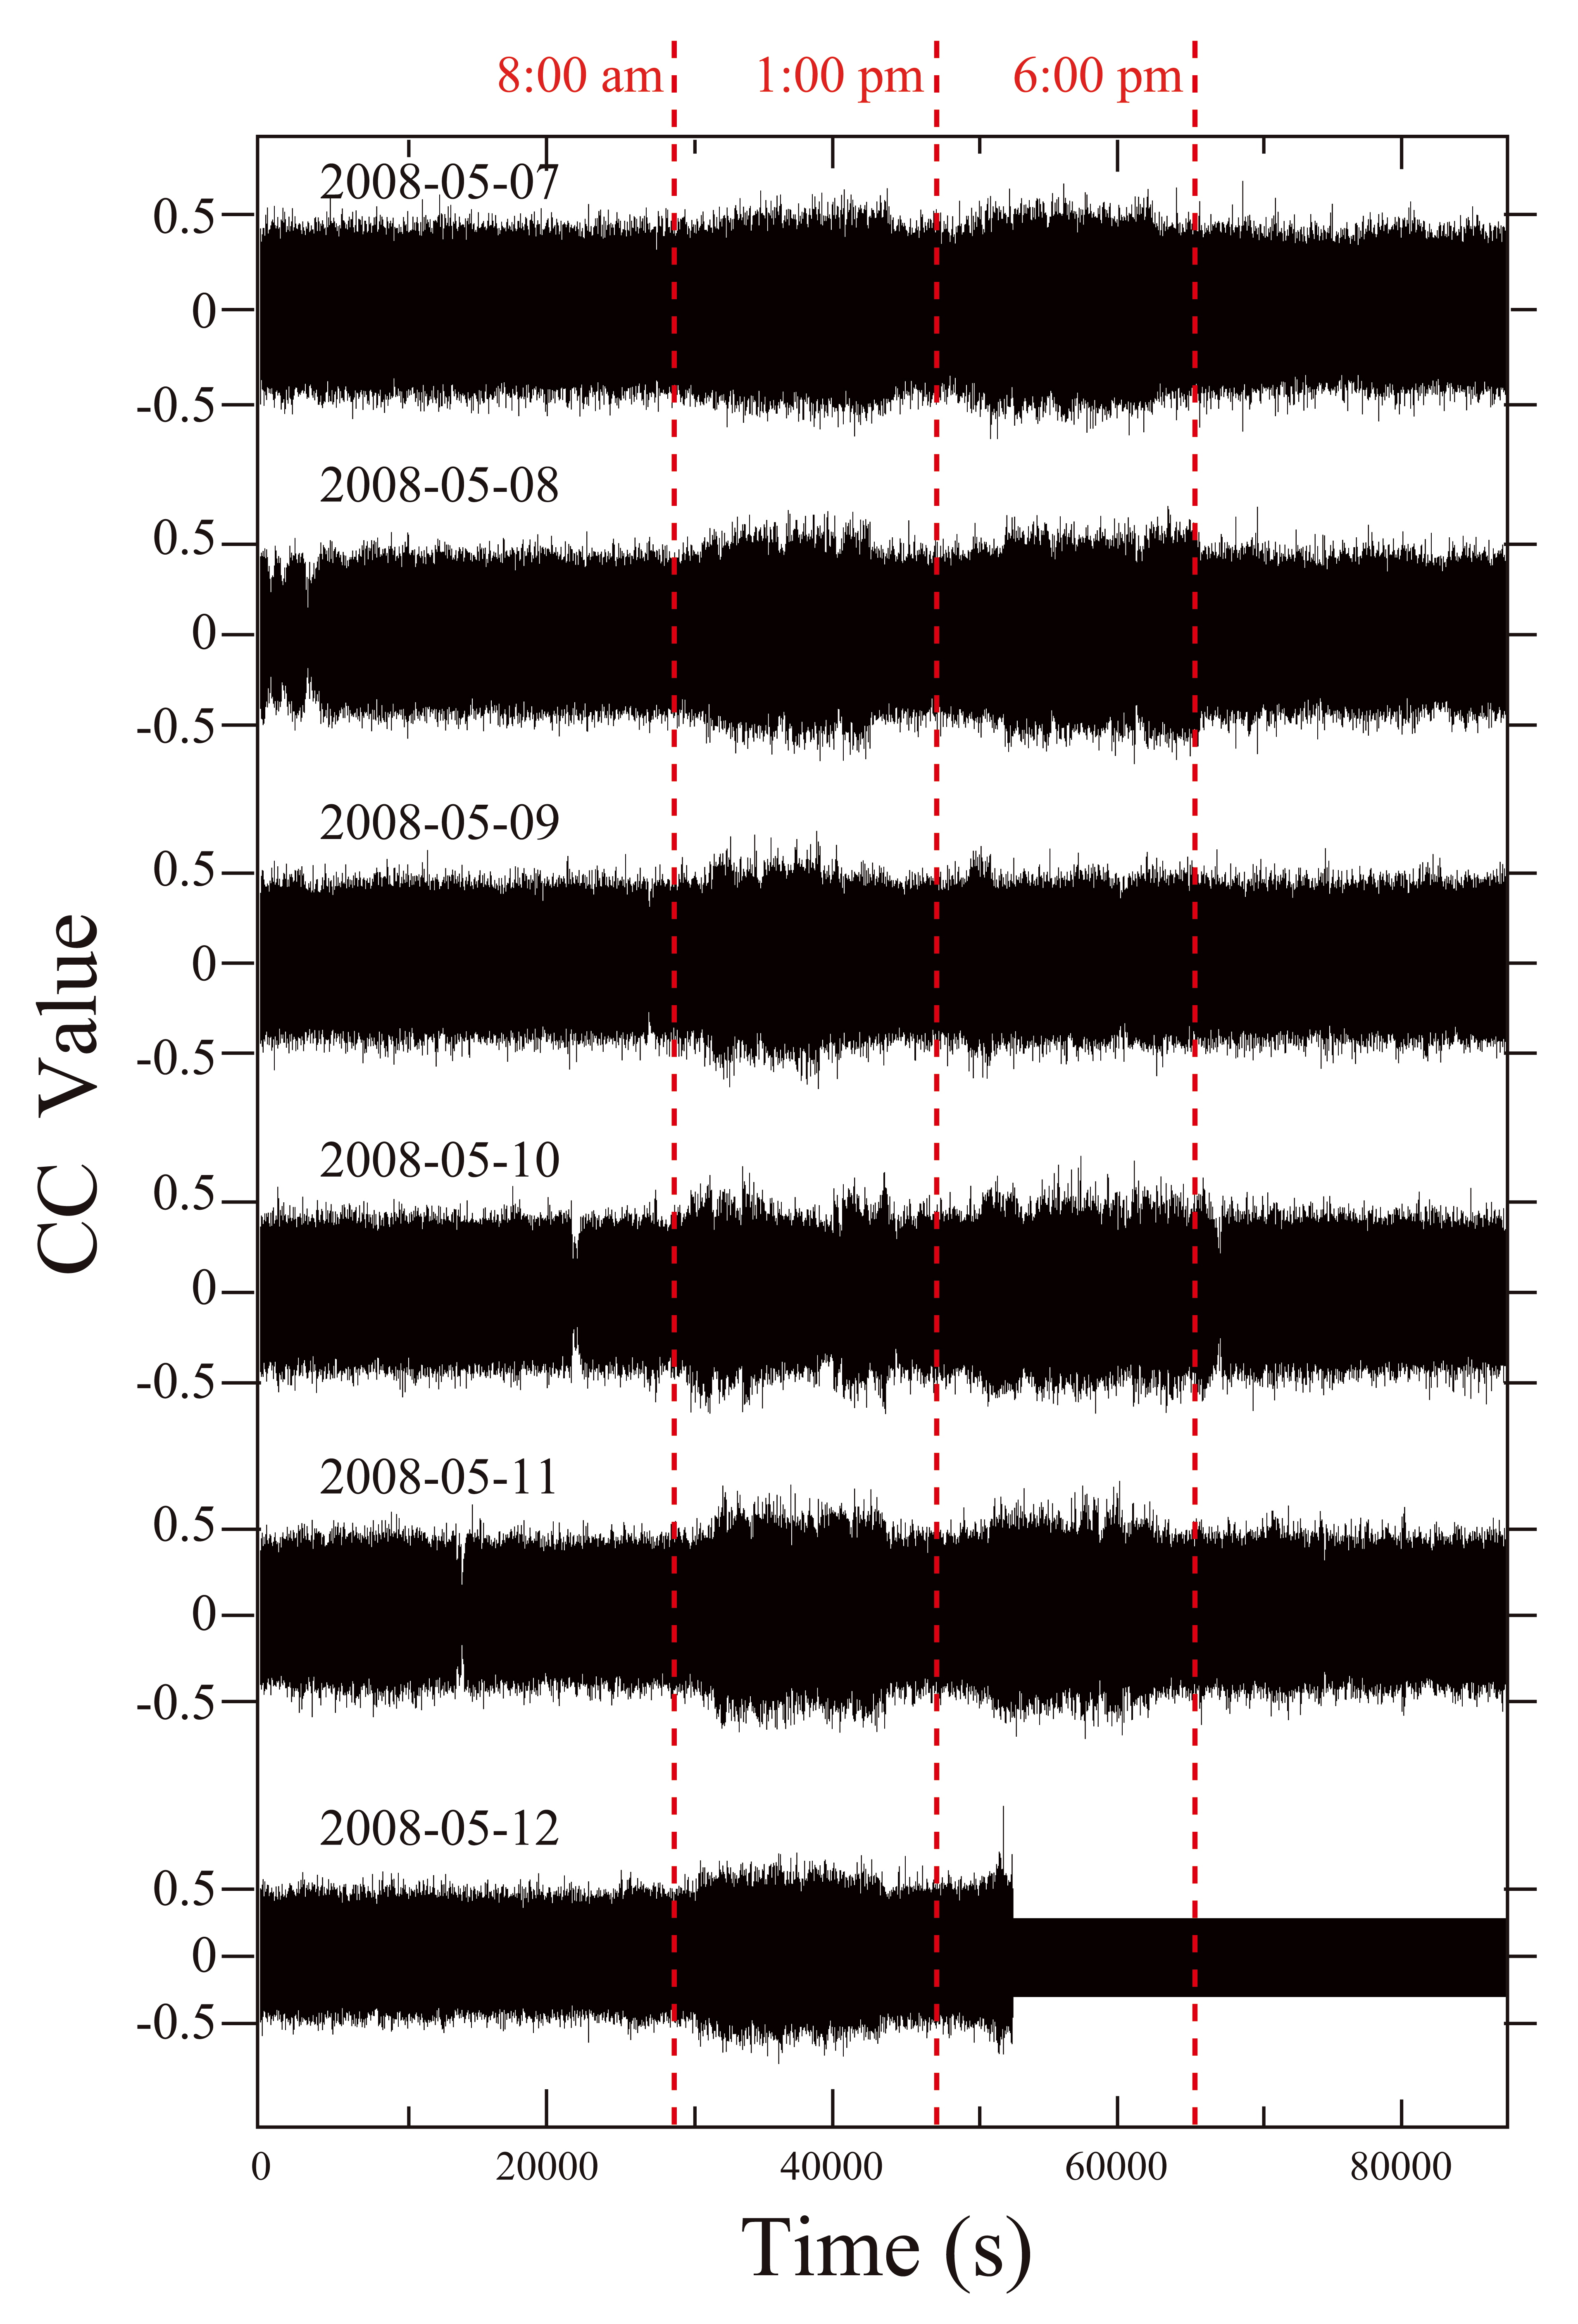
Figure S4. Six days cross-correlation traces versus daily times for the template shown in (j) of Figure S3. Red dashed lines denote local times of 8 a.m., 1 p.m., and 6 p.m.
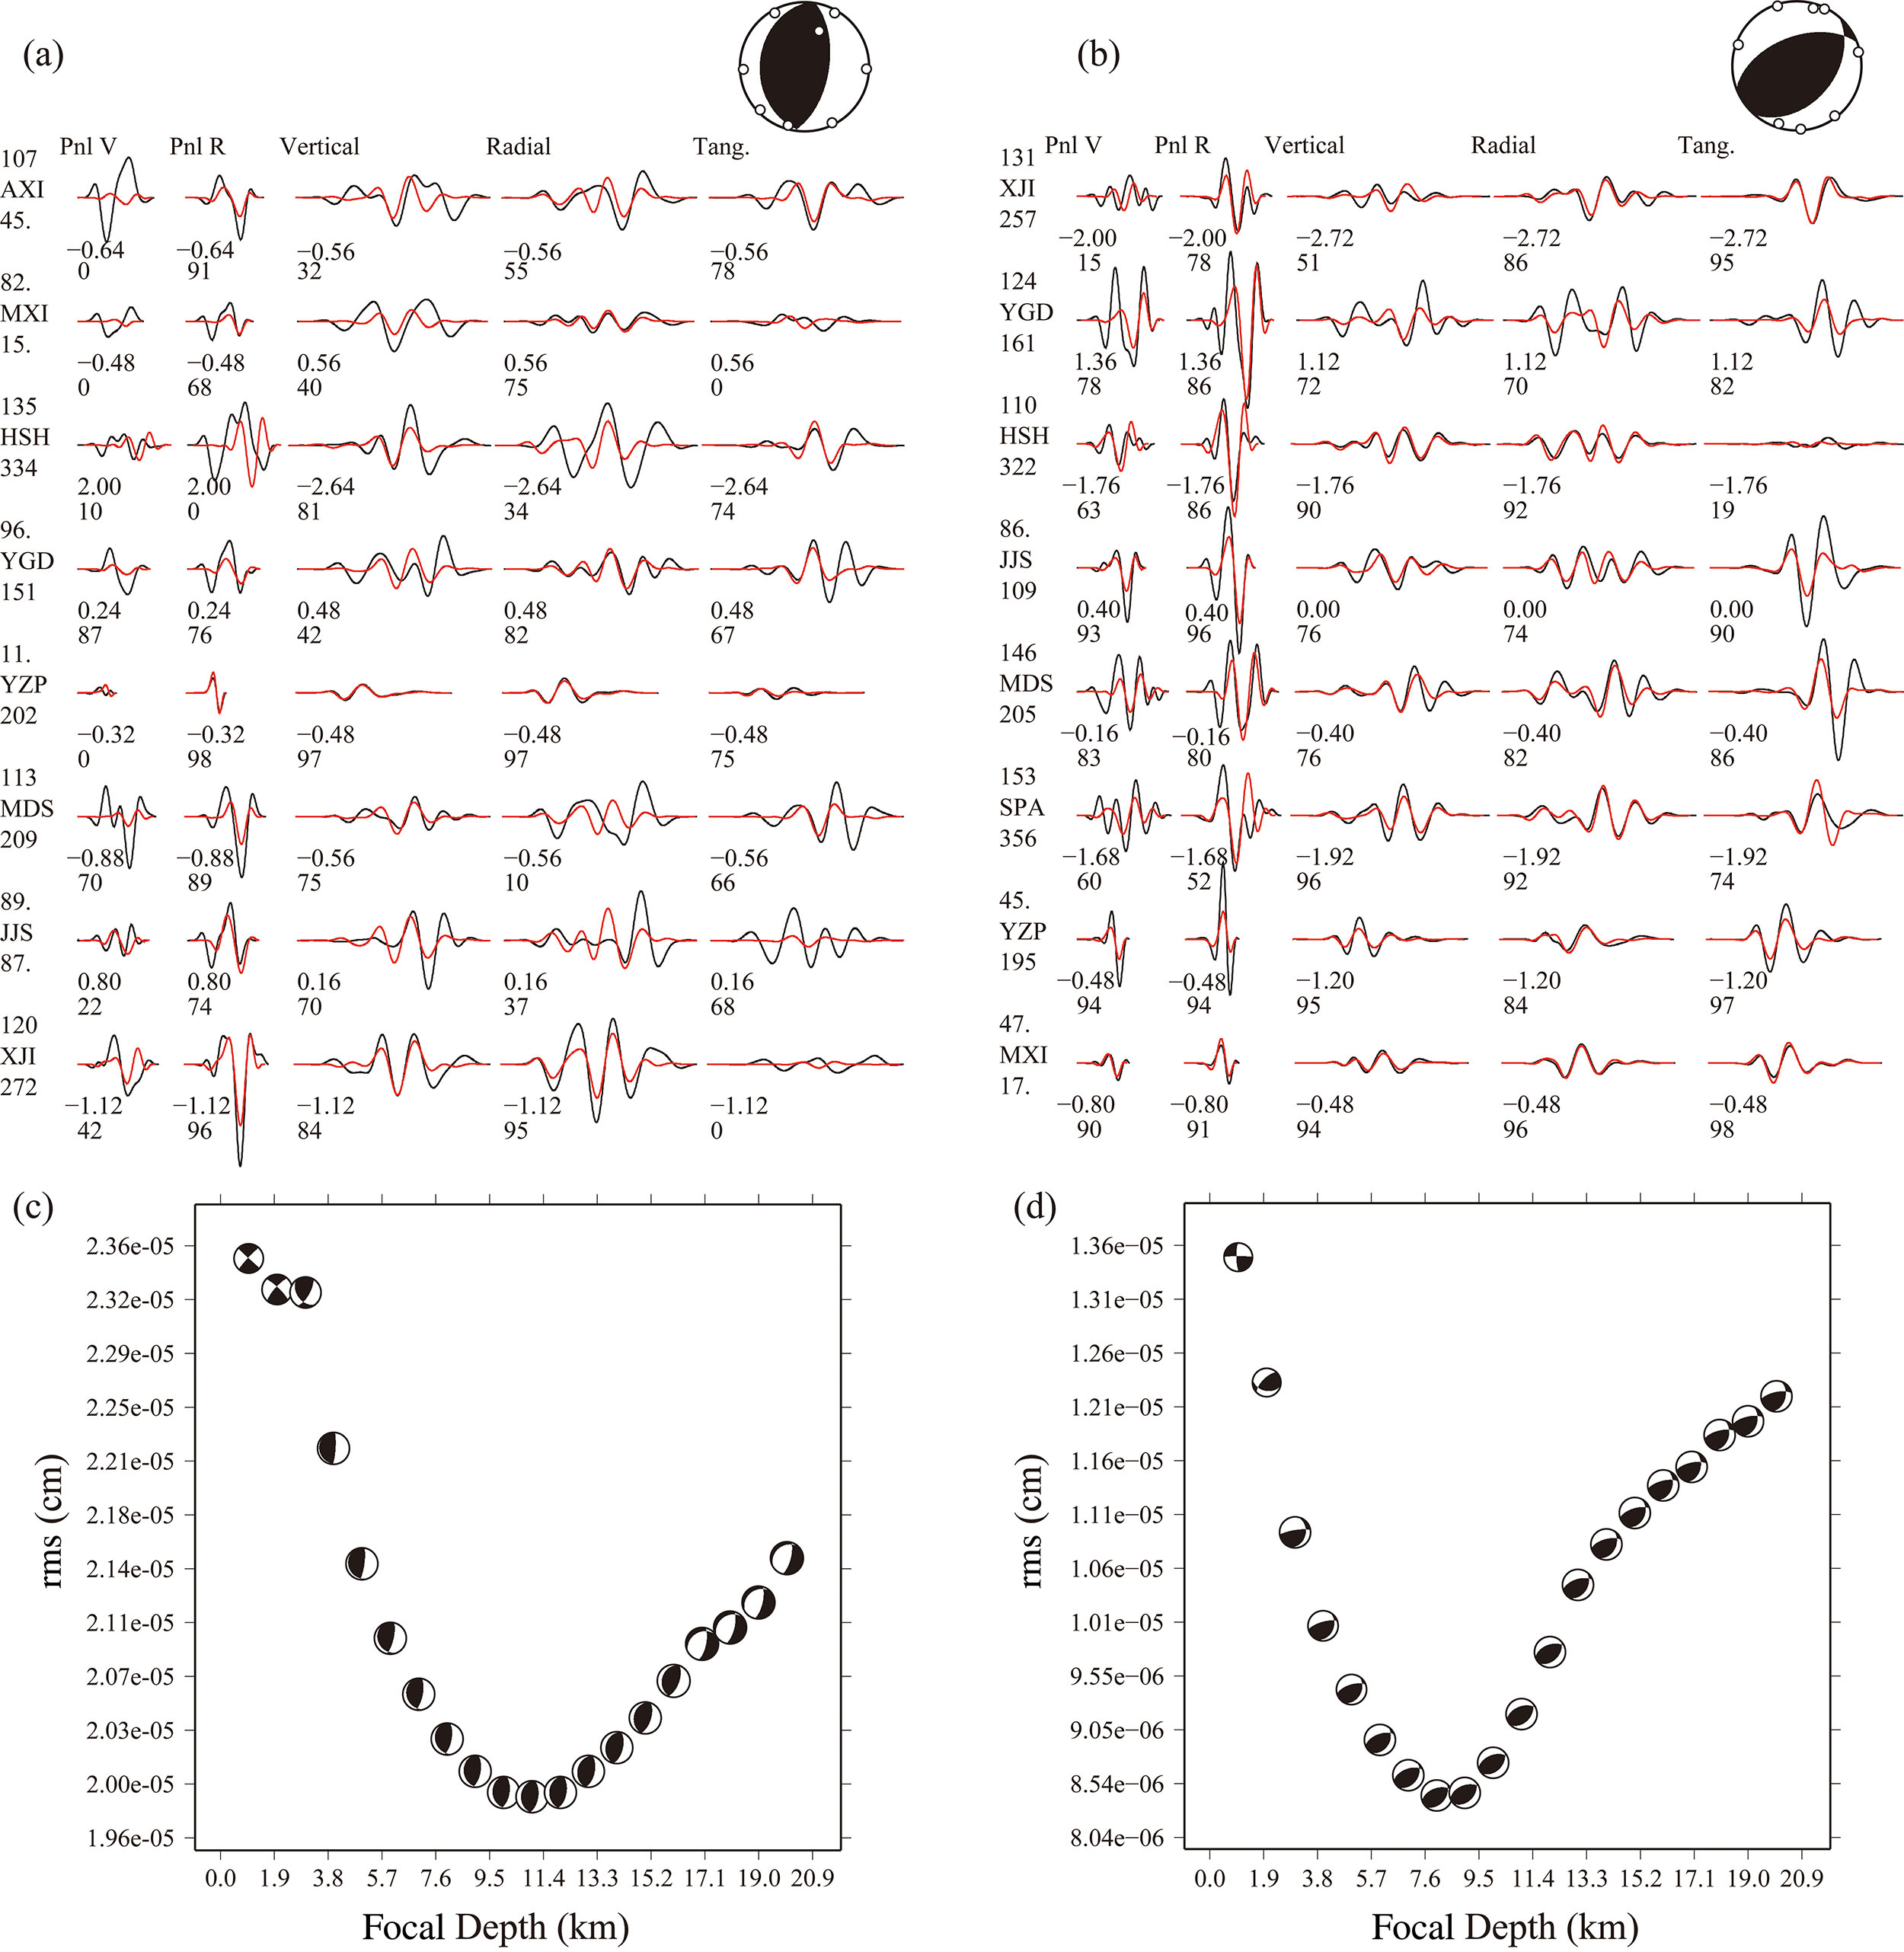
Figure S5. Focal mechanisms of the ML 3.7 event on 14 February 2008 and the ML 3.8 event on 28 February 2008. (a) and (c) are fitting result of waveforms and best-fitting depth of the ML 3.7 earthquake, respectively. (b) and (d) are fitting result of waveforms and best-fitting depth of ML 3.8 earthquake, respectively. In (a) and (c), the black line and the red line are synthetic and observed seismograms, respectively. Phase names and component orientations are above the top traces (AXI in (a) and XJI in (b)): the first two traces for Pnl waves and the last three traces for surface waves; V and R for vertical and radial, respectively. The first column gives the epicentral distance (km), station name, and azimuth. The first line under each set if curves are the time shifts for each phase (positive time shifts mean that the synthetics have been delayed or shifted to right). The cross-correlation coefficients, in percentages, are on the second lines.
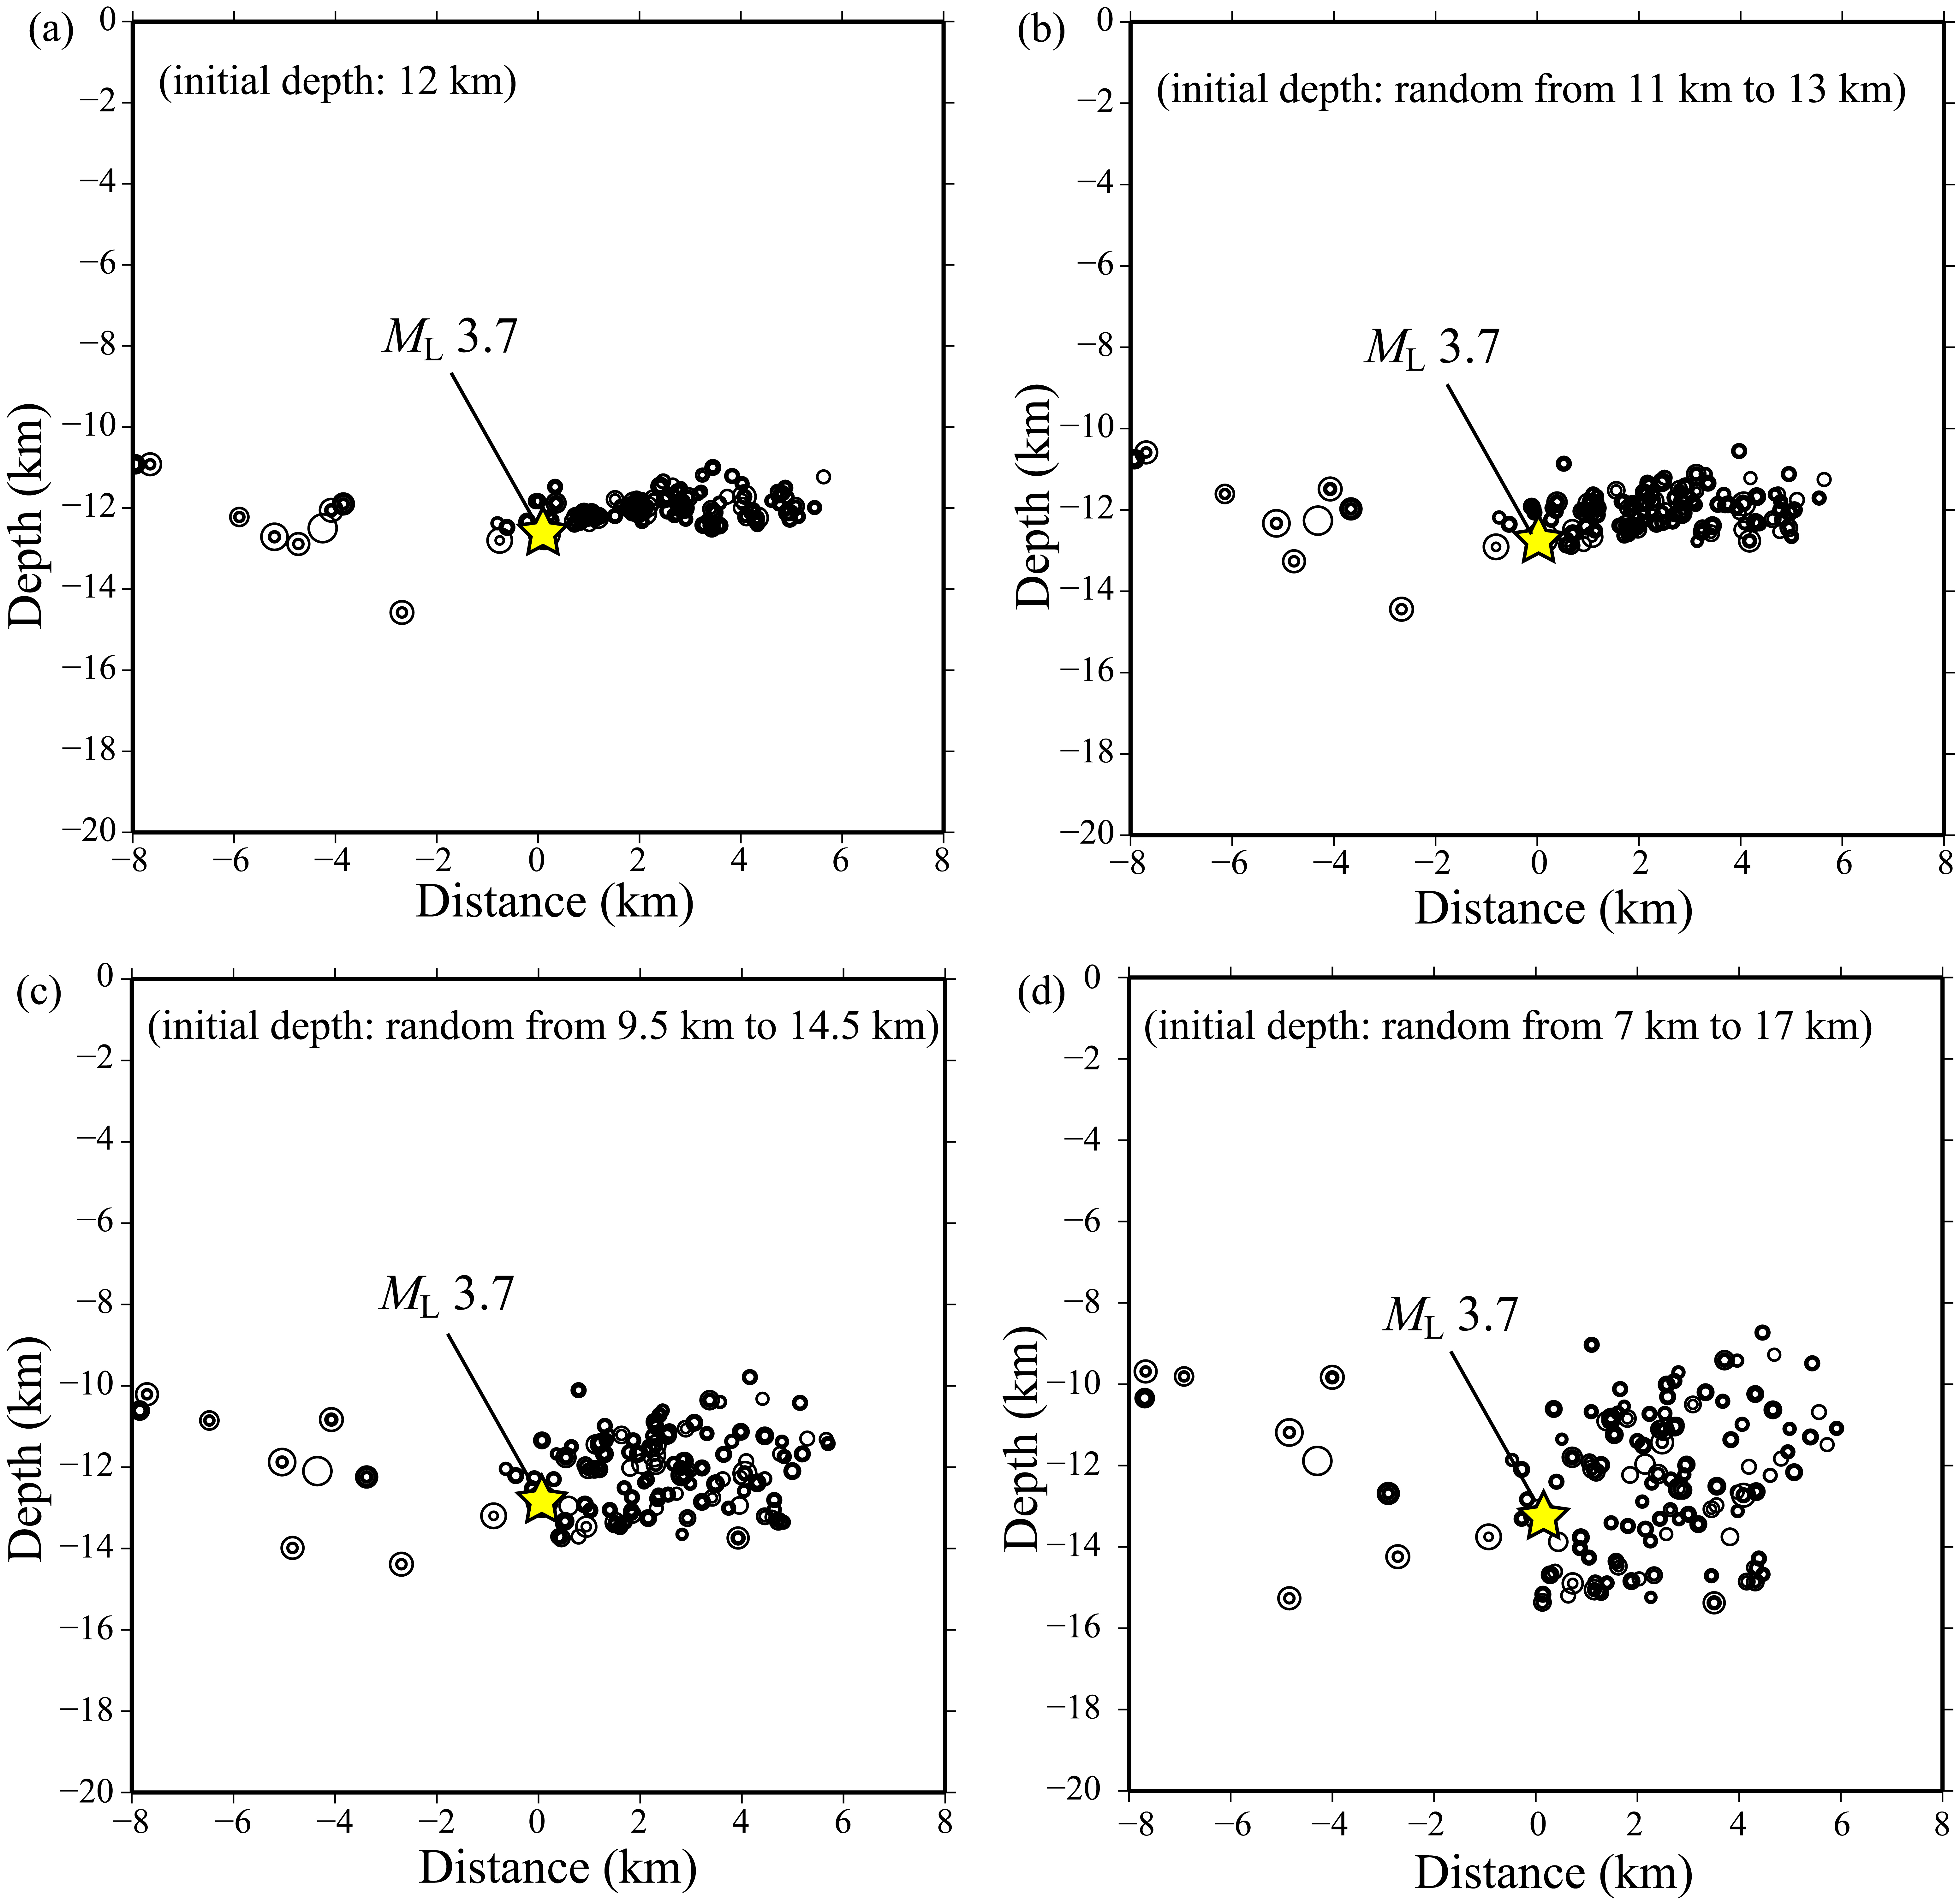
Figure S6. Cross-section view of the relocated ML 3.7 earthquake sequence. Yellow stars and open circles denote the location of the ML 3.7 earthquake and its aftershocks, respectively. (a) The initial depths of all events are set to 12 km. (b) The initial depths of events are set randomly from 11 to 13 km. (c) The initial depths of events are set randomly from 9.5 to 14.5 km. (d) The initial depths of events are set randomly from 7 to 17 km.
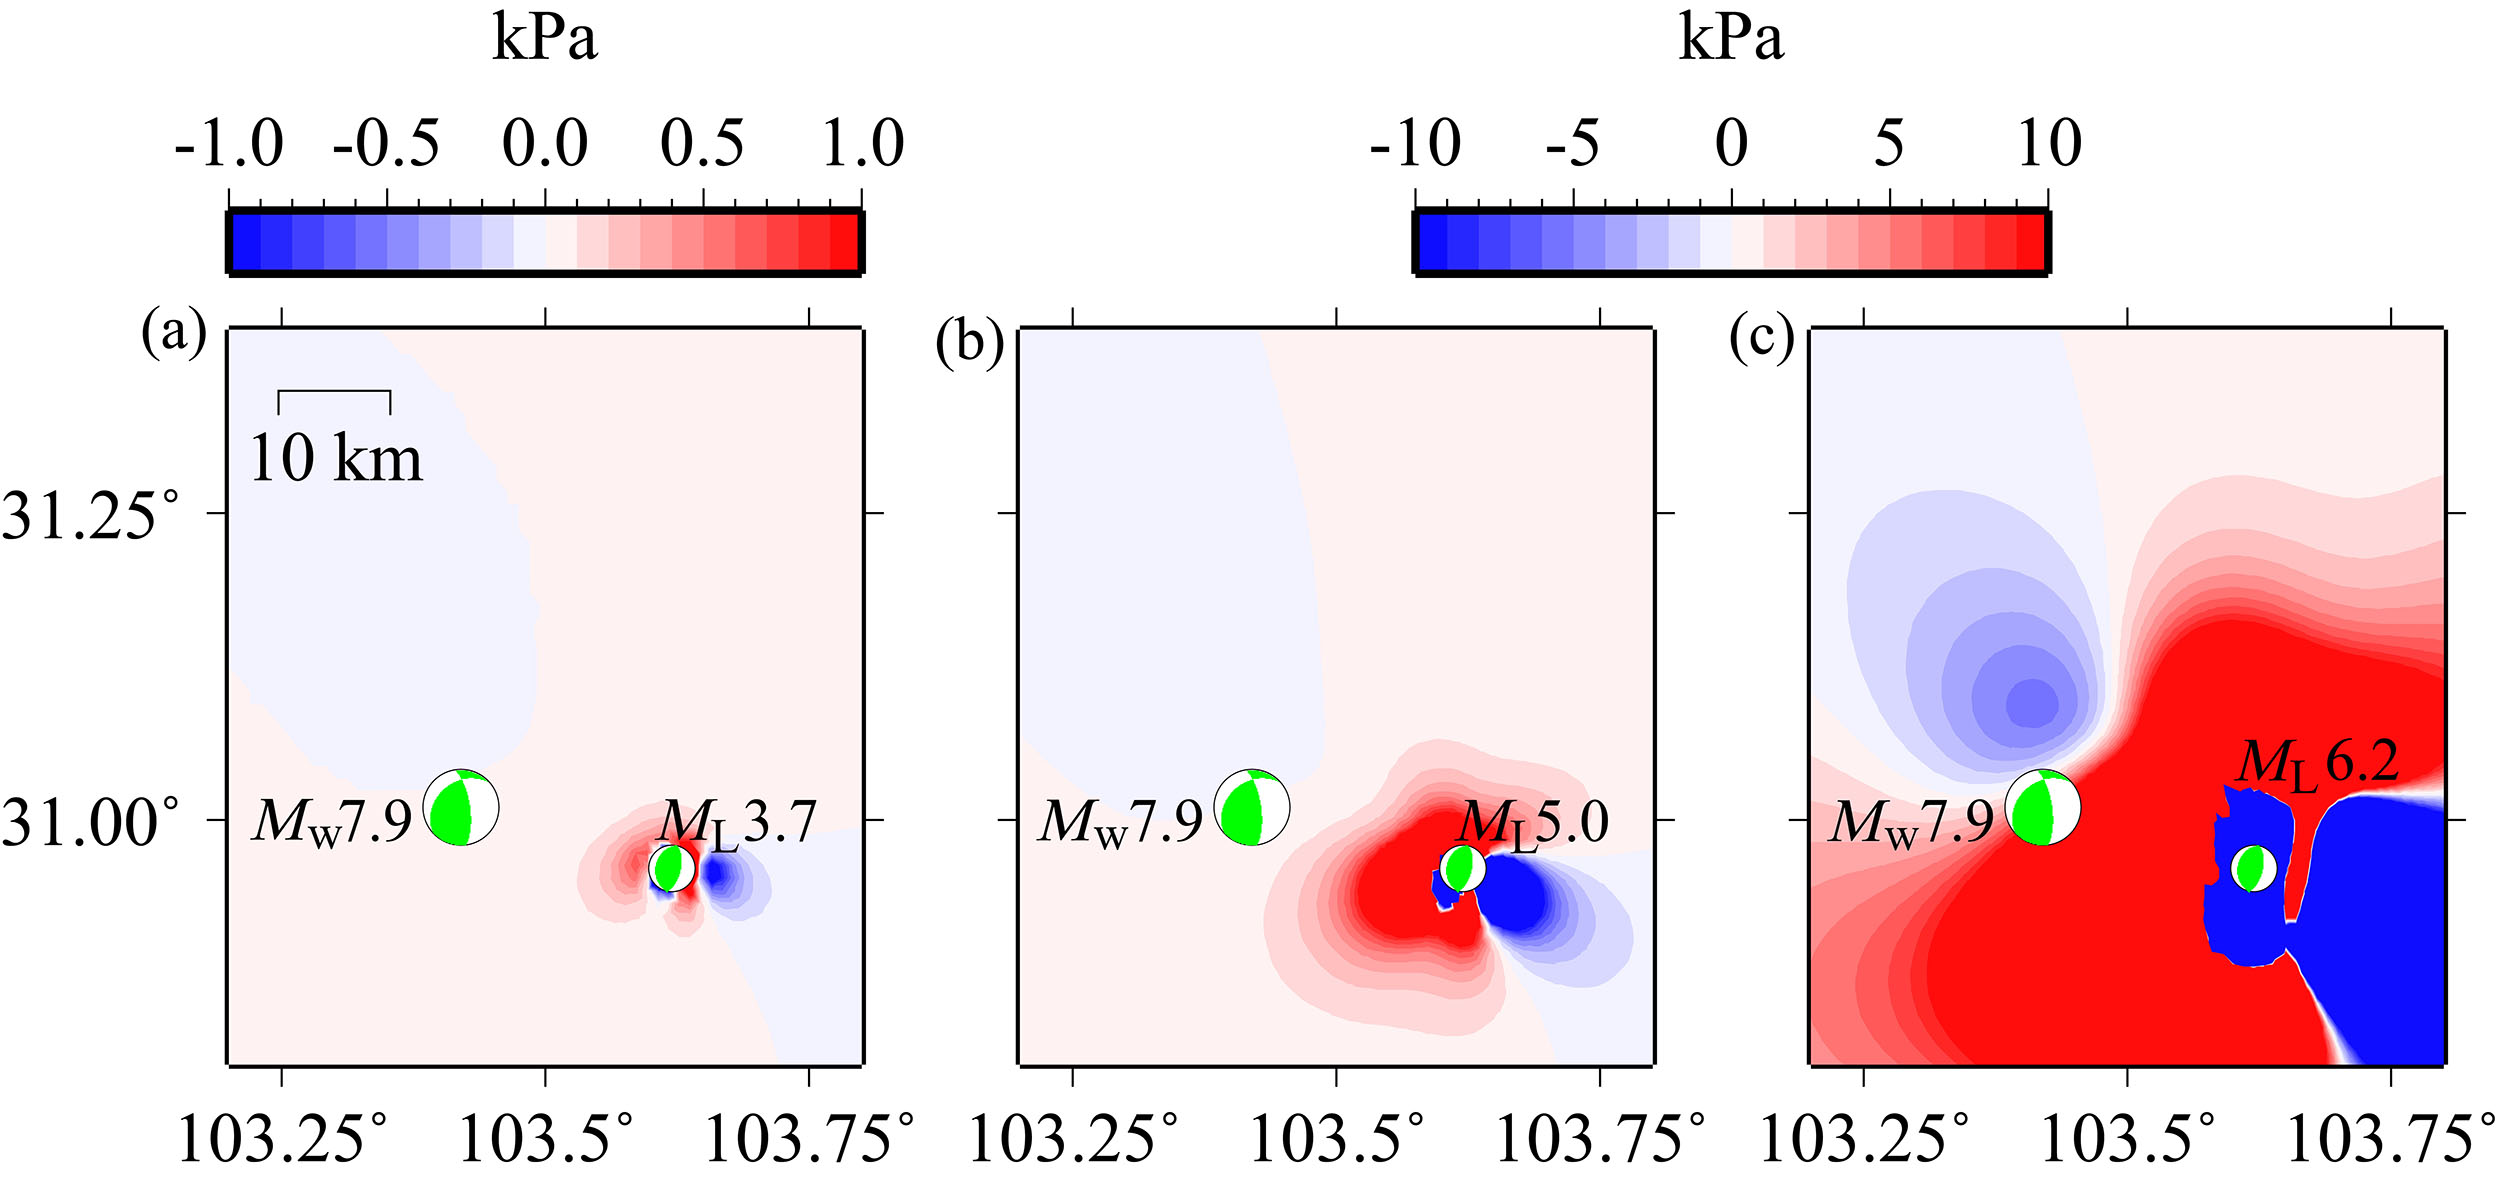
Figure S7. (a) Static Coulomb stress changes caused by the ML 3.7 earthquake. The focal mechanism of the Wenchuan earthquake is used as the receiver fault. The stress changes are computed at the Wenchuan earthquake focal depth (i.e., 14 km). (b) Coulomb stress changes caused by a hypothetic ML 5.0 earthquake. (c) Coulomb stress changes caused by a hypothetic ML 6.2 earthquake.
[ Back ]