This electronic supplement includes a figure demonstrating possible distinct arrivals at station TKCH08 (Fig. S1), additional three-component velocity waveforms for all stations using our reference earthquake scenario (Fig. S2), and a scenario with a rupture velocity of 2.5 km/s (Fig. S3). Figure S4 shows the distribution of high stress-drop subevents used to produce Figure 12 in the main article.
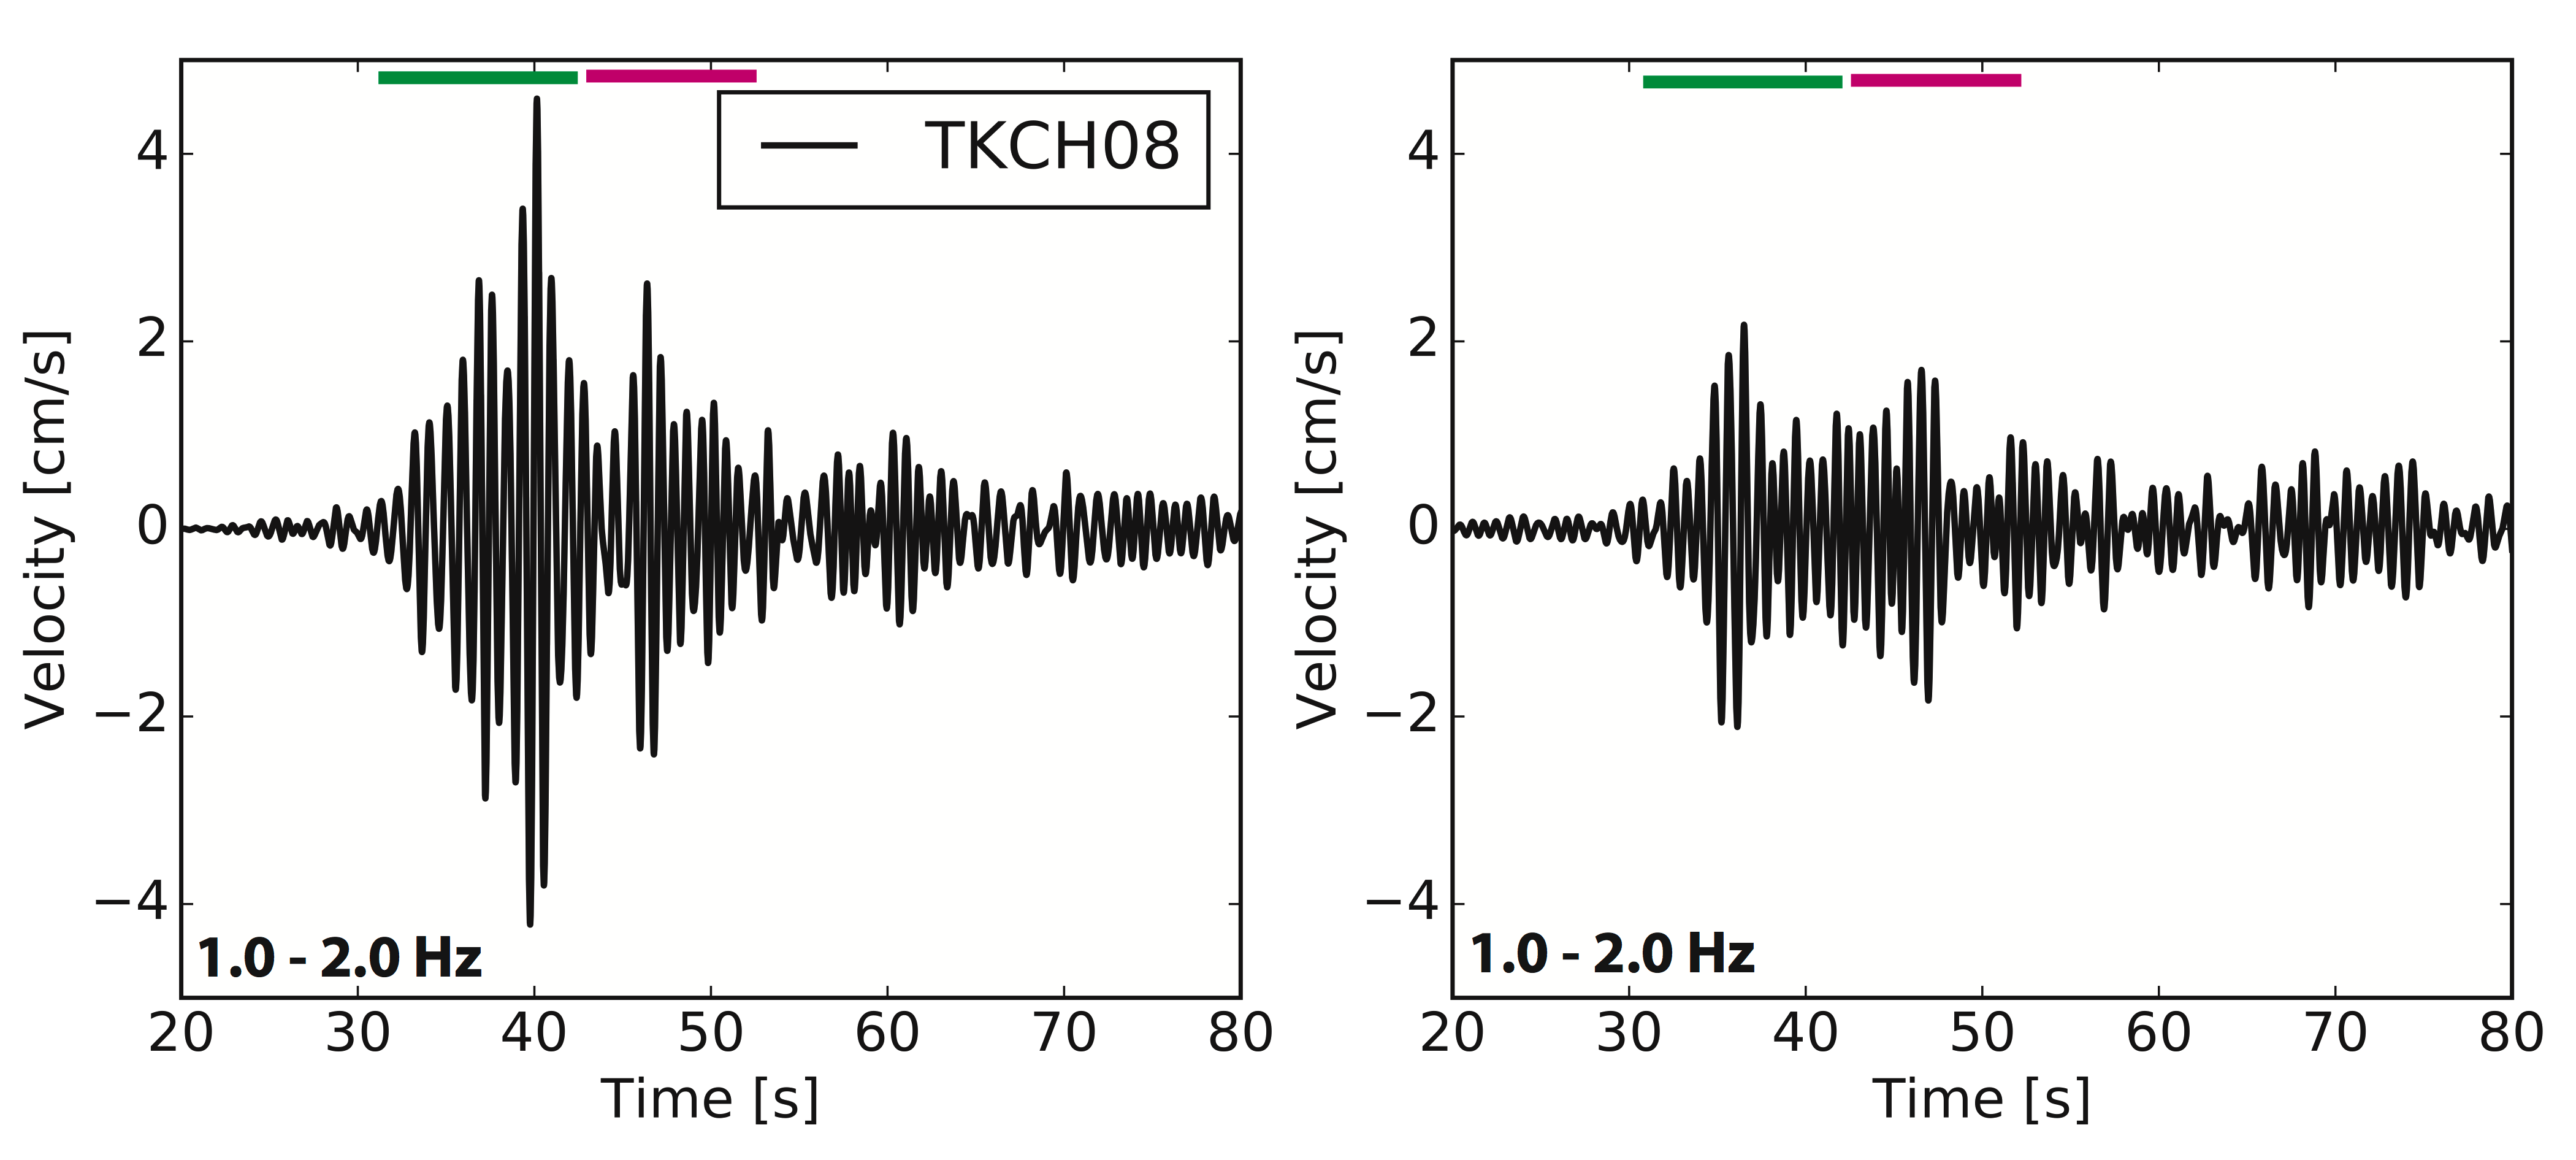
Figure S1. Horizontal velocity seismograms (left, east–west; right, north–south) for station TKCH08 using a band-pass filter of 1.0–2.0 Hz. Two distinct arrivals are evident (indicated by the horizontal bars), which may be suggestive of distinct high-stress-drop subevents.
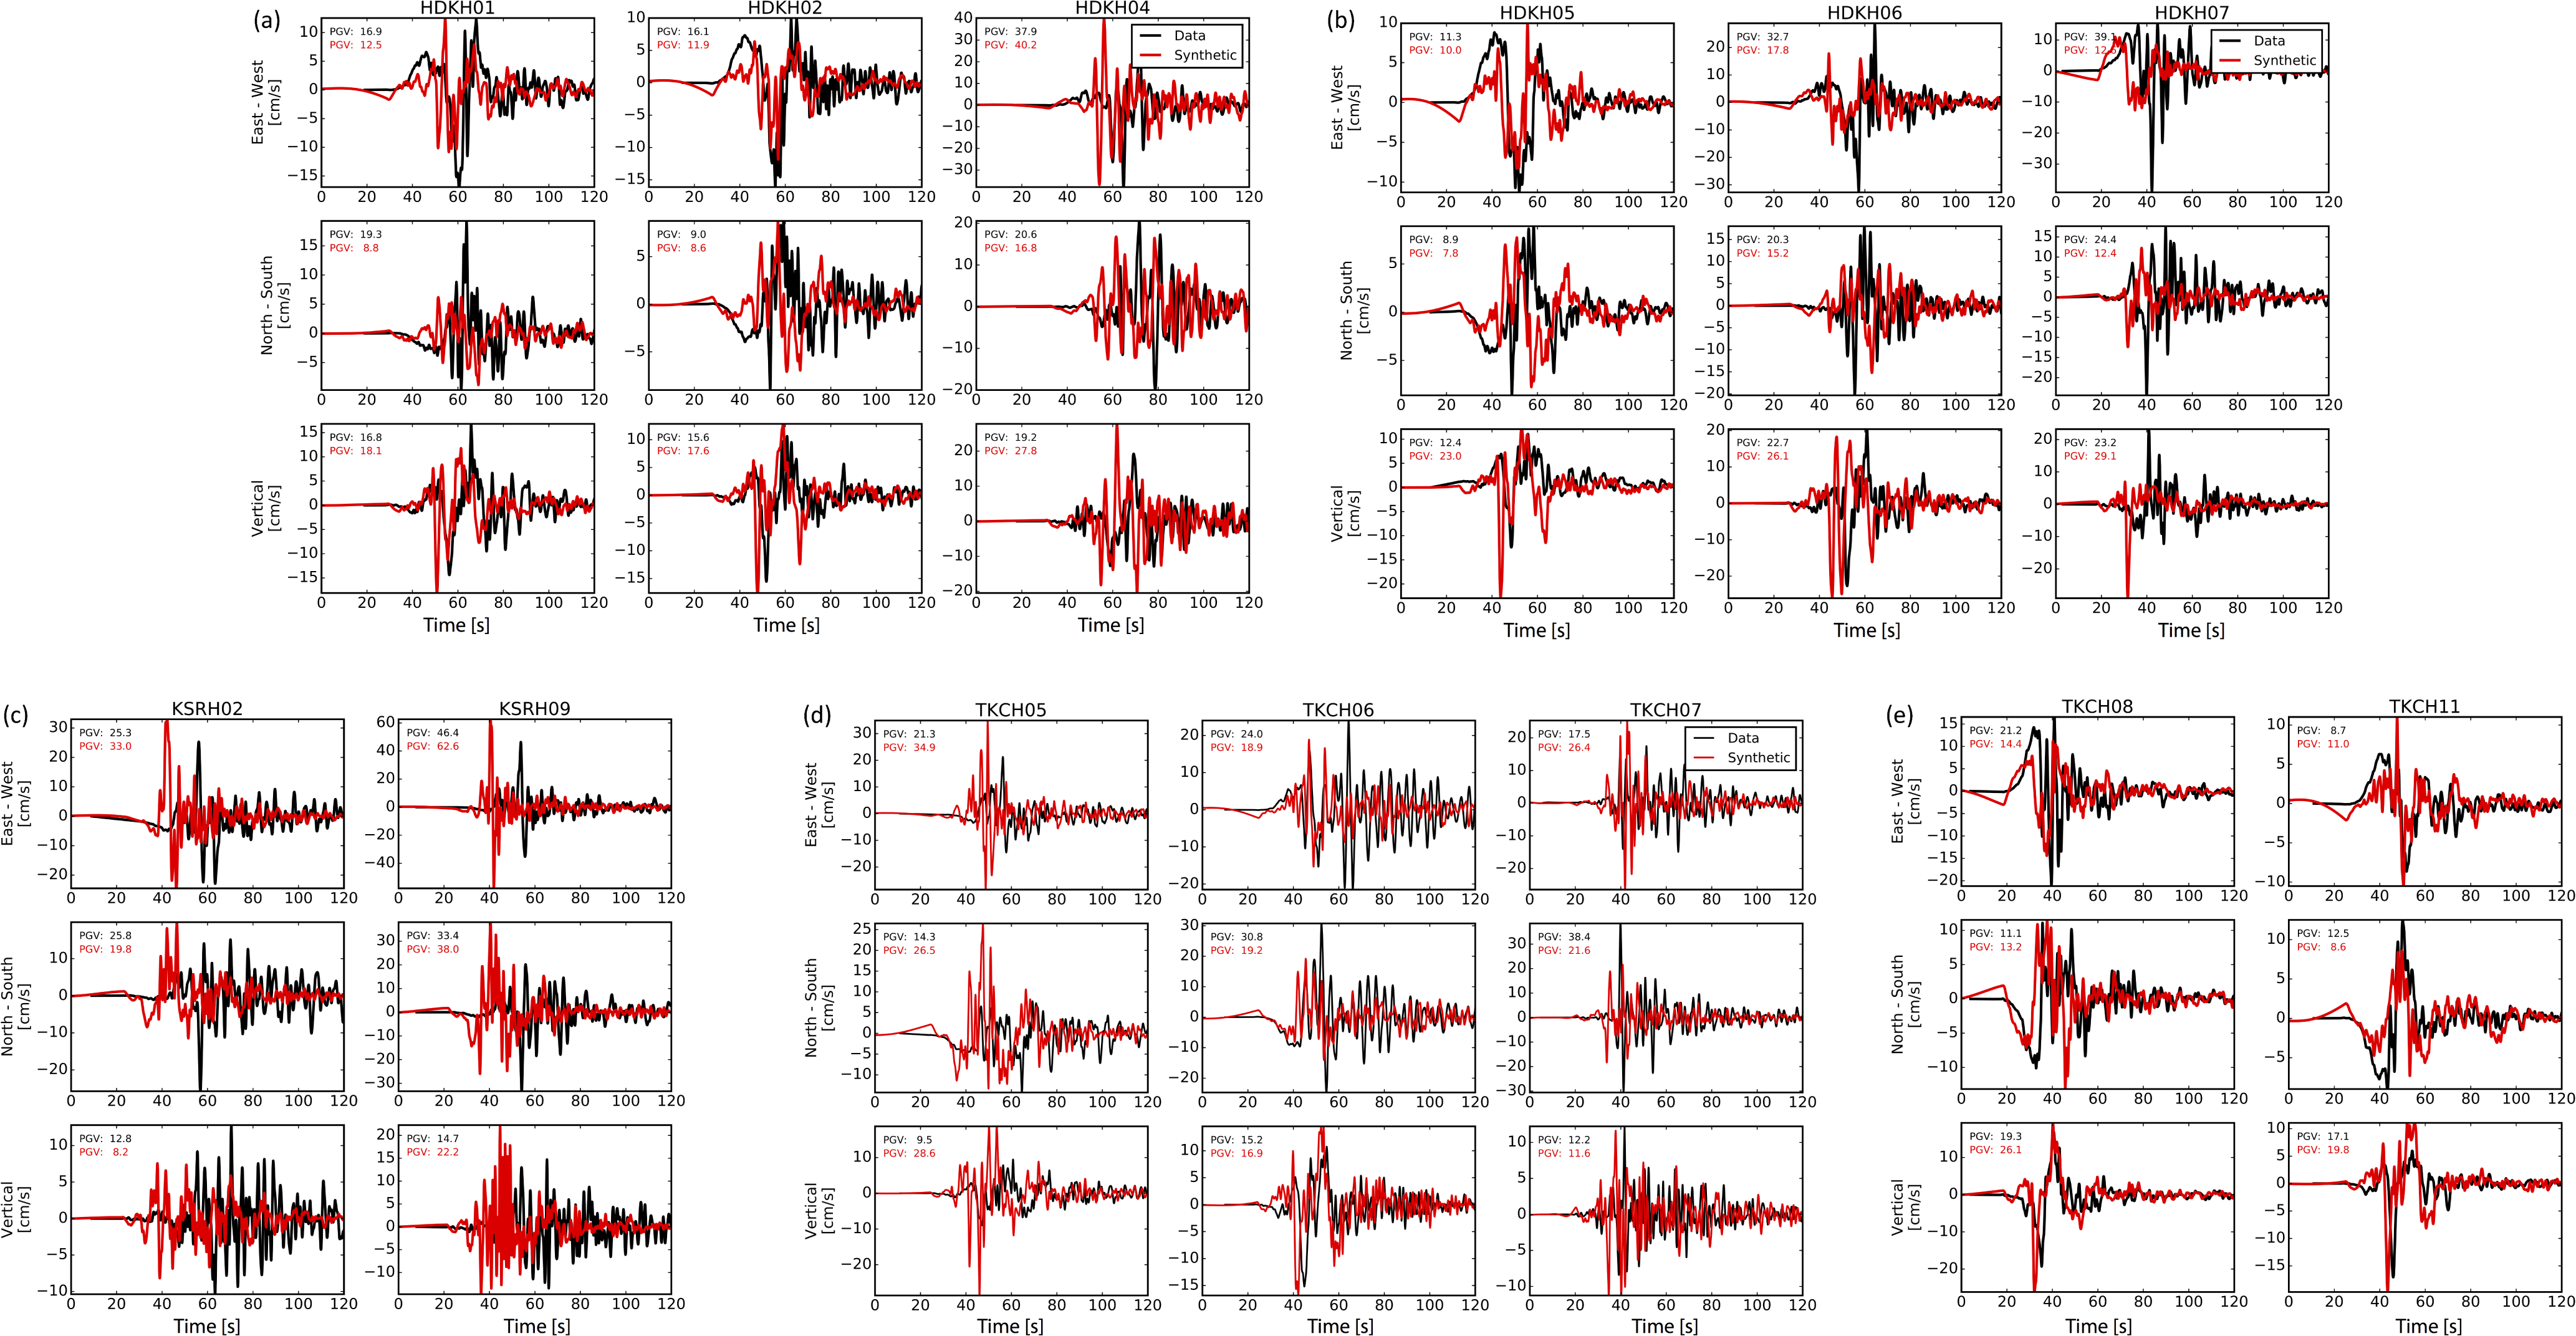
Figure S2. Example three-component velocity waveforms from all stations showing both actual data and deterministic synthetics. Peak ground velocities (cm/s) are given in the upper left corner of each panel. All waveforms are low-passed at 1 Hz to remain consistent with the accuracy of the 3D finite-difference modeling.
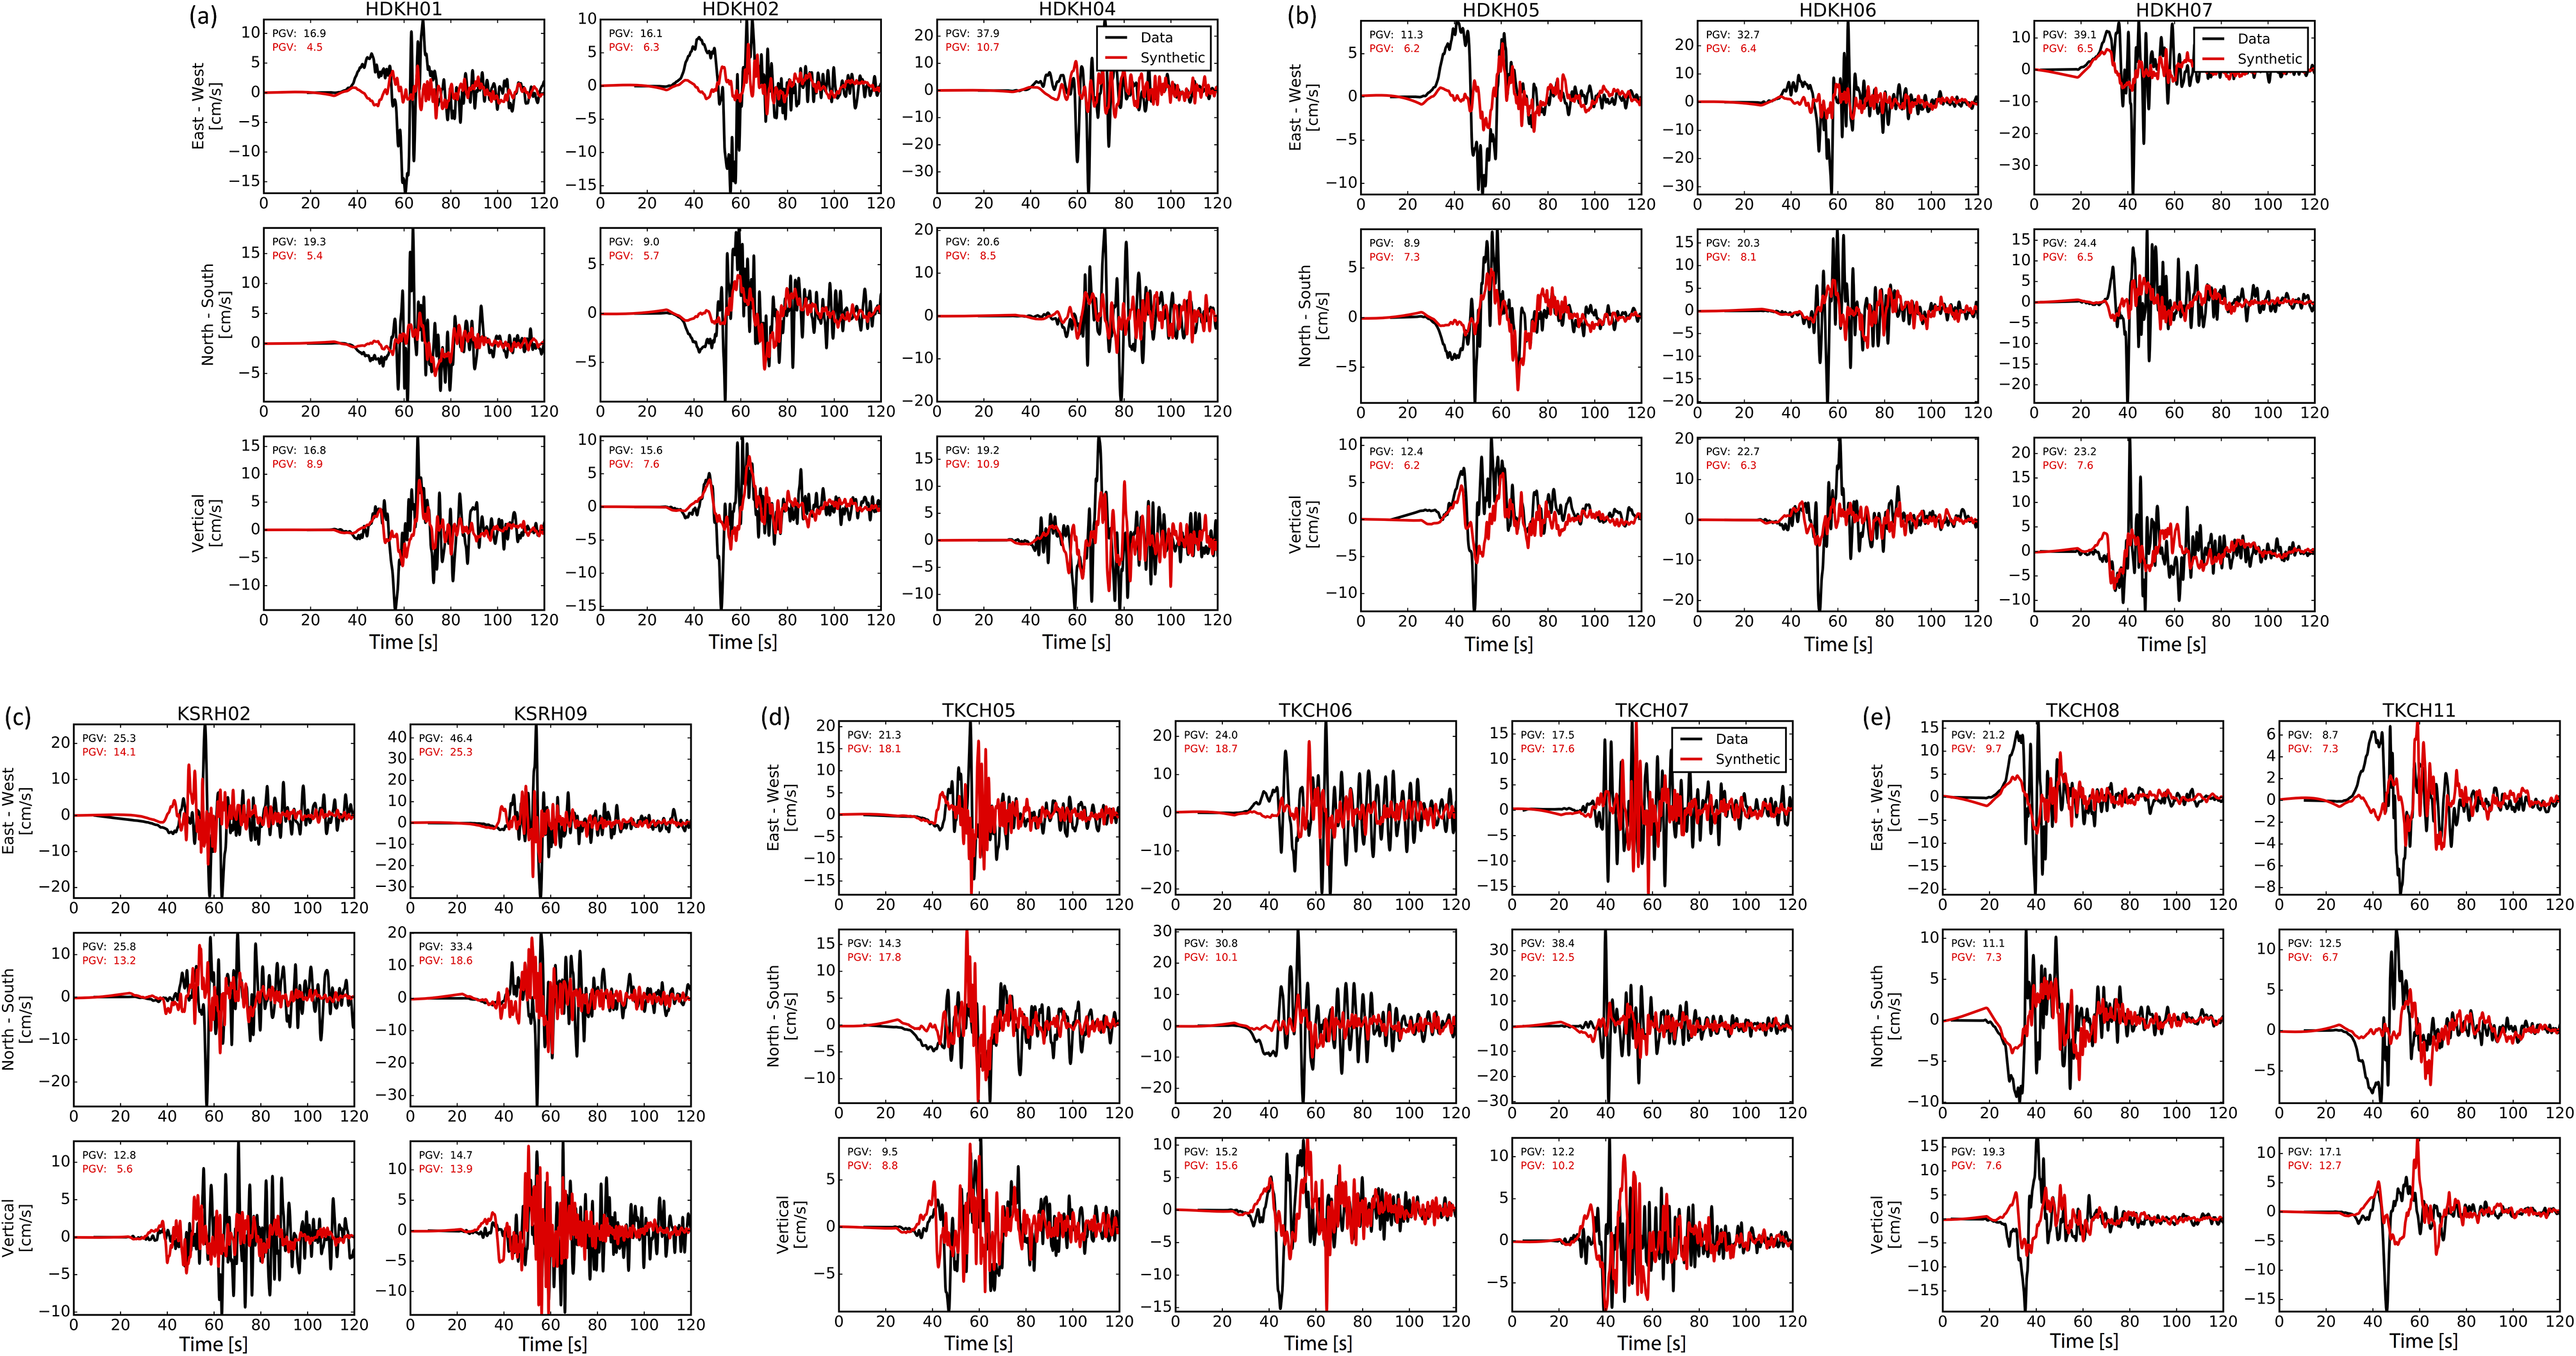
Figure S3. Example three-component velocity waveforms from all stations using a rupture velocity of 2.5 km/s. Plotting is as described in Figure S2.
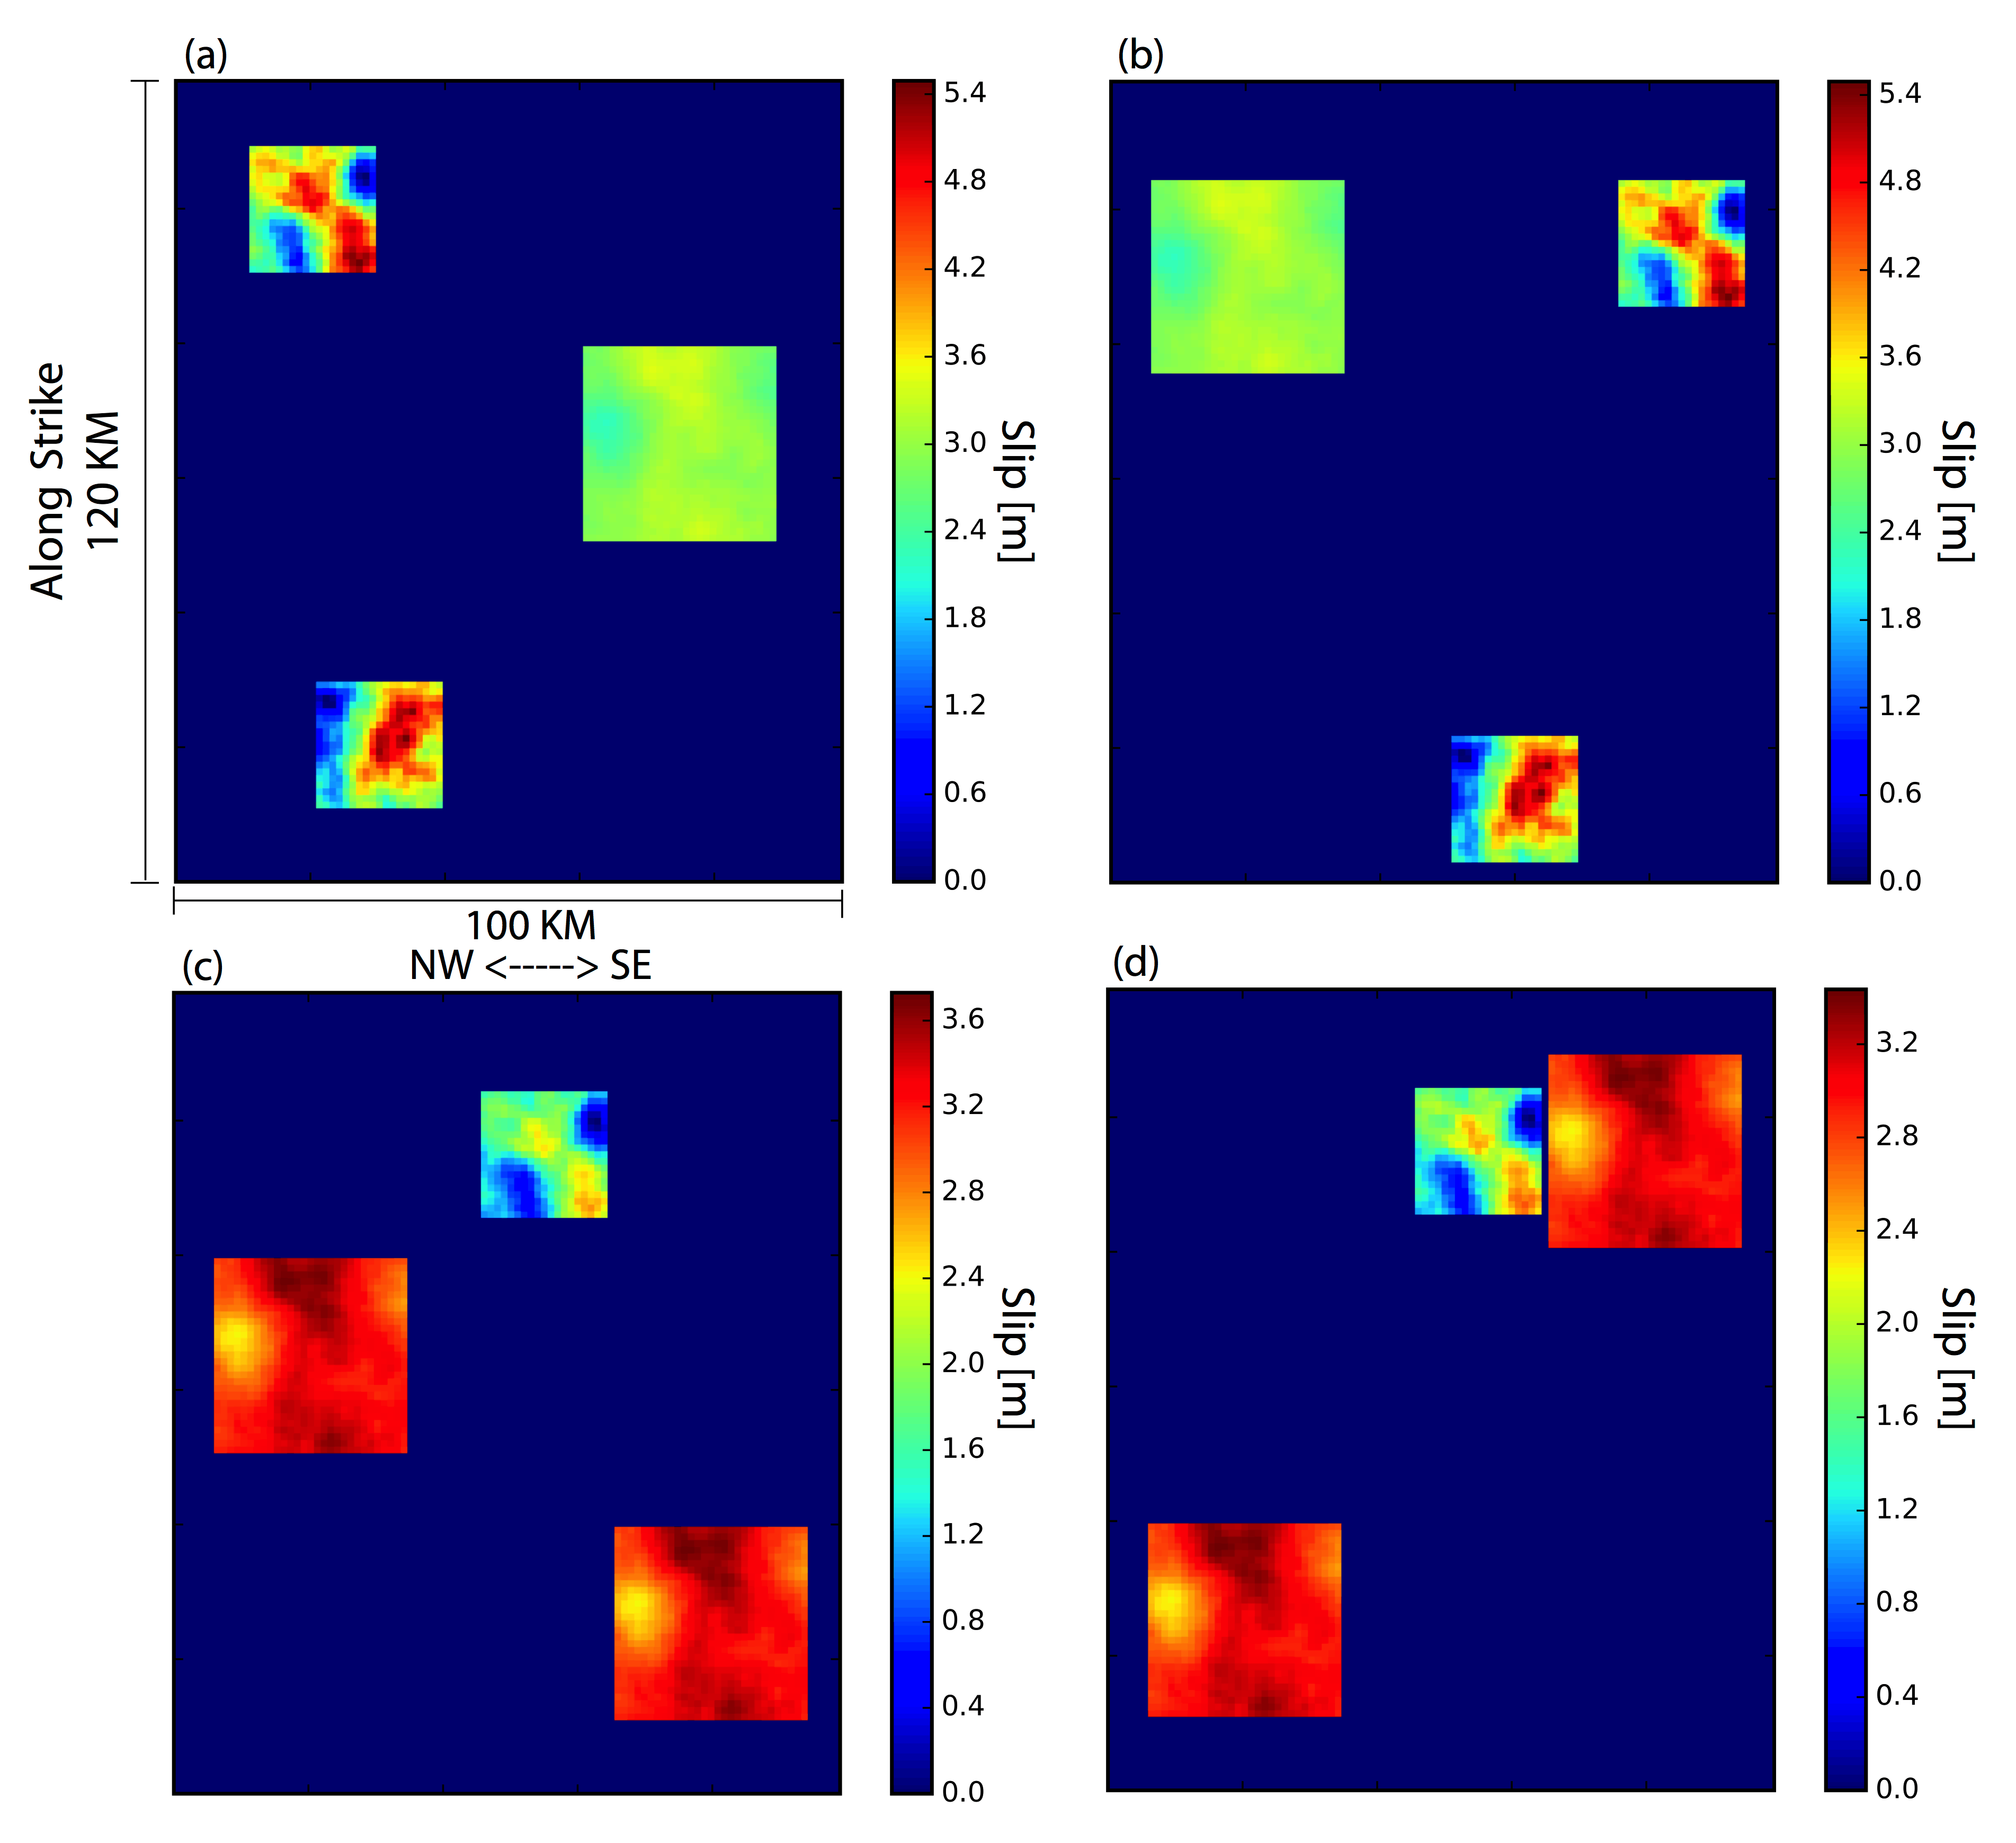
Figure S4. Subevent slip distribution for (a) the reference scenario and (b–d, respectively) the alternative scenarios 2–4 as shown in Figure 12 in the main article. Note that the scale bar varies for each panel.
[ Back ]