This electronic supplement contains procedural details and expanded results from the OSL sample analyses, as well as paleoseismic trench logs at the original draft scale.
Table_S1.txt. Procedural steps for Single Aliquot Regeneration Protocol for Optical Data.
Table_S2.txt. Luminescence Parameters used in Preparation and Analyses of Samples for Quartz OSL.
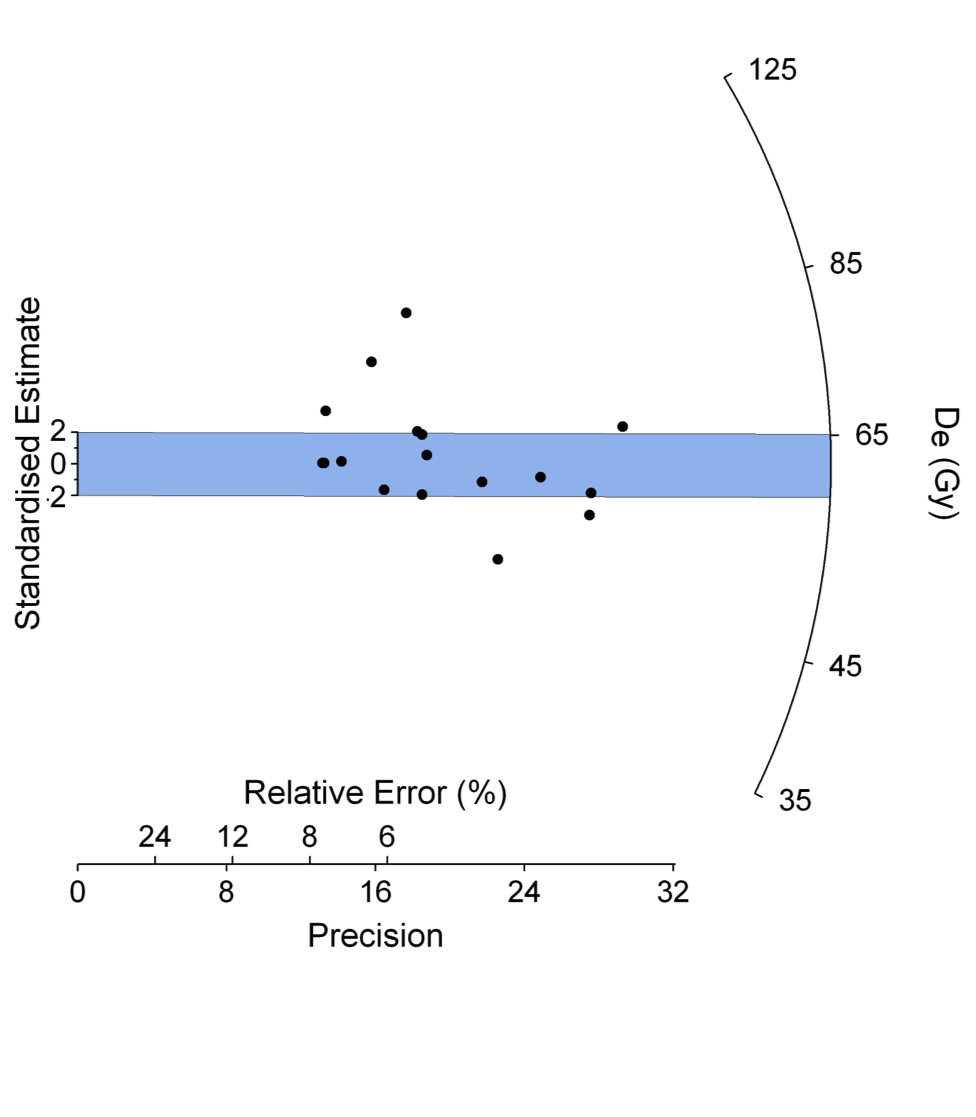
Figure_S1.png. Sample SFTP1-1 showing 17 of 20 aliquots. This sample produced an equal spread of aliquots that plot both above and below the standardized estimate (blue). It is possible that more analyses (i.e., a greater number of aliquots) would resolve a trend within the observed scatter, but for this data the average of the equivalent doses is around 60 Gy, with 18% overdispersion (3/17).
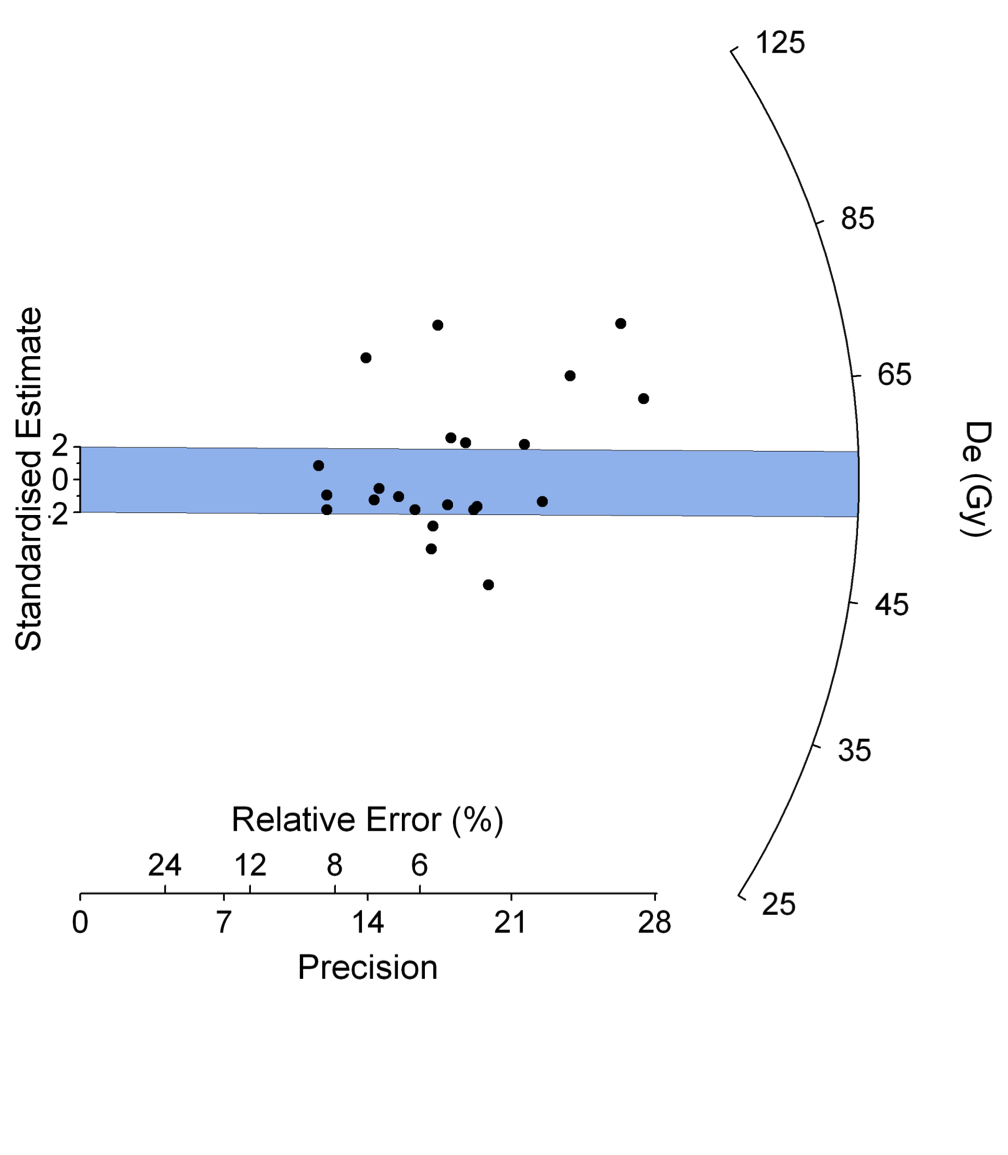
Figure_S2.png. Sample SFTP1-2 showing 22 of 25 aliquots. This sample produced a significant number of aliquots carrying a larger equivalent dose (above the two sigma zone) with varying degrees of precision. Five aliquots plot far above the two sigma standardized estimate (shown in blue) while three aliquots are close to the two sigma estimate (22% over-dispersion, 5/22). The five upper points indicate that grains in these aliquots were not fully bleached prior to deposition, though lower equivalent doses are also common and may indicate bioturbation or sediment mixing.
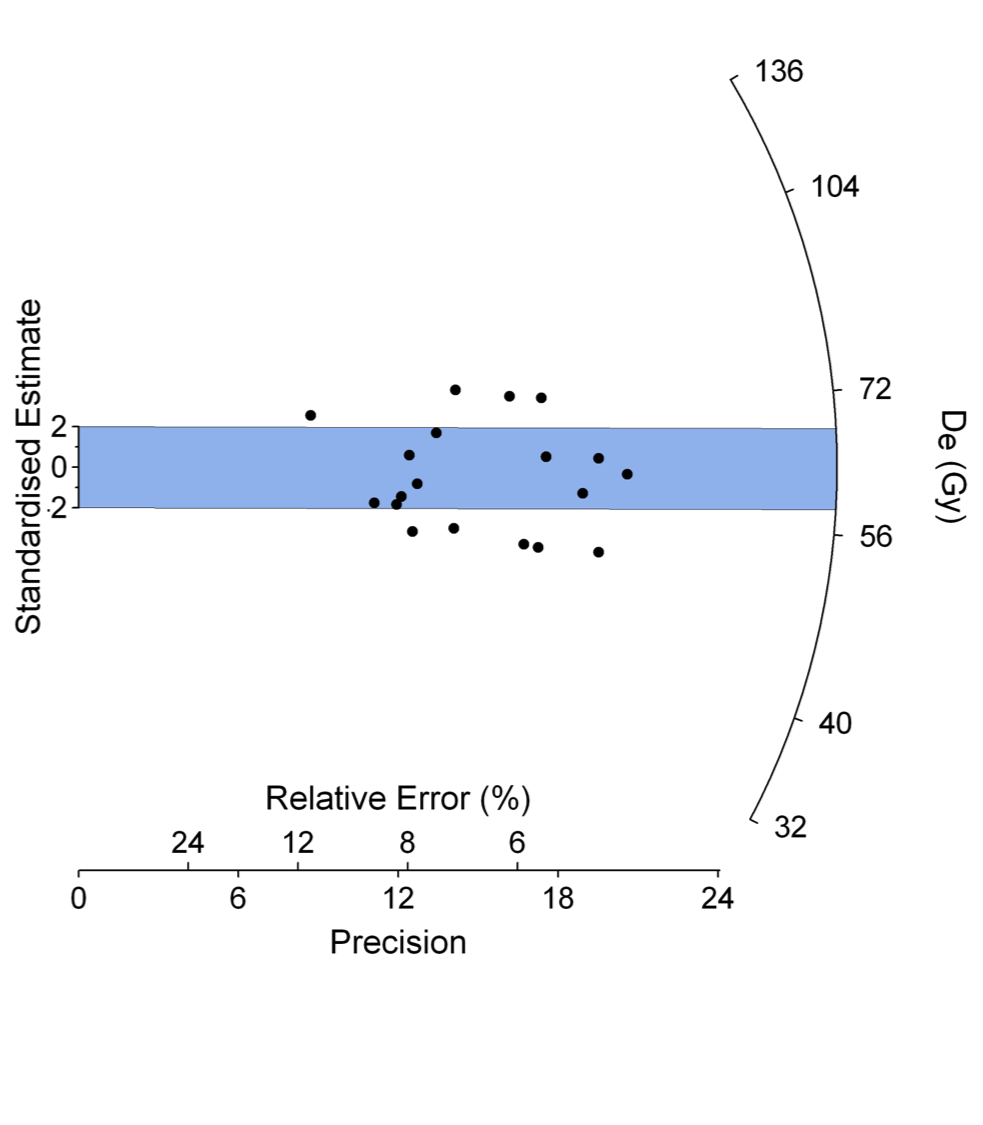
Figure_S3.png. Sample SFTP1-3 showing 17 of 20 aliquots. This plot shows the best bleaching scenario in this set of samples—outlying data points are not systematically high or low, although there is a scatter in the aliquot equivalent dose. The two sigma estimate (in blue) is averaged at about 63 Gy, which is very close to the weighted mean of 66 Gy shown in Table 1.
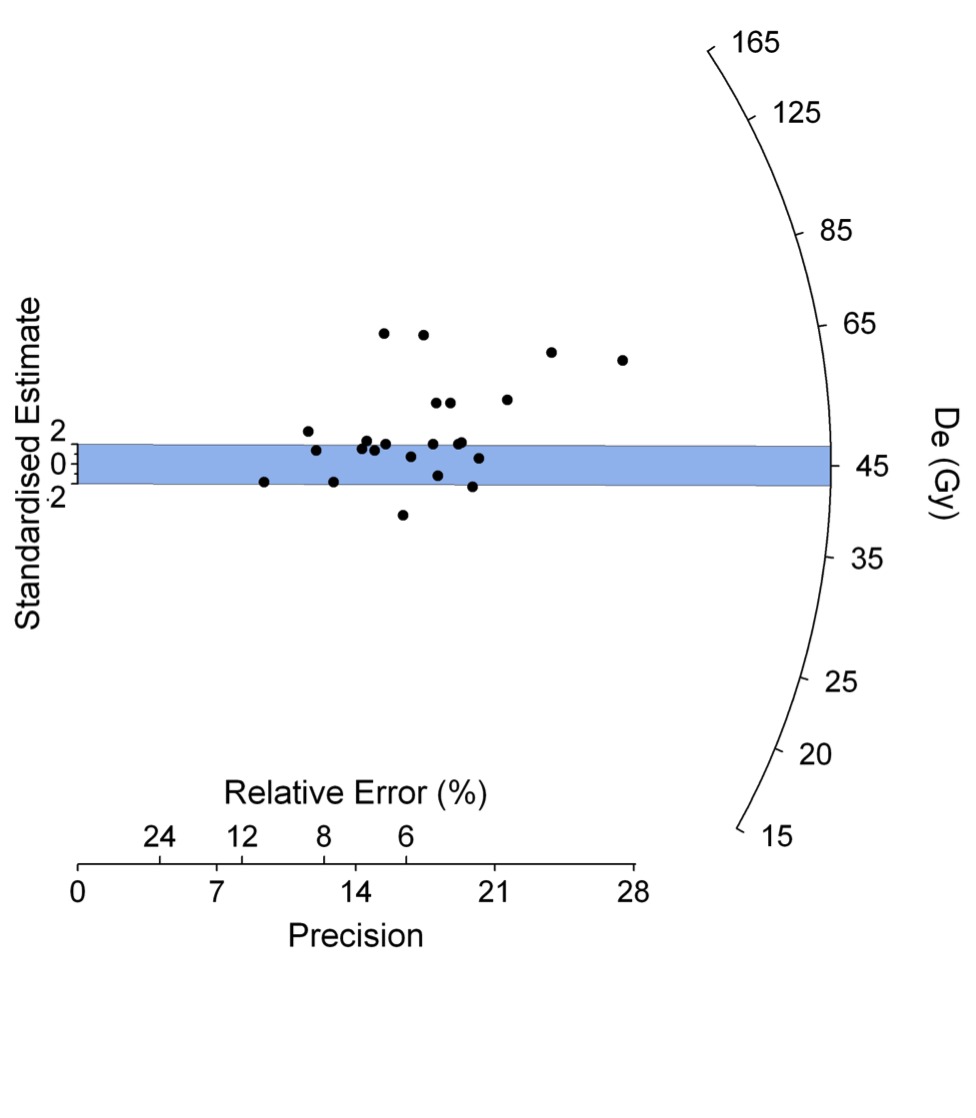
Figure_S4.png. Sample SFTP1-4 showing 23 of 25 aliquots. Several aliquots in this sample carry larger equivalent doses, indicating that this deposit has significant partial bleaching problems compared to samples SFTP1-5 and SFTP1-6. Eight aliquots plot above the two sigma standardized estimate (shown in blue) and indicate that grains in these aliquots were not fully bleached prior to deposition. The over-dispersion of the outliers is about 35% (8/23, discounting the lower outlier), indicating that partial bleaching is a significant factor in the scatter of the equivalent doses.
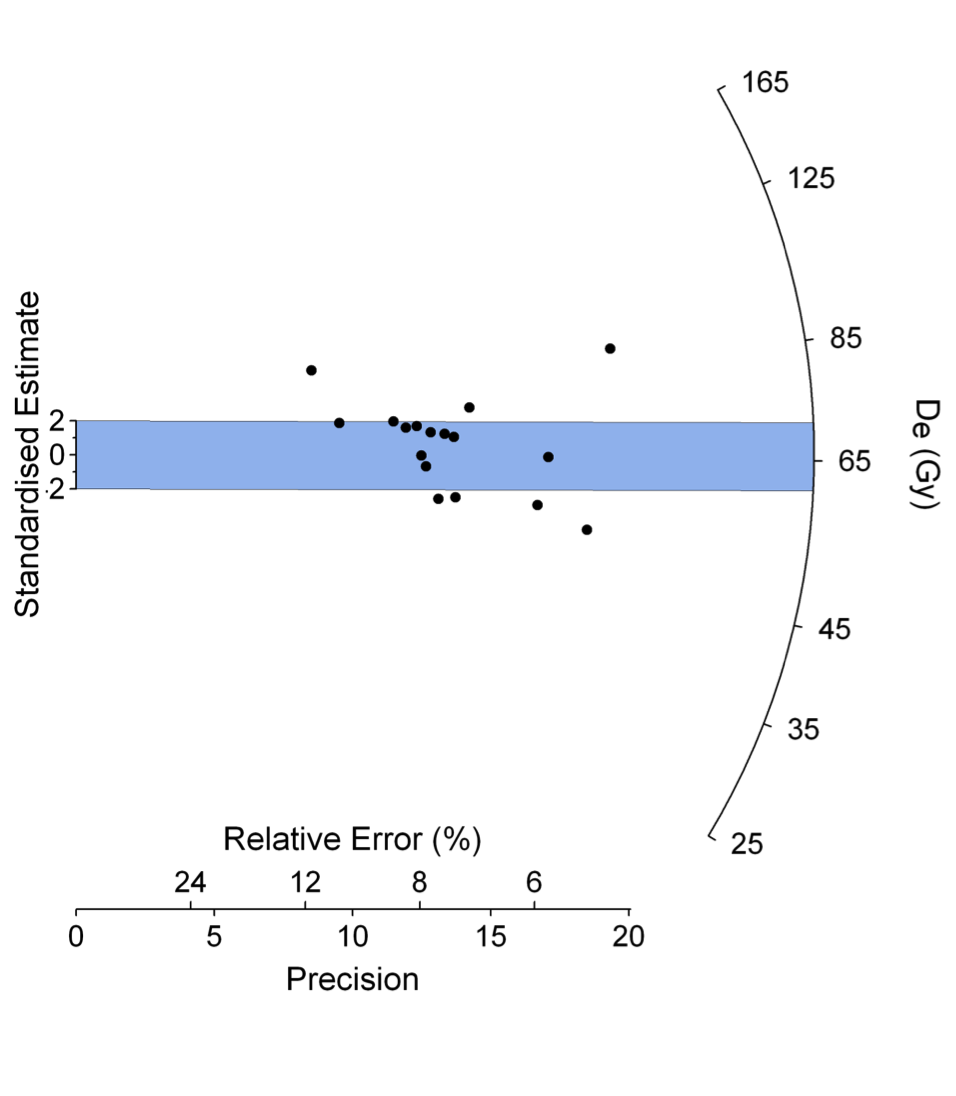
Figure_S5.png. Sample SFT1-5 showing 17 of 20 aliquots. As in sample SFTP1-6, two notable outliers shows larger equivalent doses. One is more precise (90.8 ± 4.7 Gy with a 5% relative error) and one is less precise (118 ± 14 Gy with a 12% relative error). Both points plot above the two sigma standardized estimate (shown in blue) and indicate that grains in these aliquots were not fully bleached prior to deposition. The over-dispersion of the outliers is about 18% (3/17), indicating that partial bleaching may be a factor in the scatter of the equivalent doses, though lower equivalent doses are also common and may indicate bioturbation or sediment mixing.
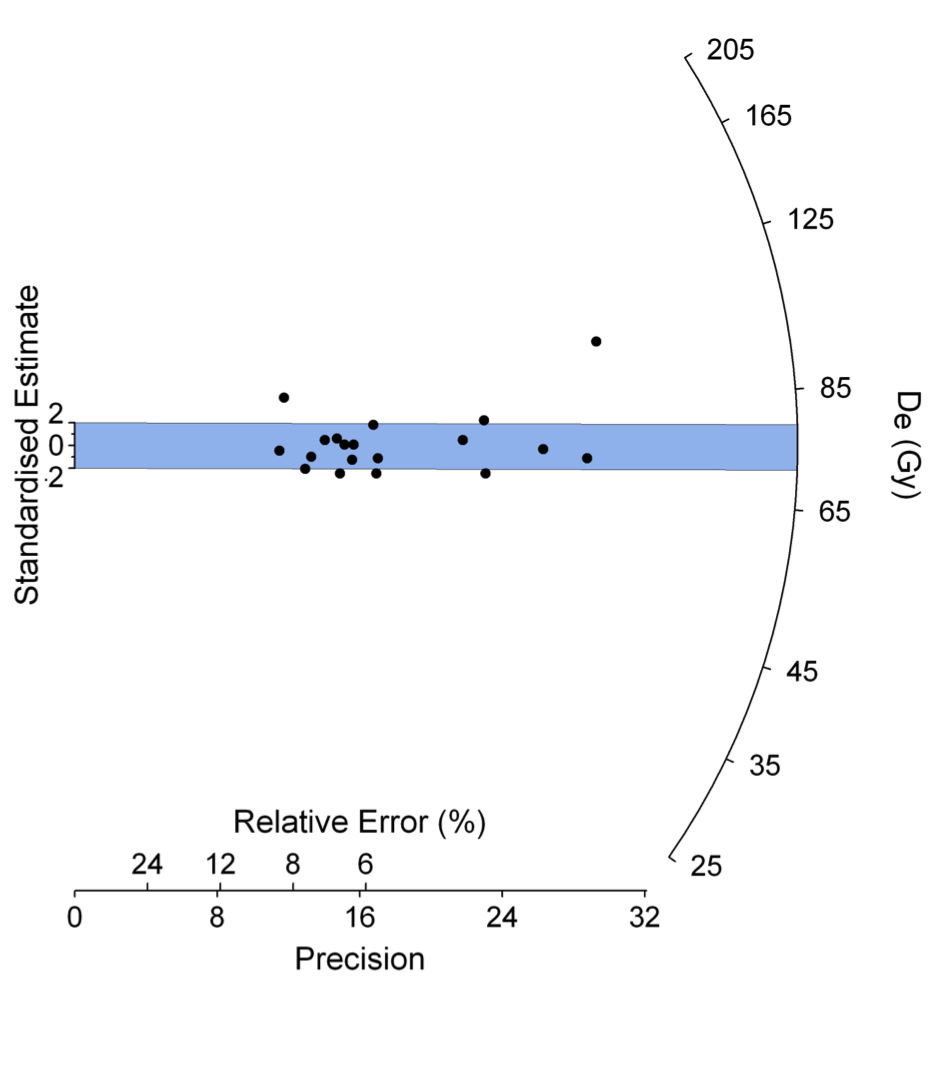
Figure_S6.png. Sample SFT1-6 showing 19 of 20 aliquots. Two notable outliers in sample SFTP1-6 show larger equivalent doses—one is very precise (103 ± 3.5 Gy with a relative error of 3%) and one is less precise (107 ± 9.1 Gy with a relative error of 8.5%). The more precise point plots near the De (Gy) axis furthest above the two sigma standardized estimate (shown in blue) and indicates that grains in this aliquot were not fully bleached prior to deposition. The over-dispersion of the outliers is about 11% (2/19), indicating that partial bleaching is not a significant factor in the scatter of the equivalent doses.
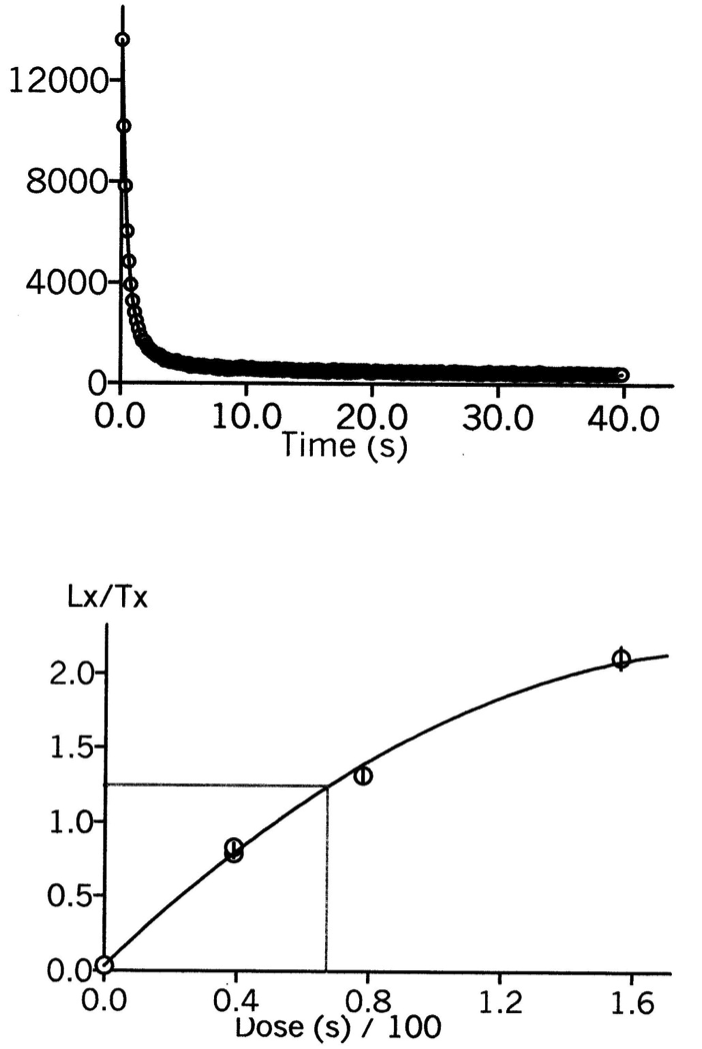
Figure_S7.png. A) Plot of OSL decay curve for SFTP1-6, showing quartz signal accessing the “fast component of OSL”. Time is measured in seconds (s) and OSL is measured in photon counts/second and peaked at 13,500 photons/second. B) Plot of SFTP1-6 growth curve—regeneration proceeded “normally,” with a recycle within 5% of the first measurement and increases in responses to increasing beta radiation. The beta source delivered ~ 0.071 Gy/s to these coarse‐grains mounted on stainless steel discs (at 400 seconds, 800 seconds and1600 seconds). A dose‐response curve is fitted through the points and the intercept of the LN/TN value is used to obtain a De value (in seconds, and hence then in Gy) for the aliquot. The aliquot response is fitted to an exponential curve.
Plate_1_T1.pdf [PDF; 3.4 MB]. Detailed interpretive log for trench T1 presented at the original logged scale.
Plate_2_TP1.pdf [PDF; 1.2 MB]. Detailed interpretive log for test pit TP1 presented at the original logged scale.
Murray, A. S. and A. G. Wintle (2000) Luminescence dating of quartz using an improved single-aliquot regenerative- dose protocol, Radiat. Meas. 32 57-73.
[ Back ]