Illustrations noted in main text.
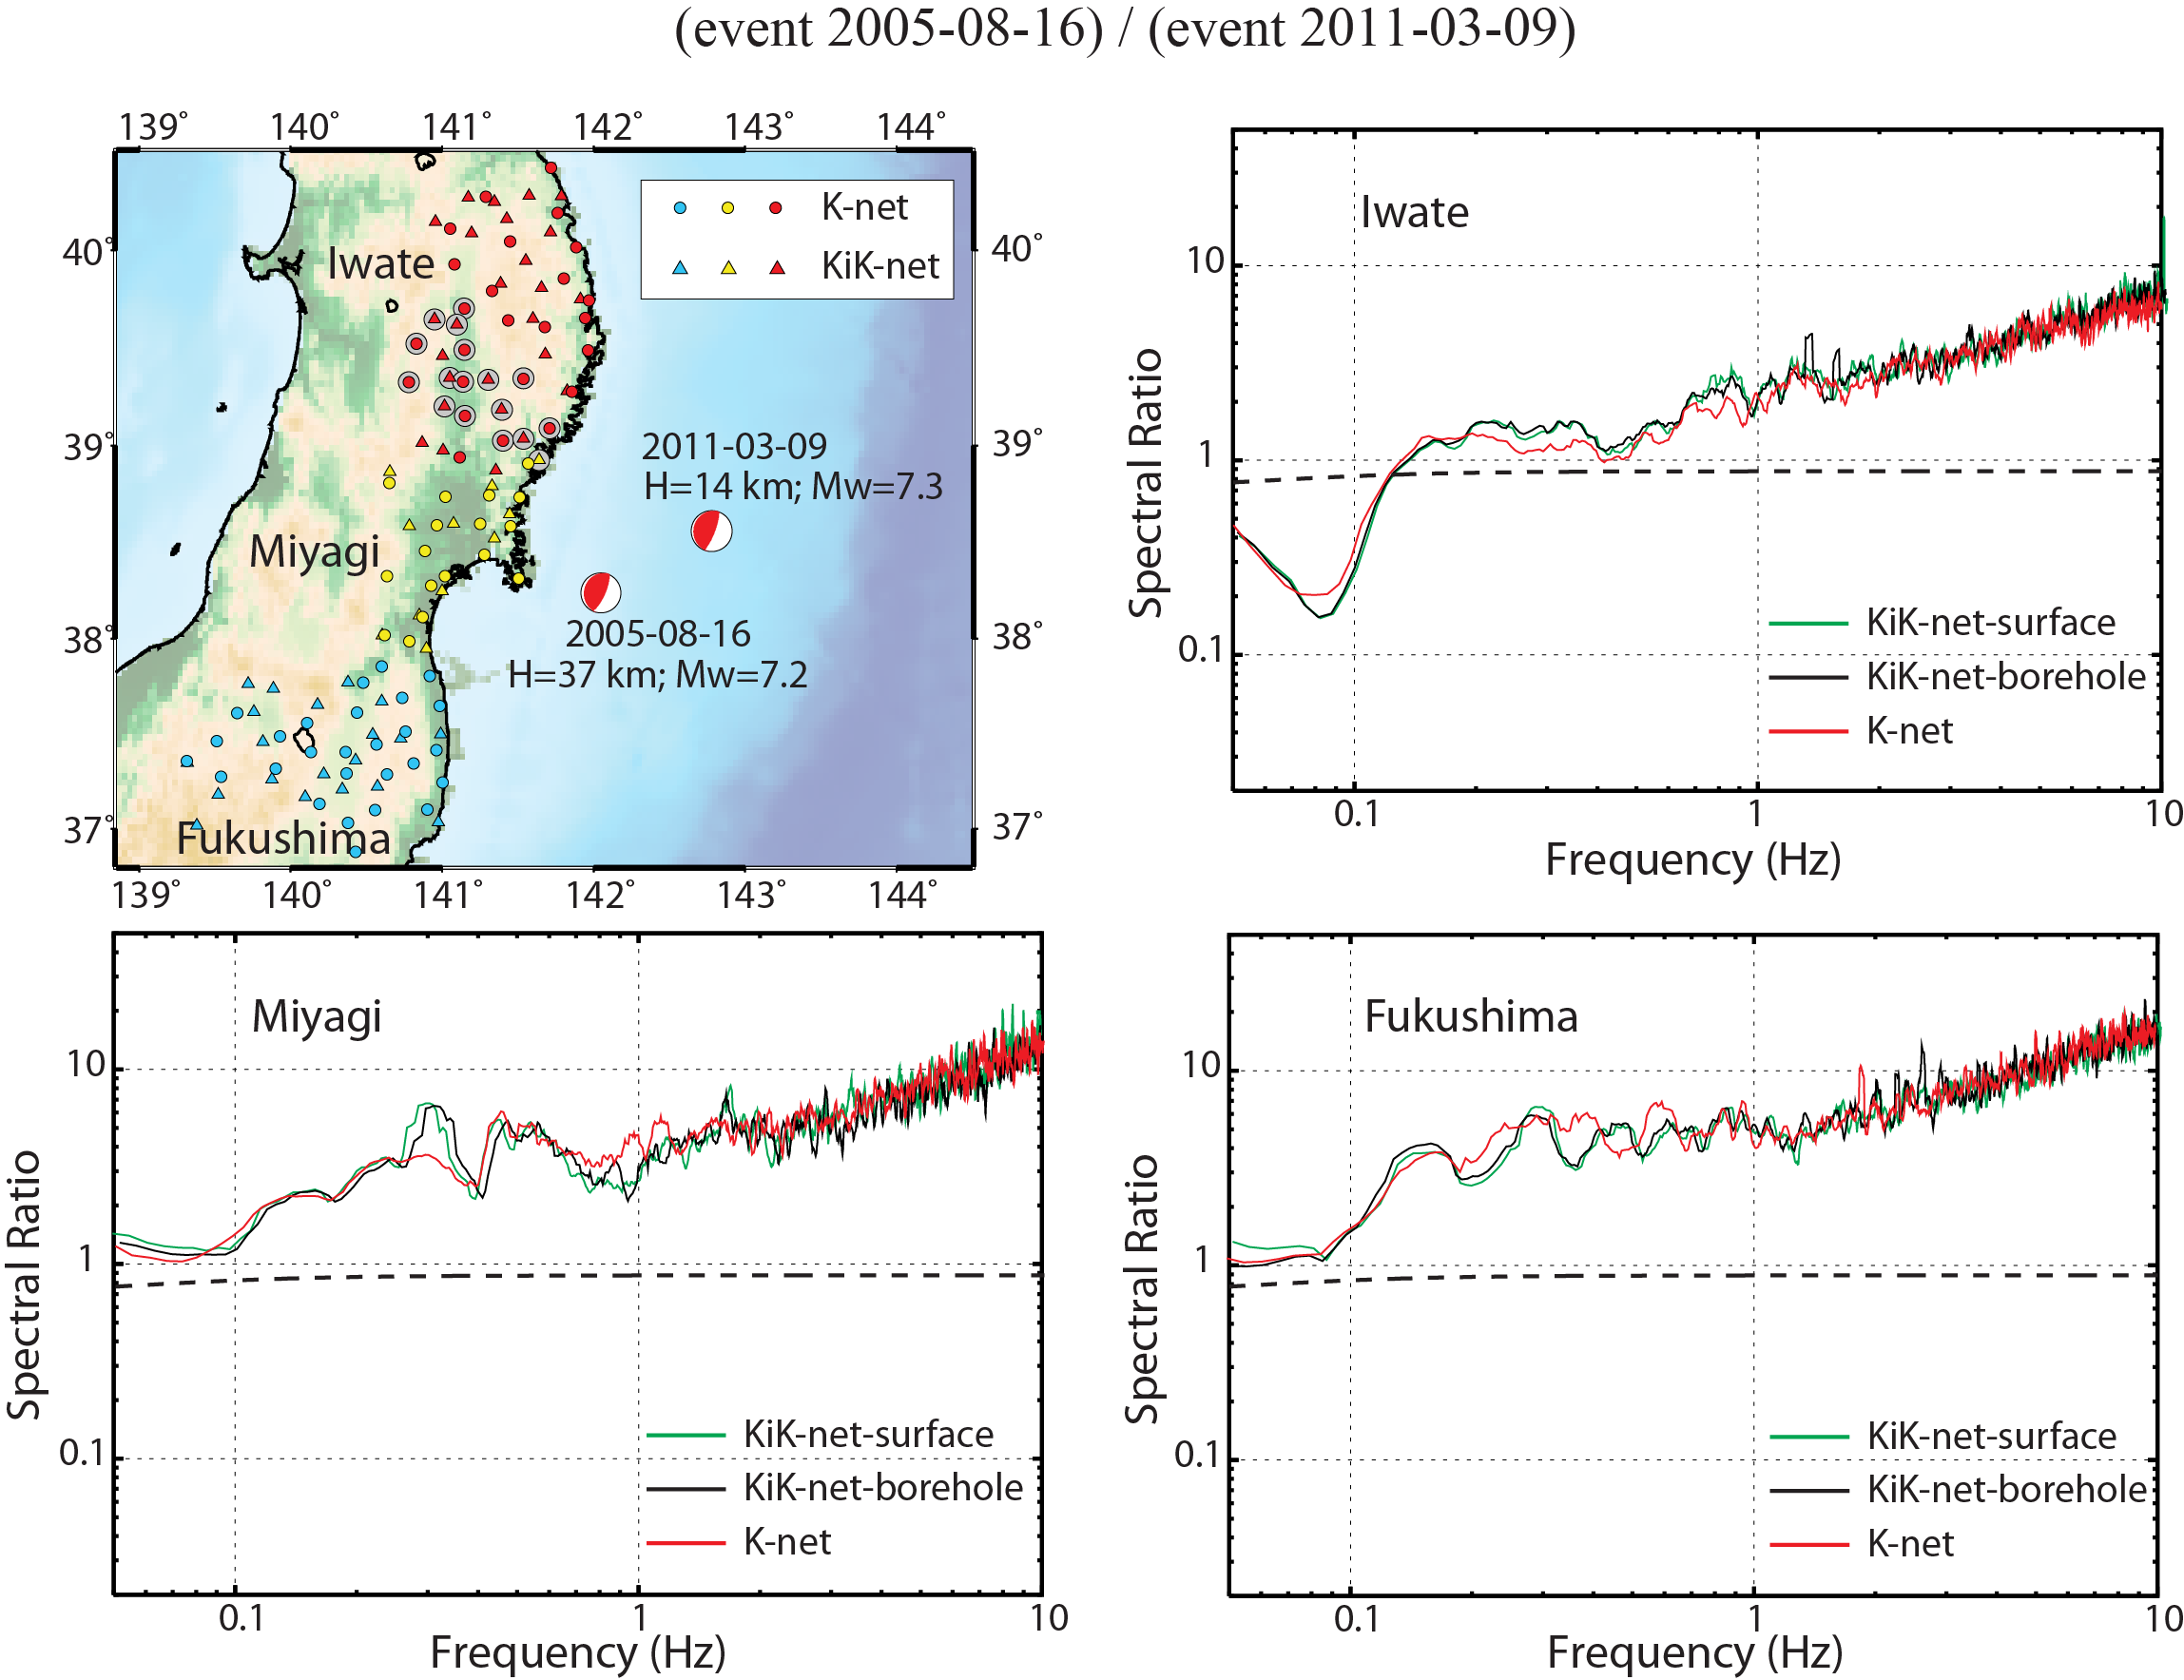
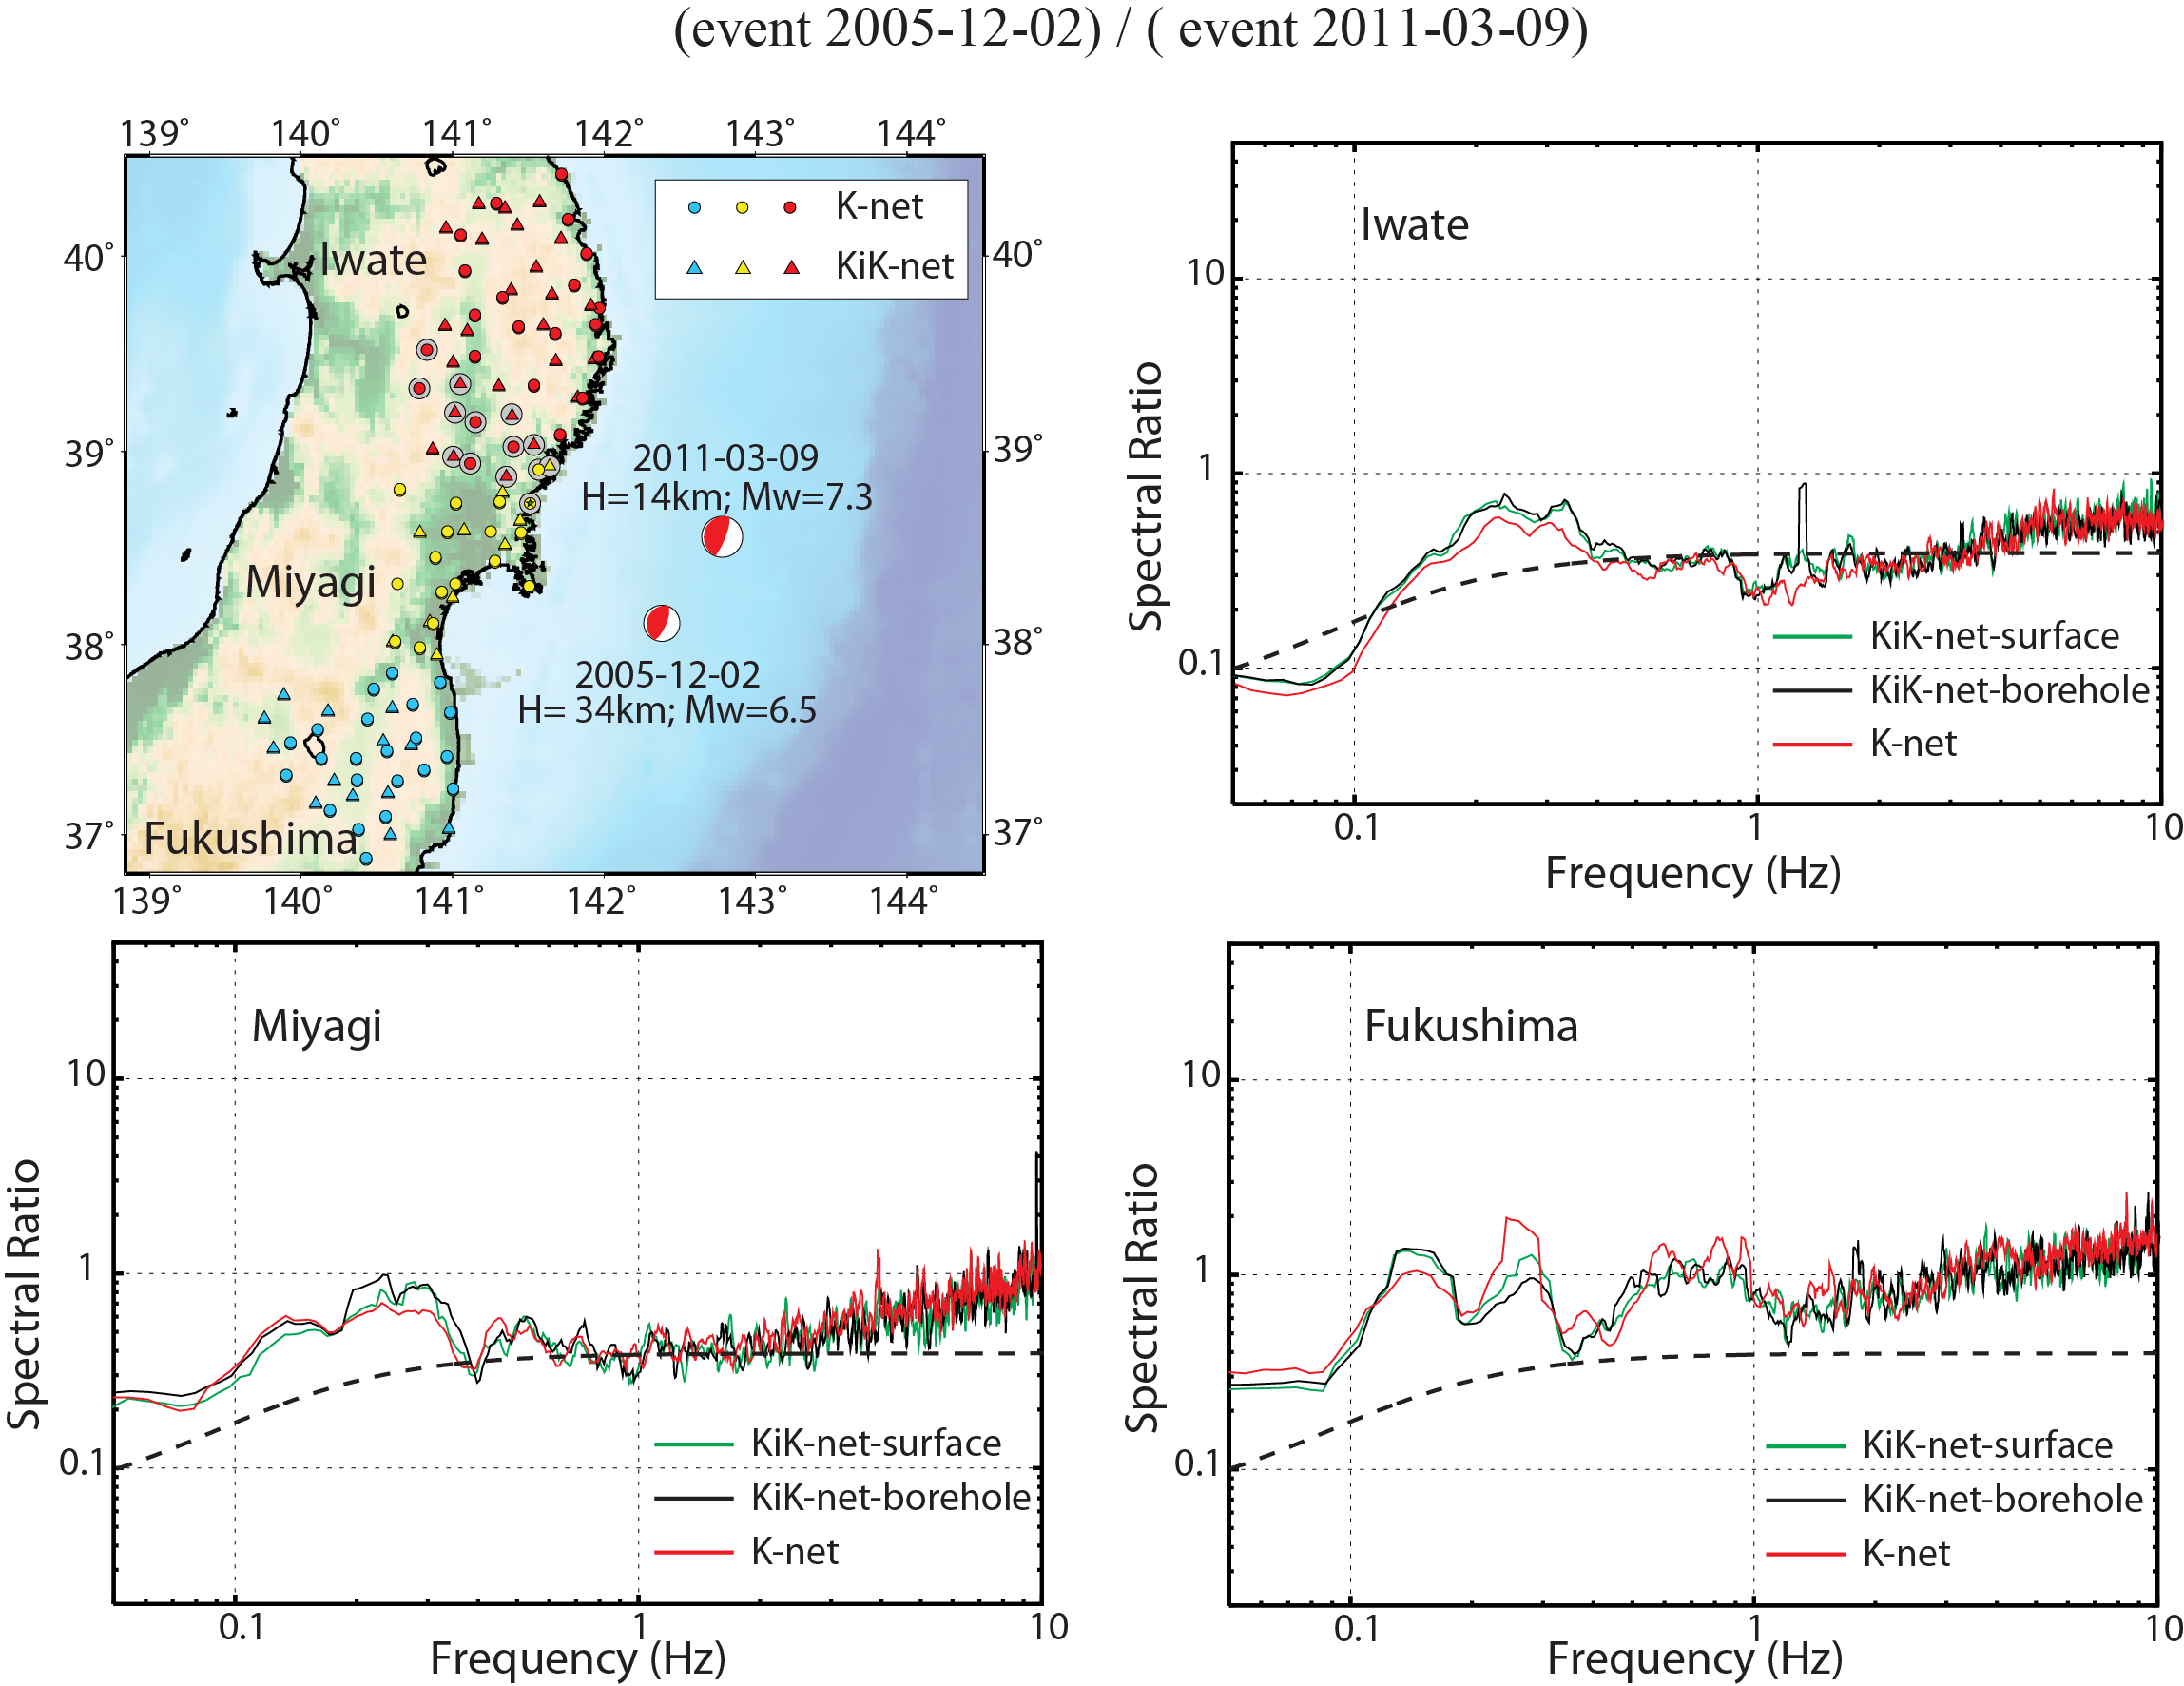
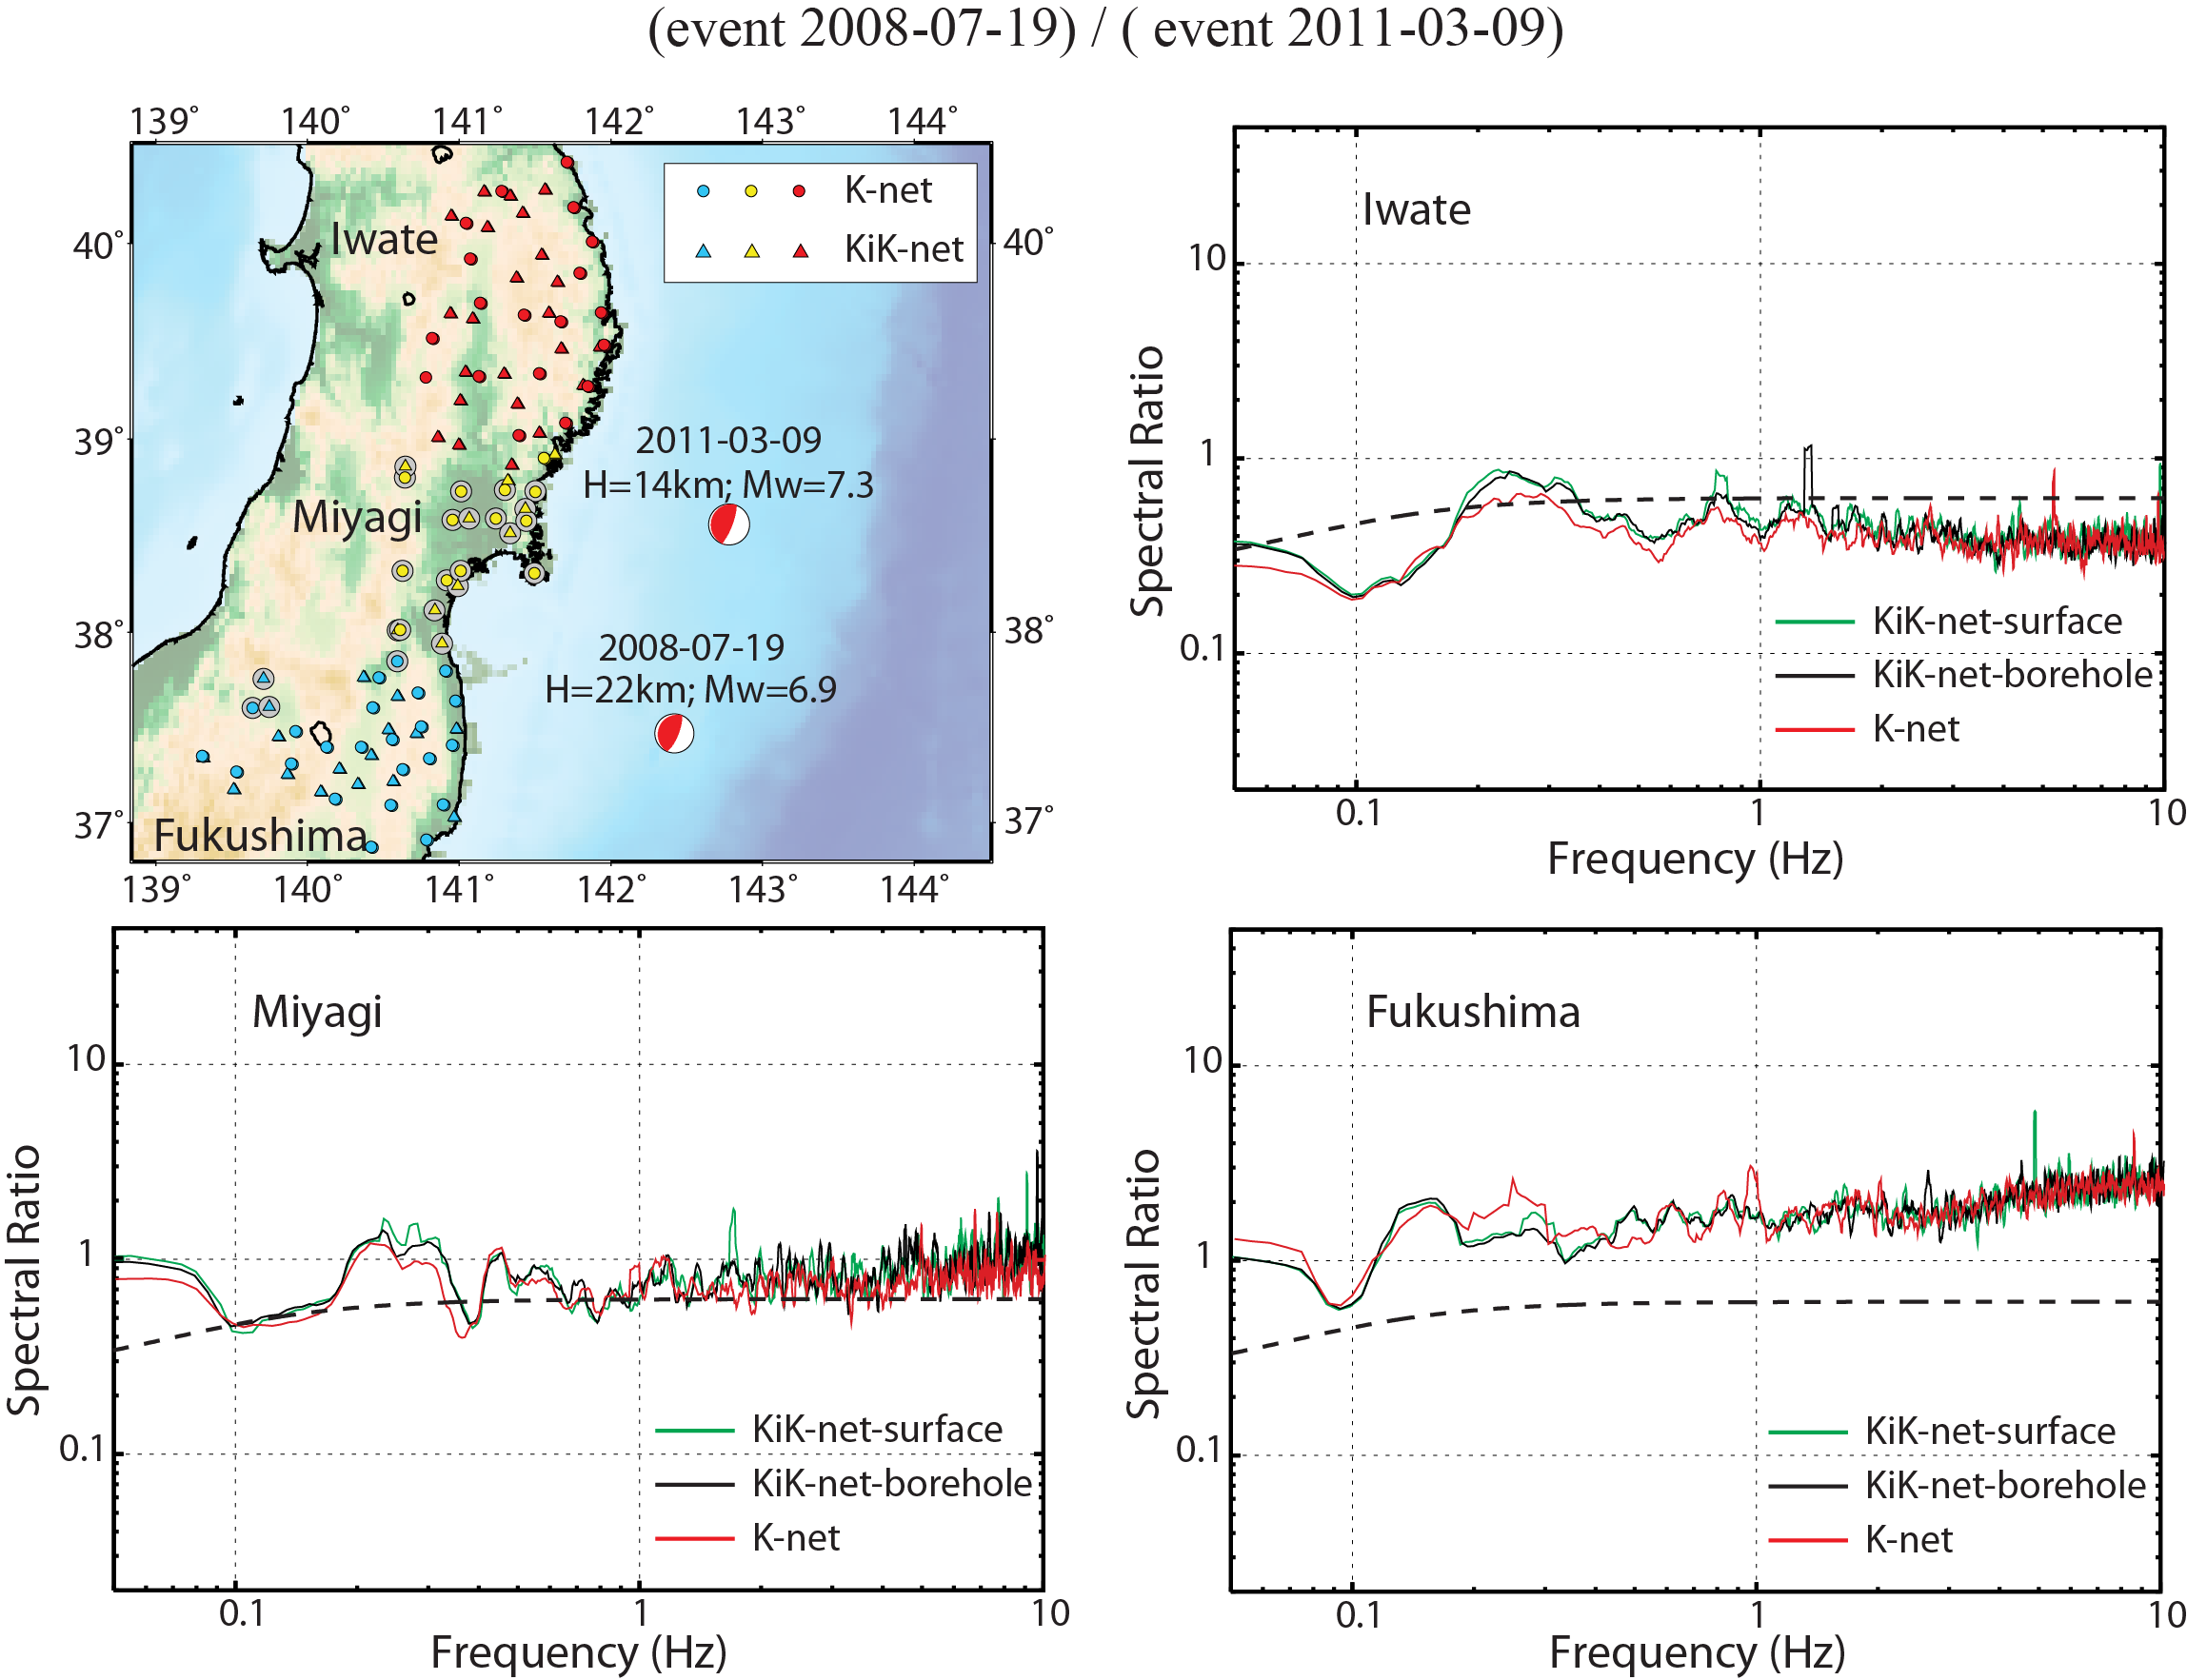
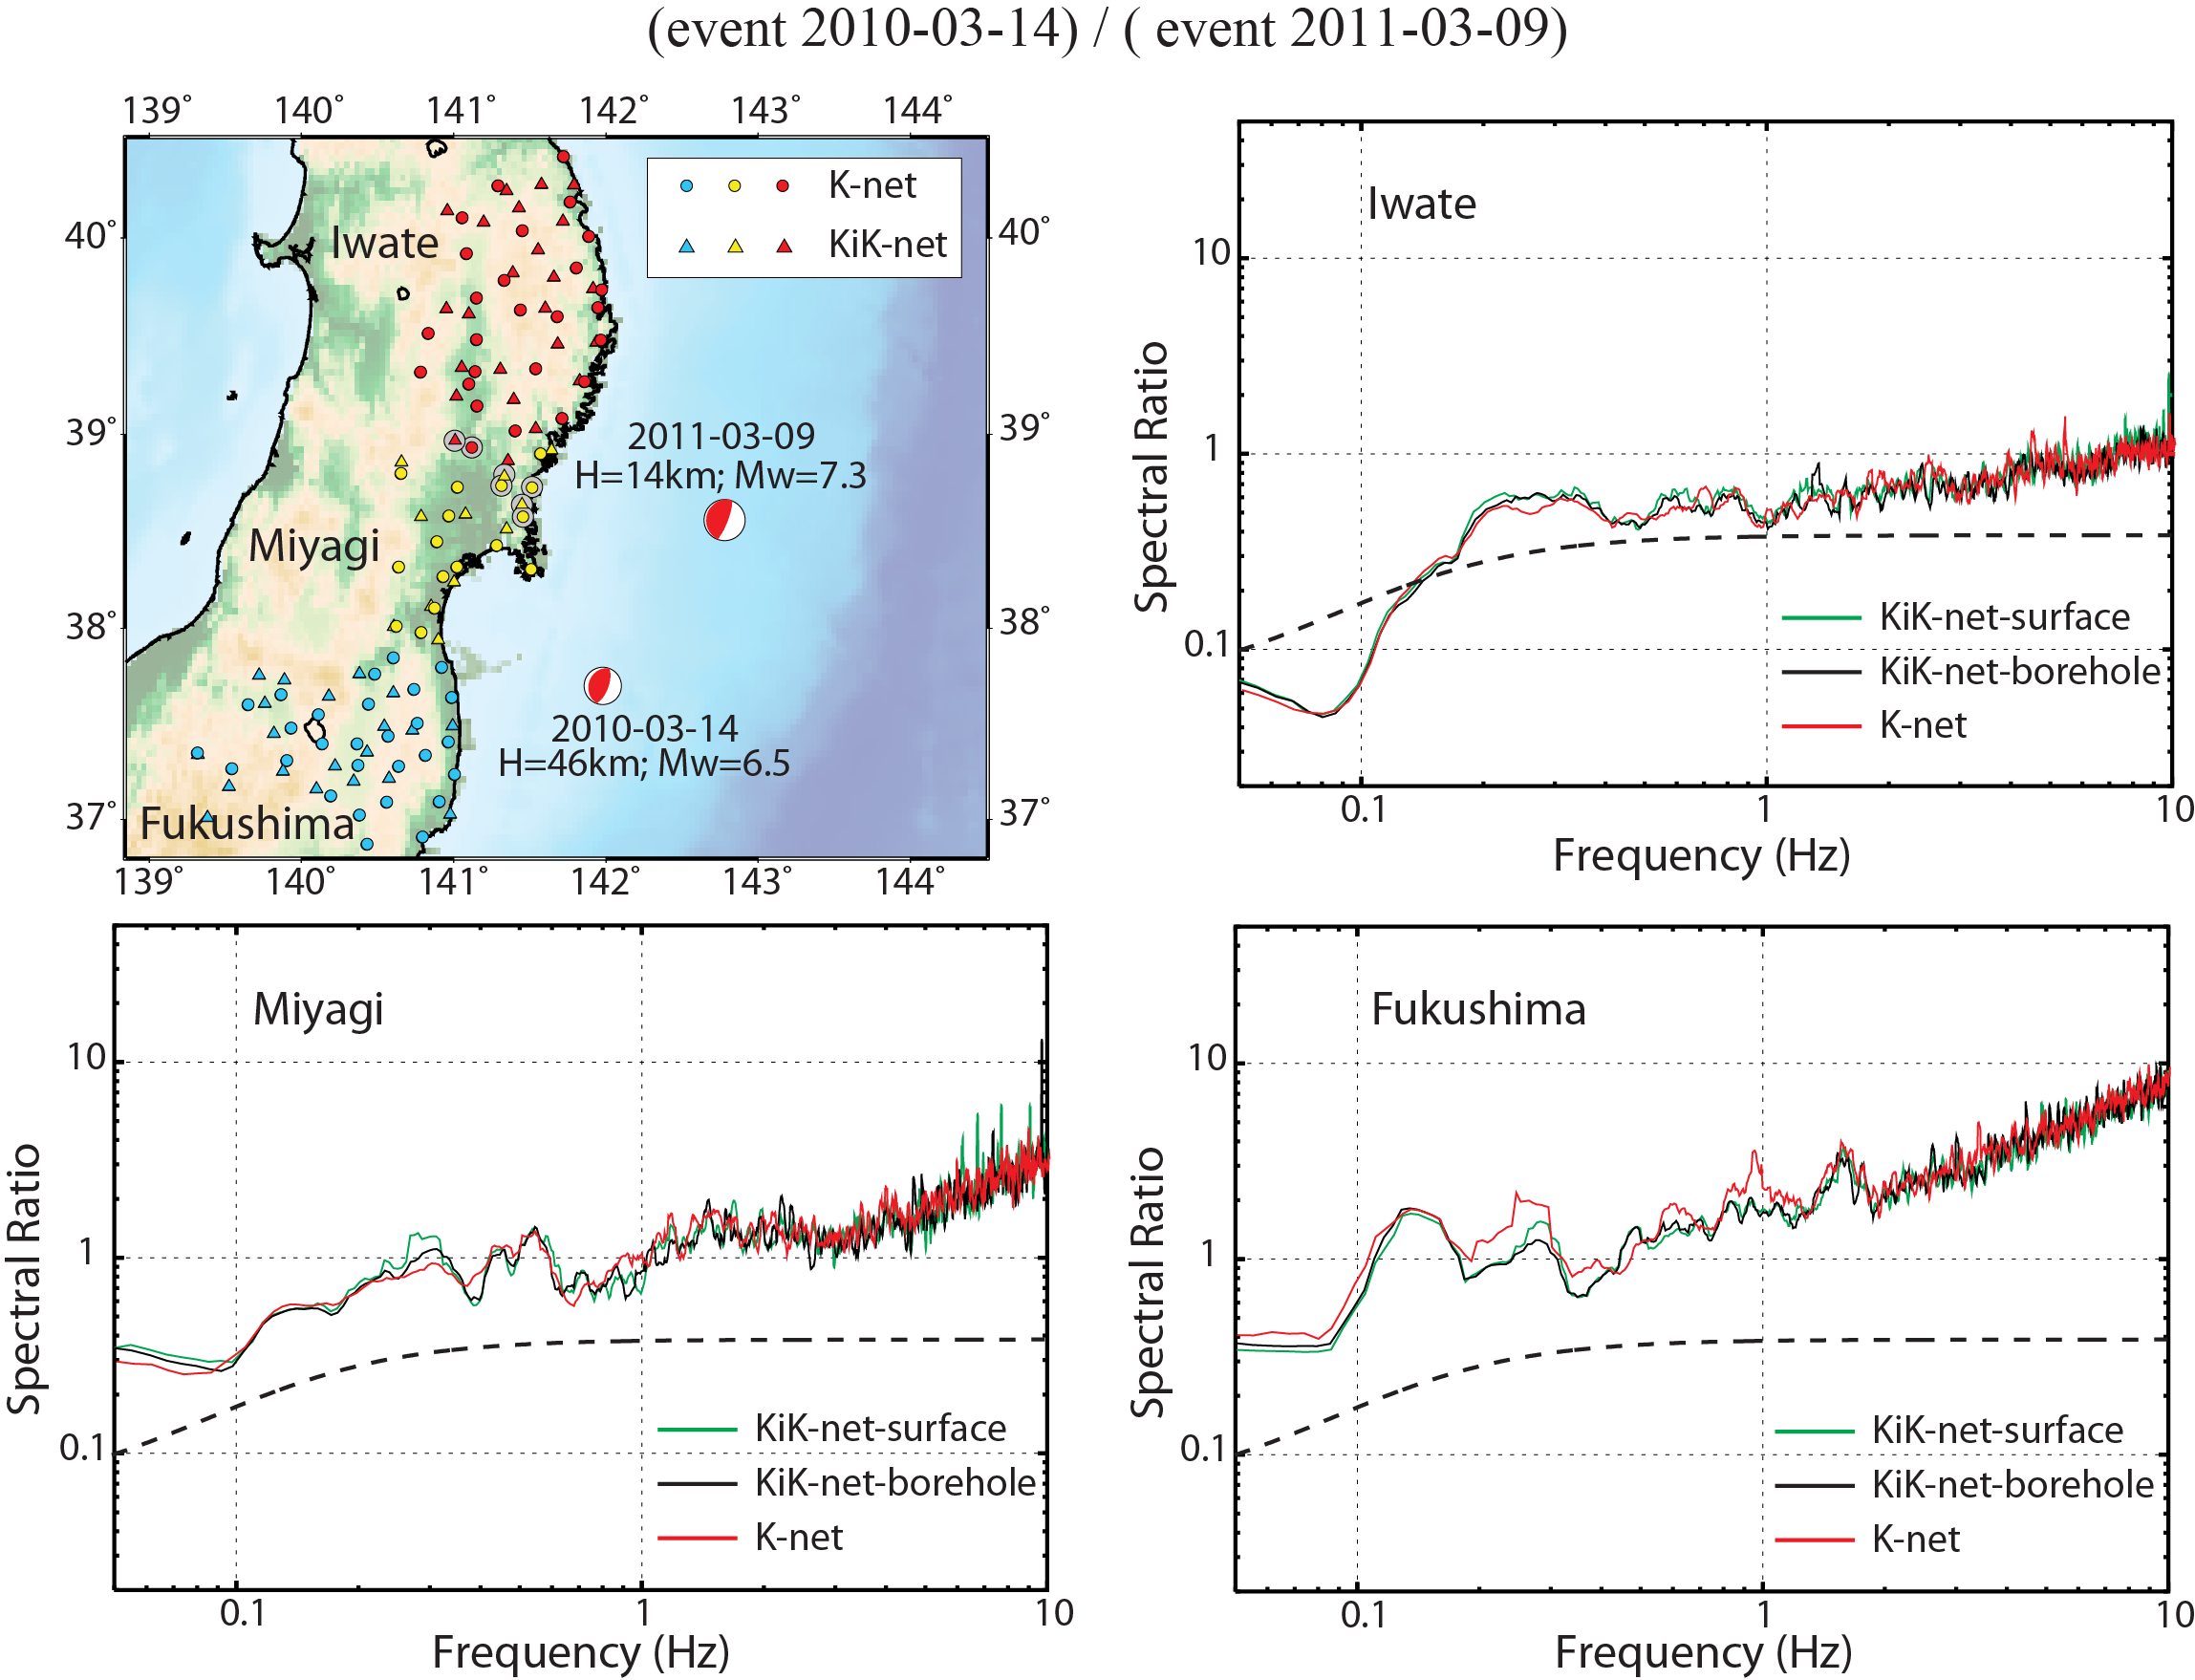
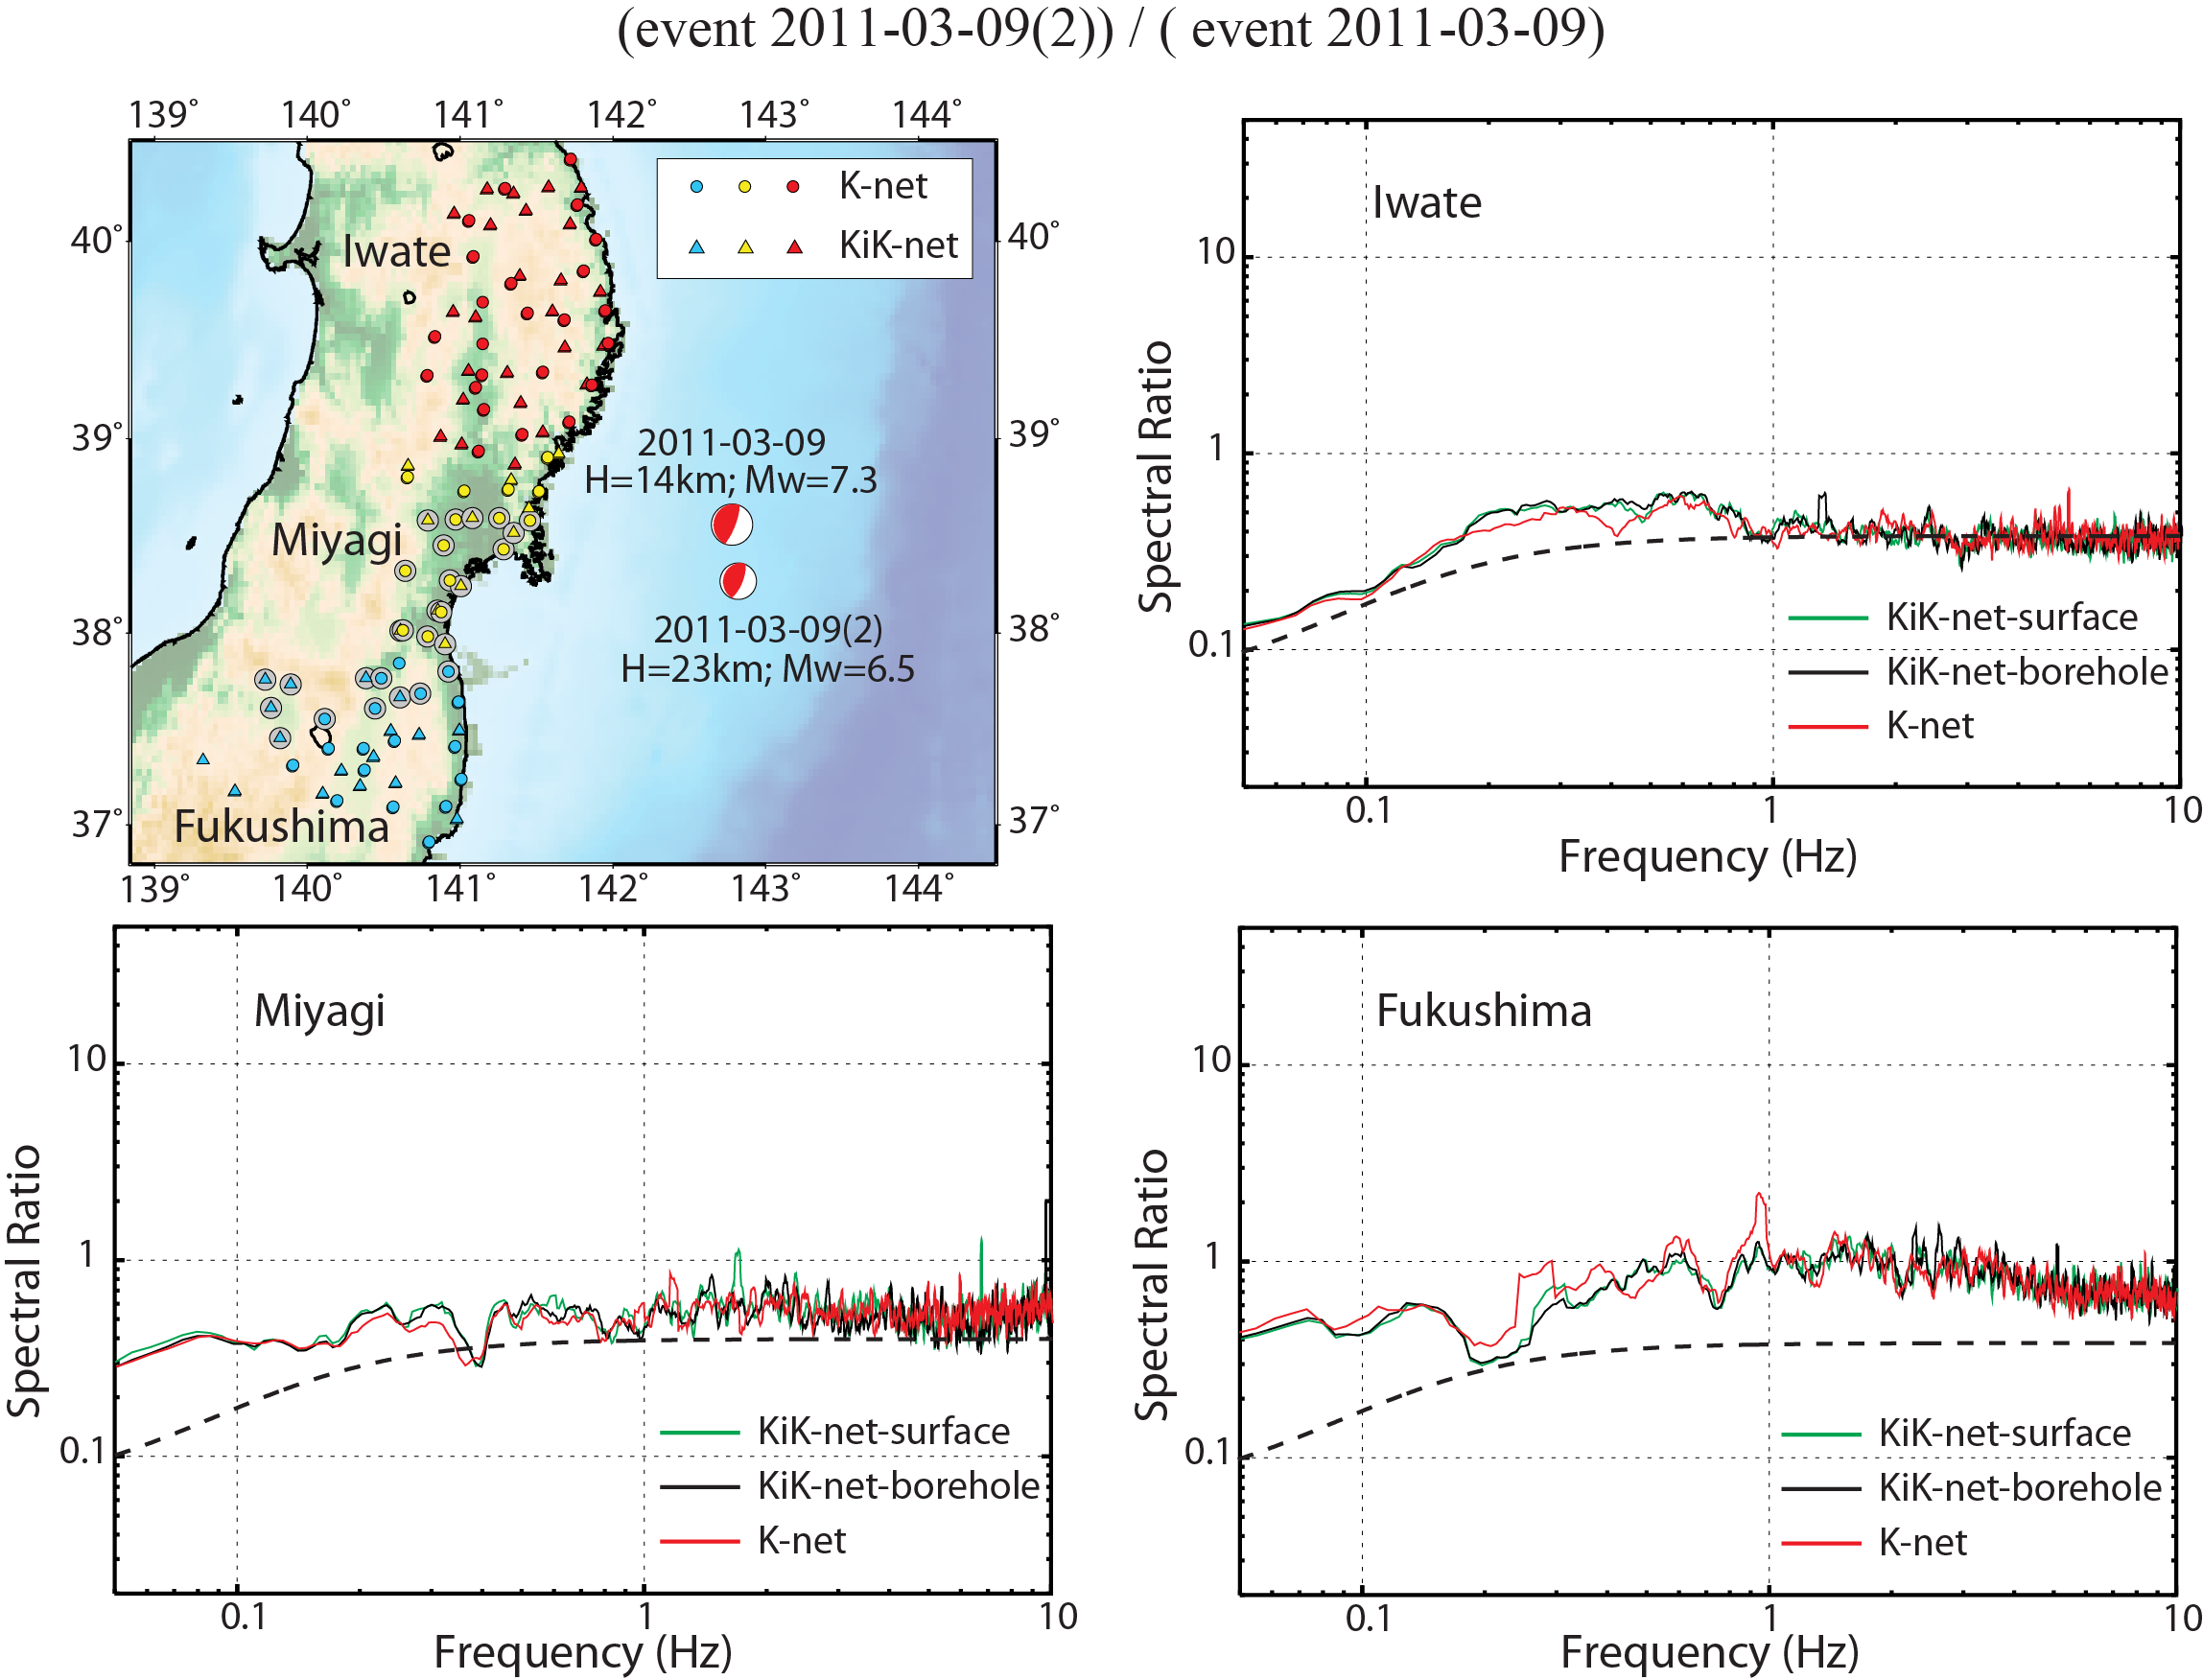
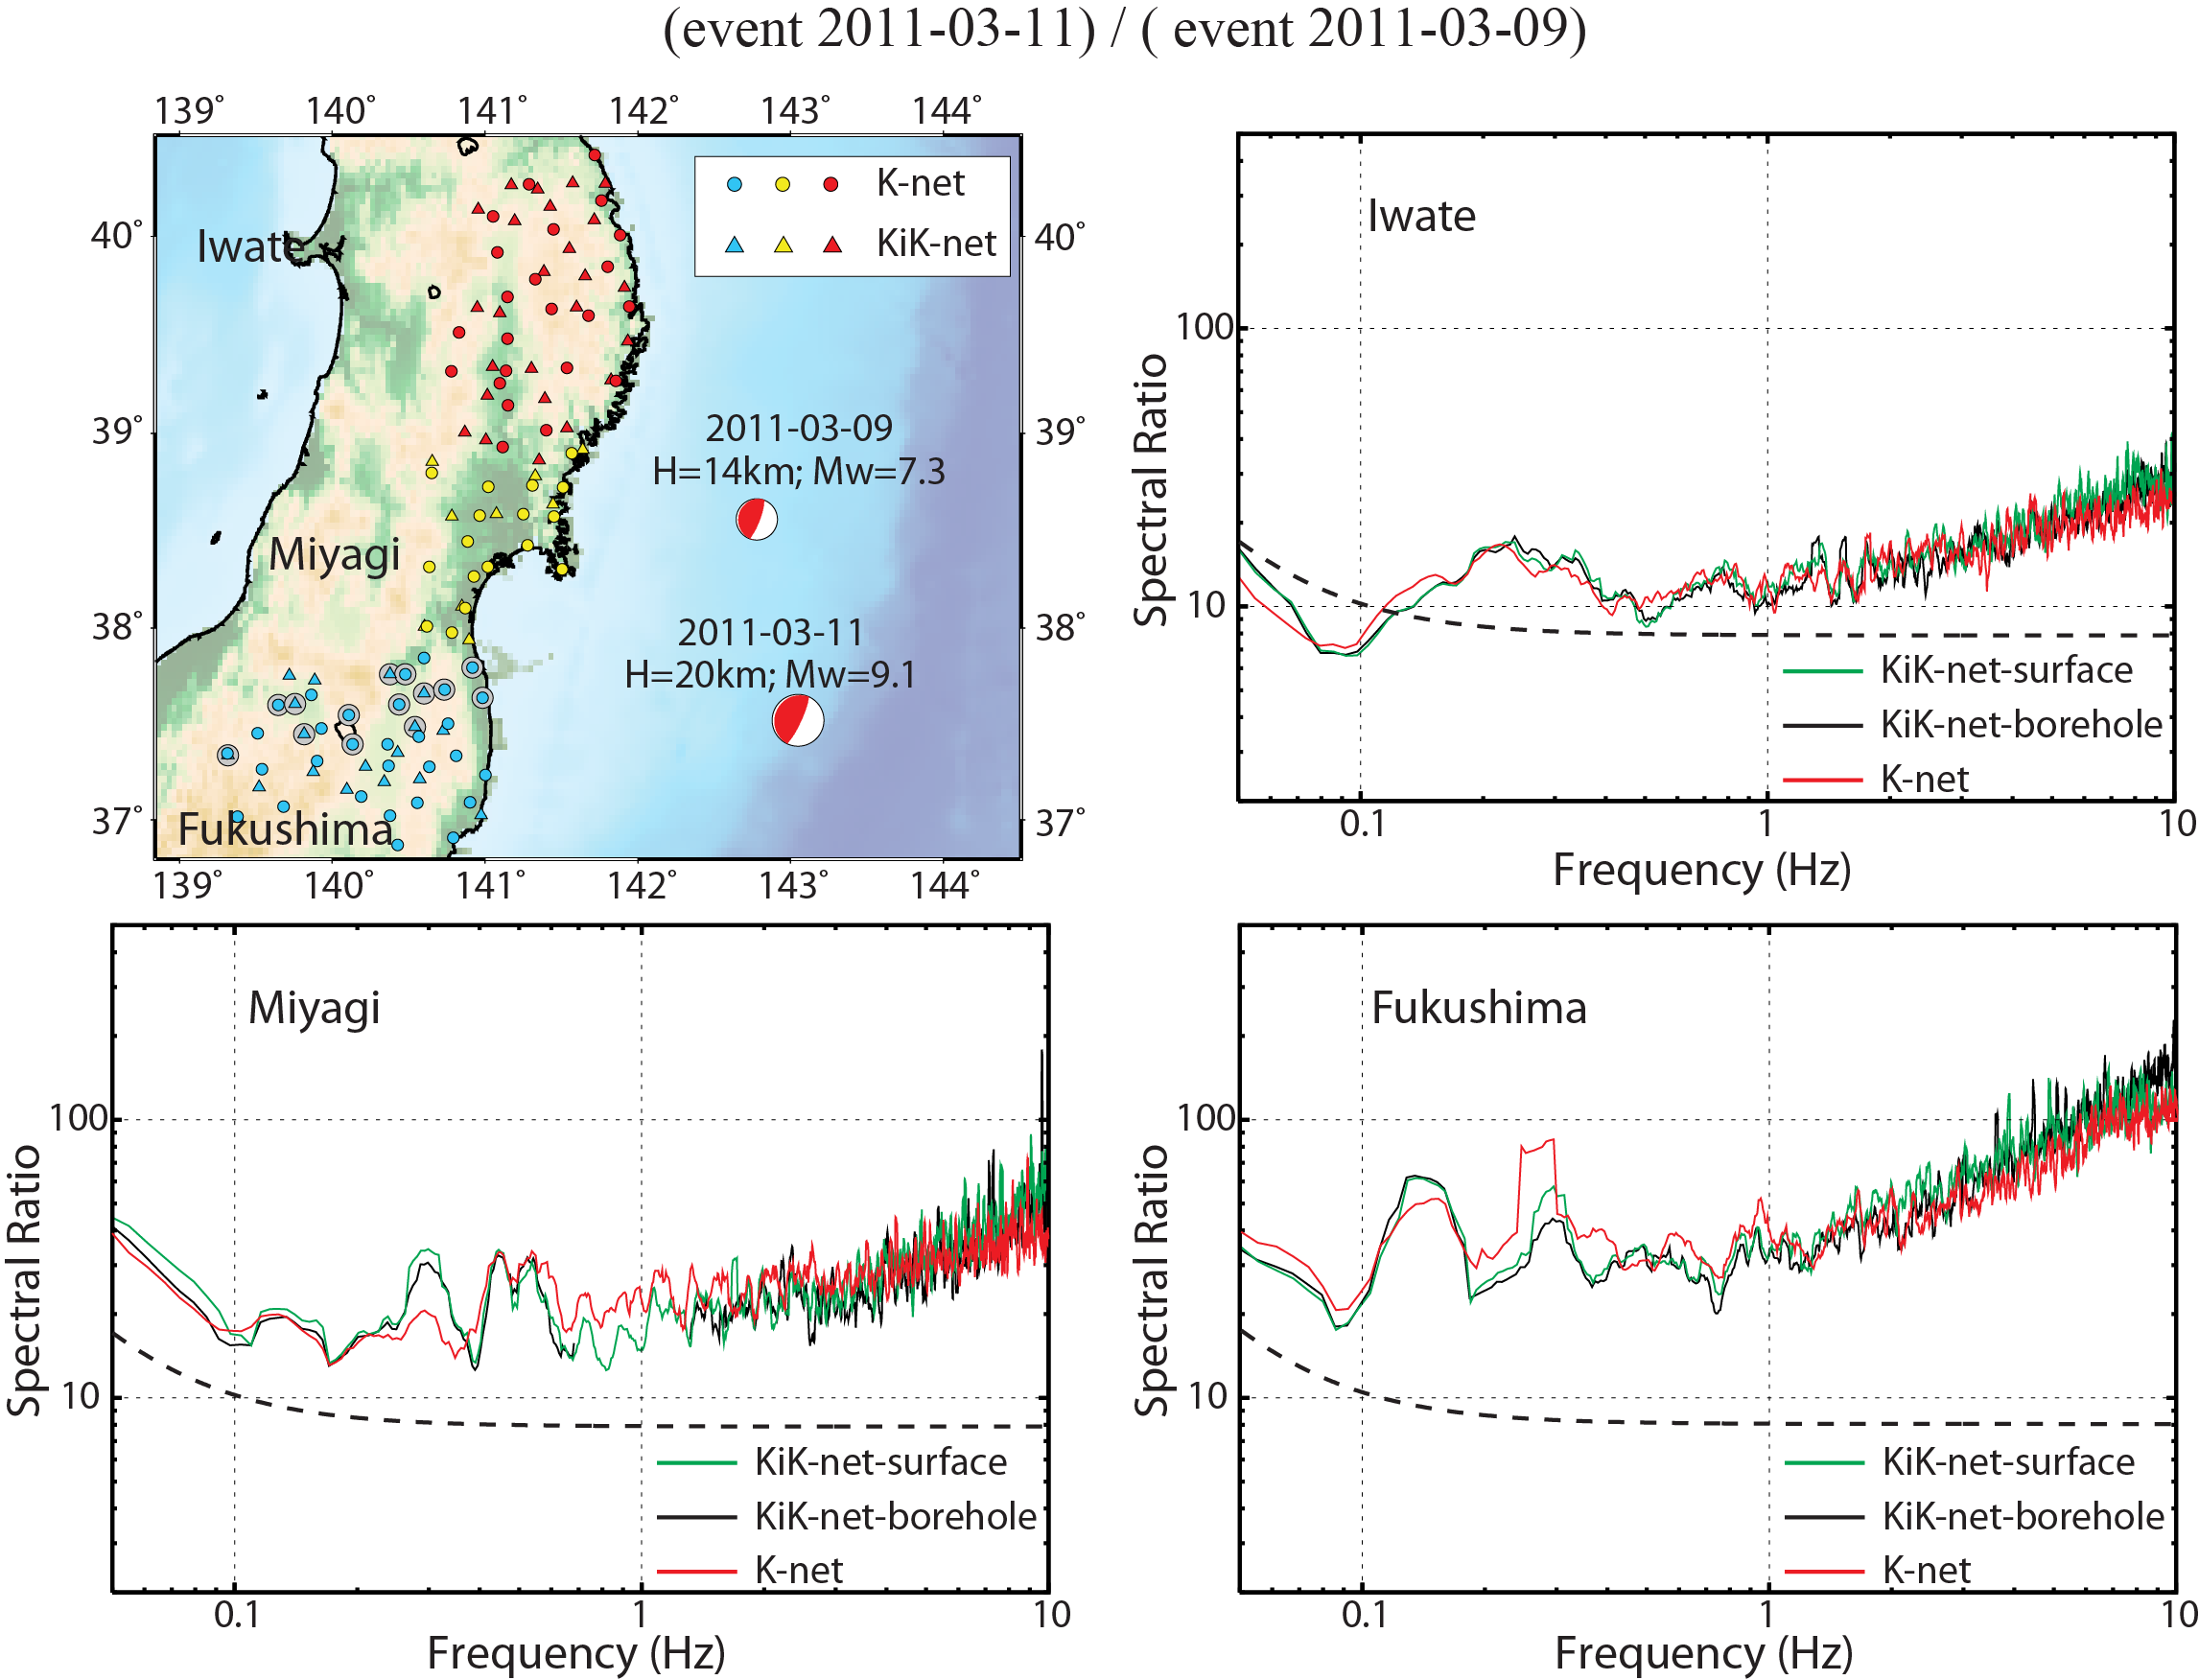
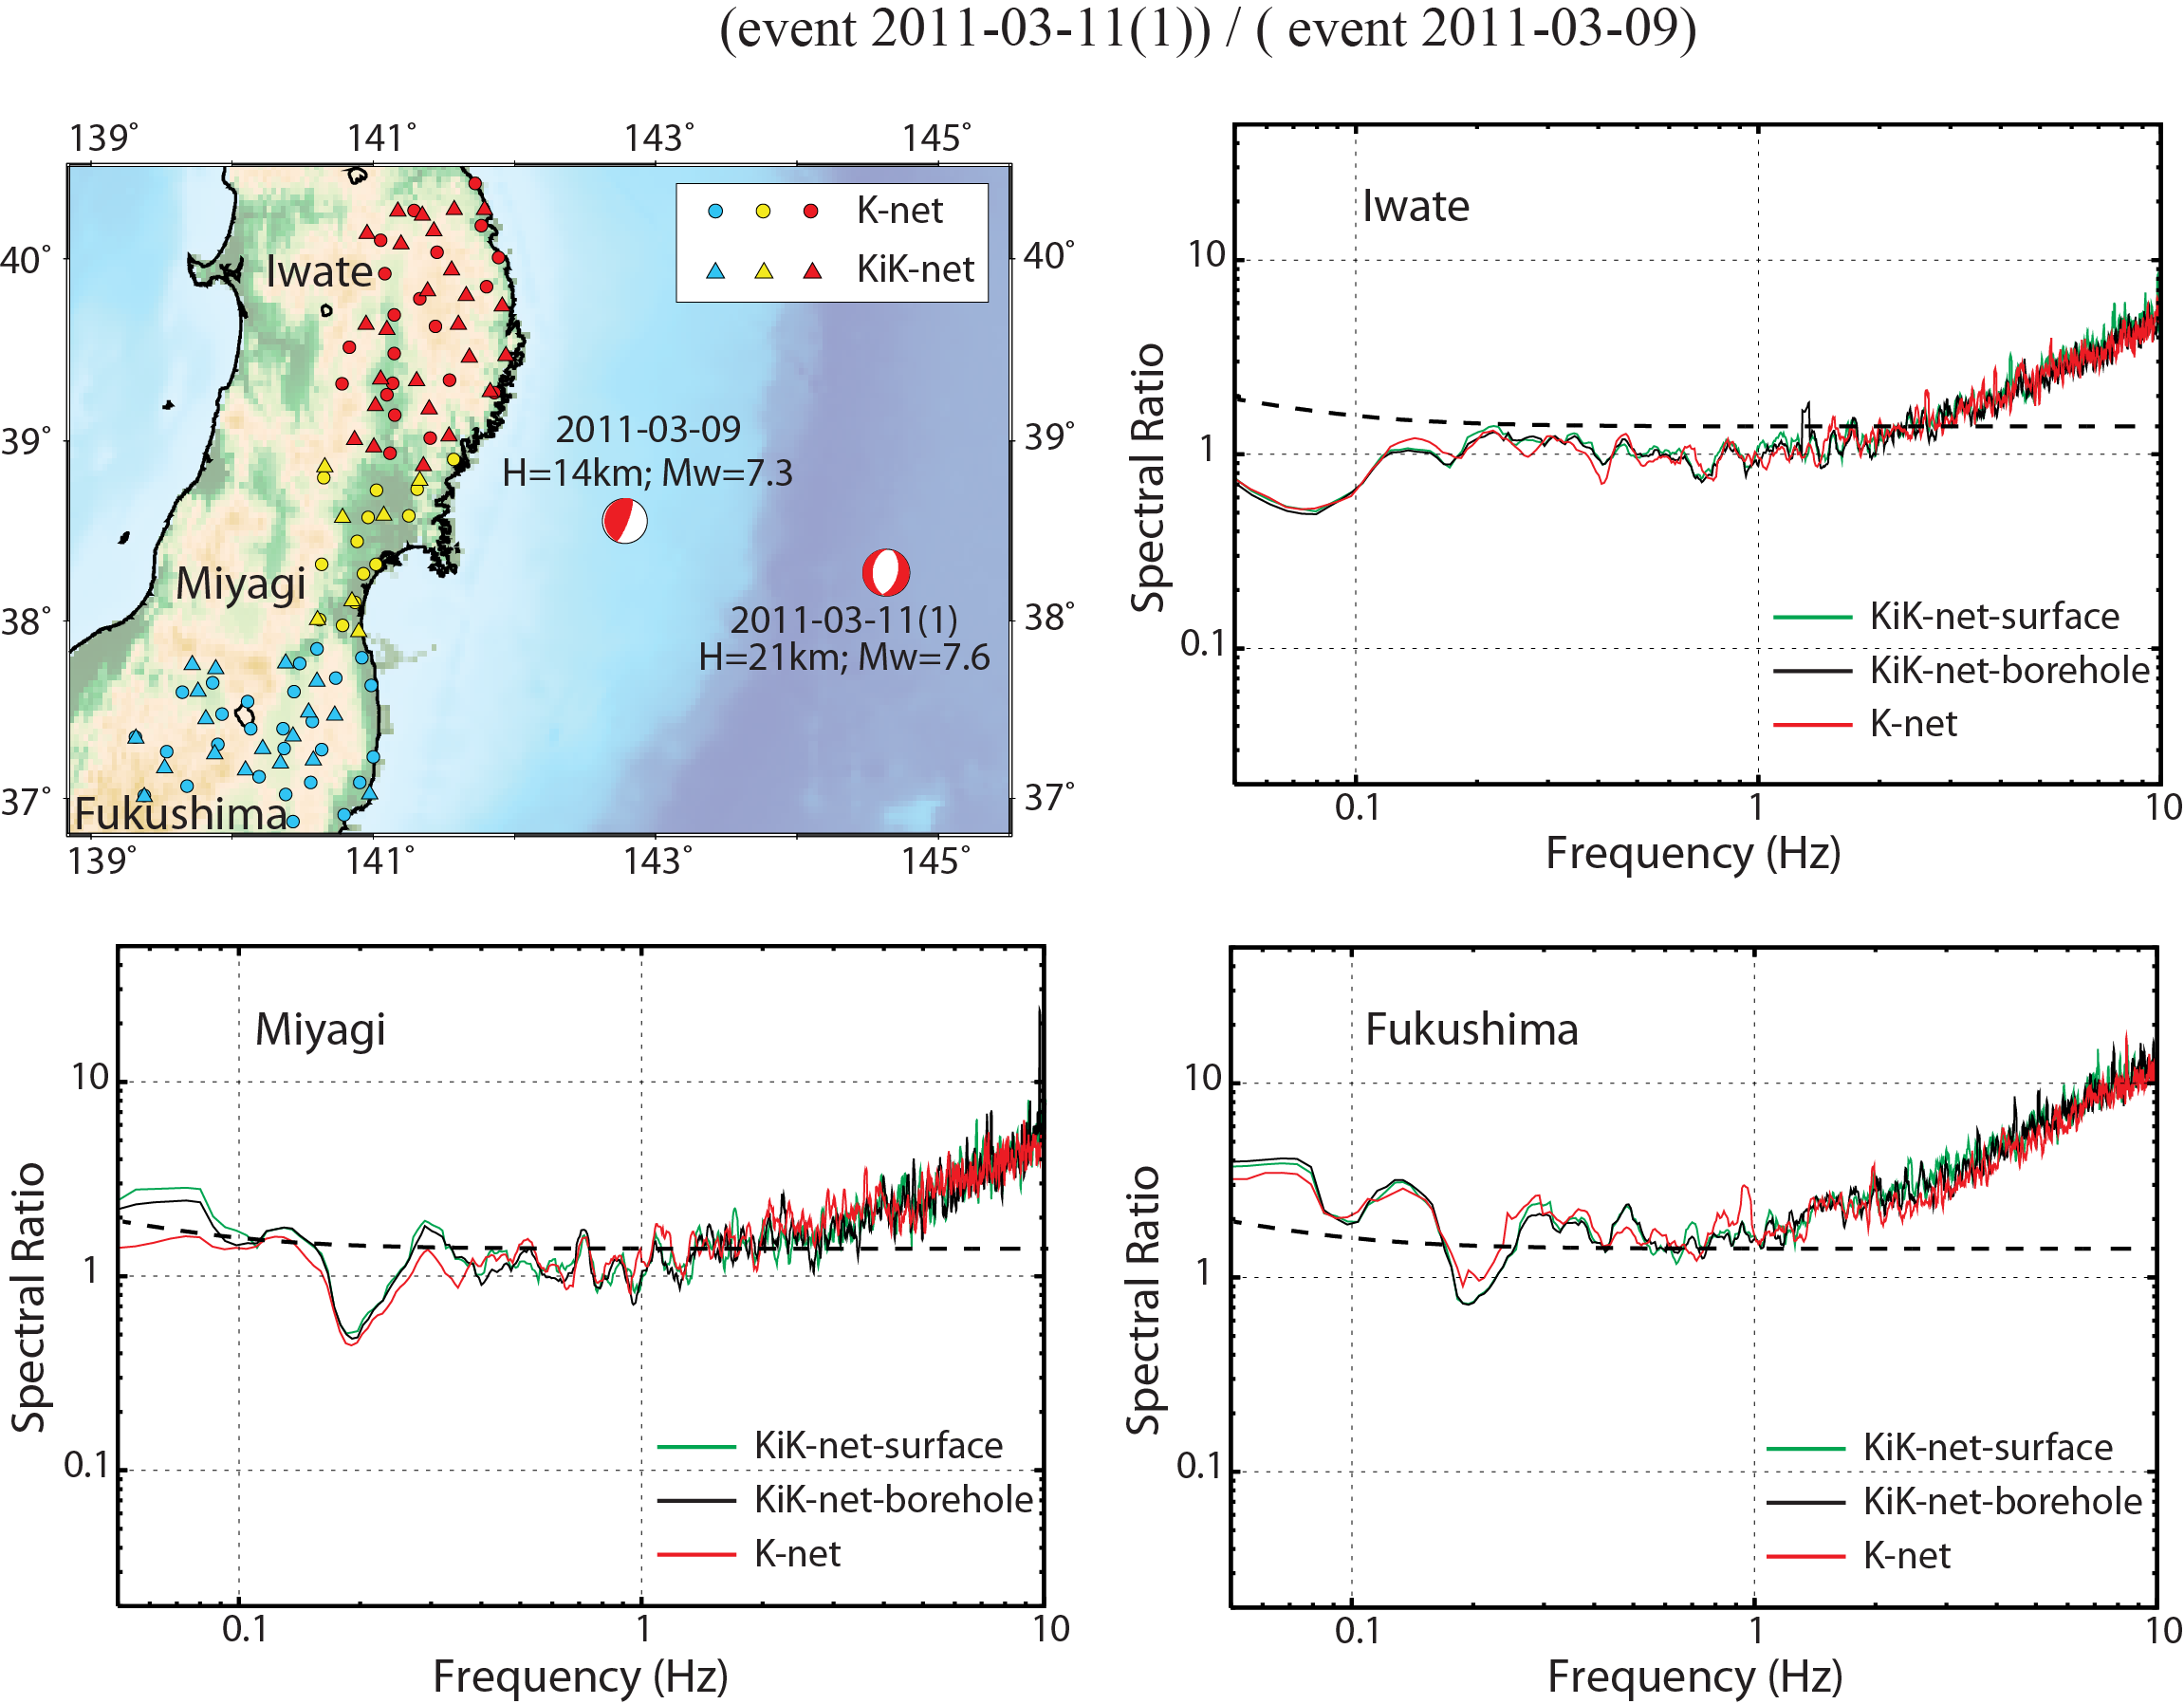
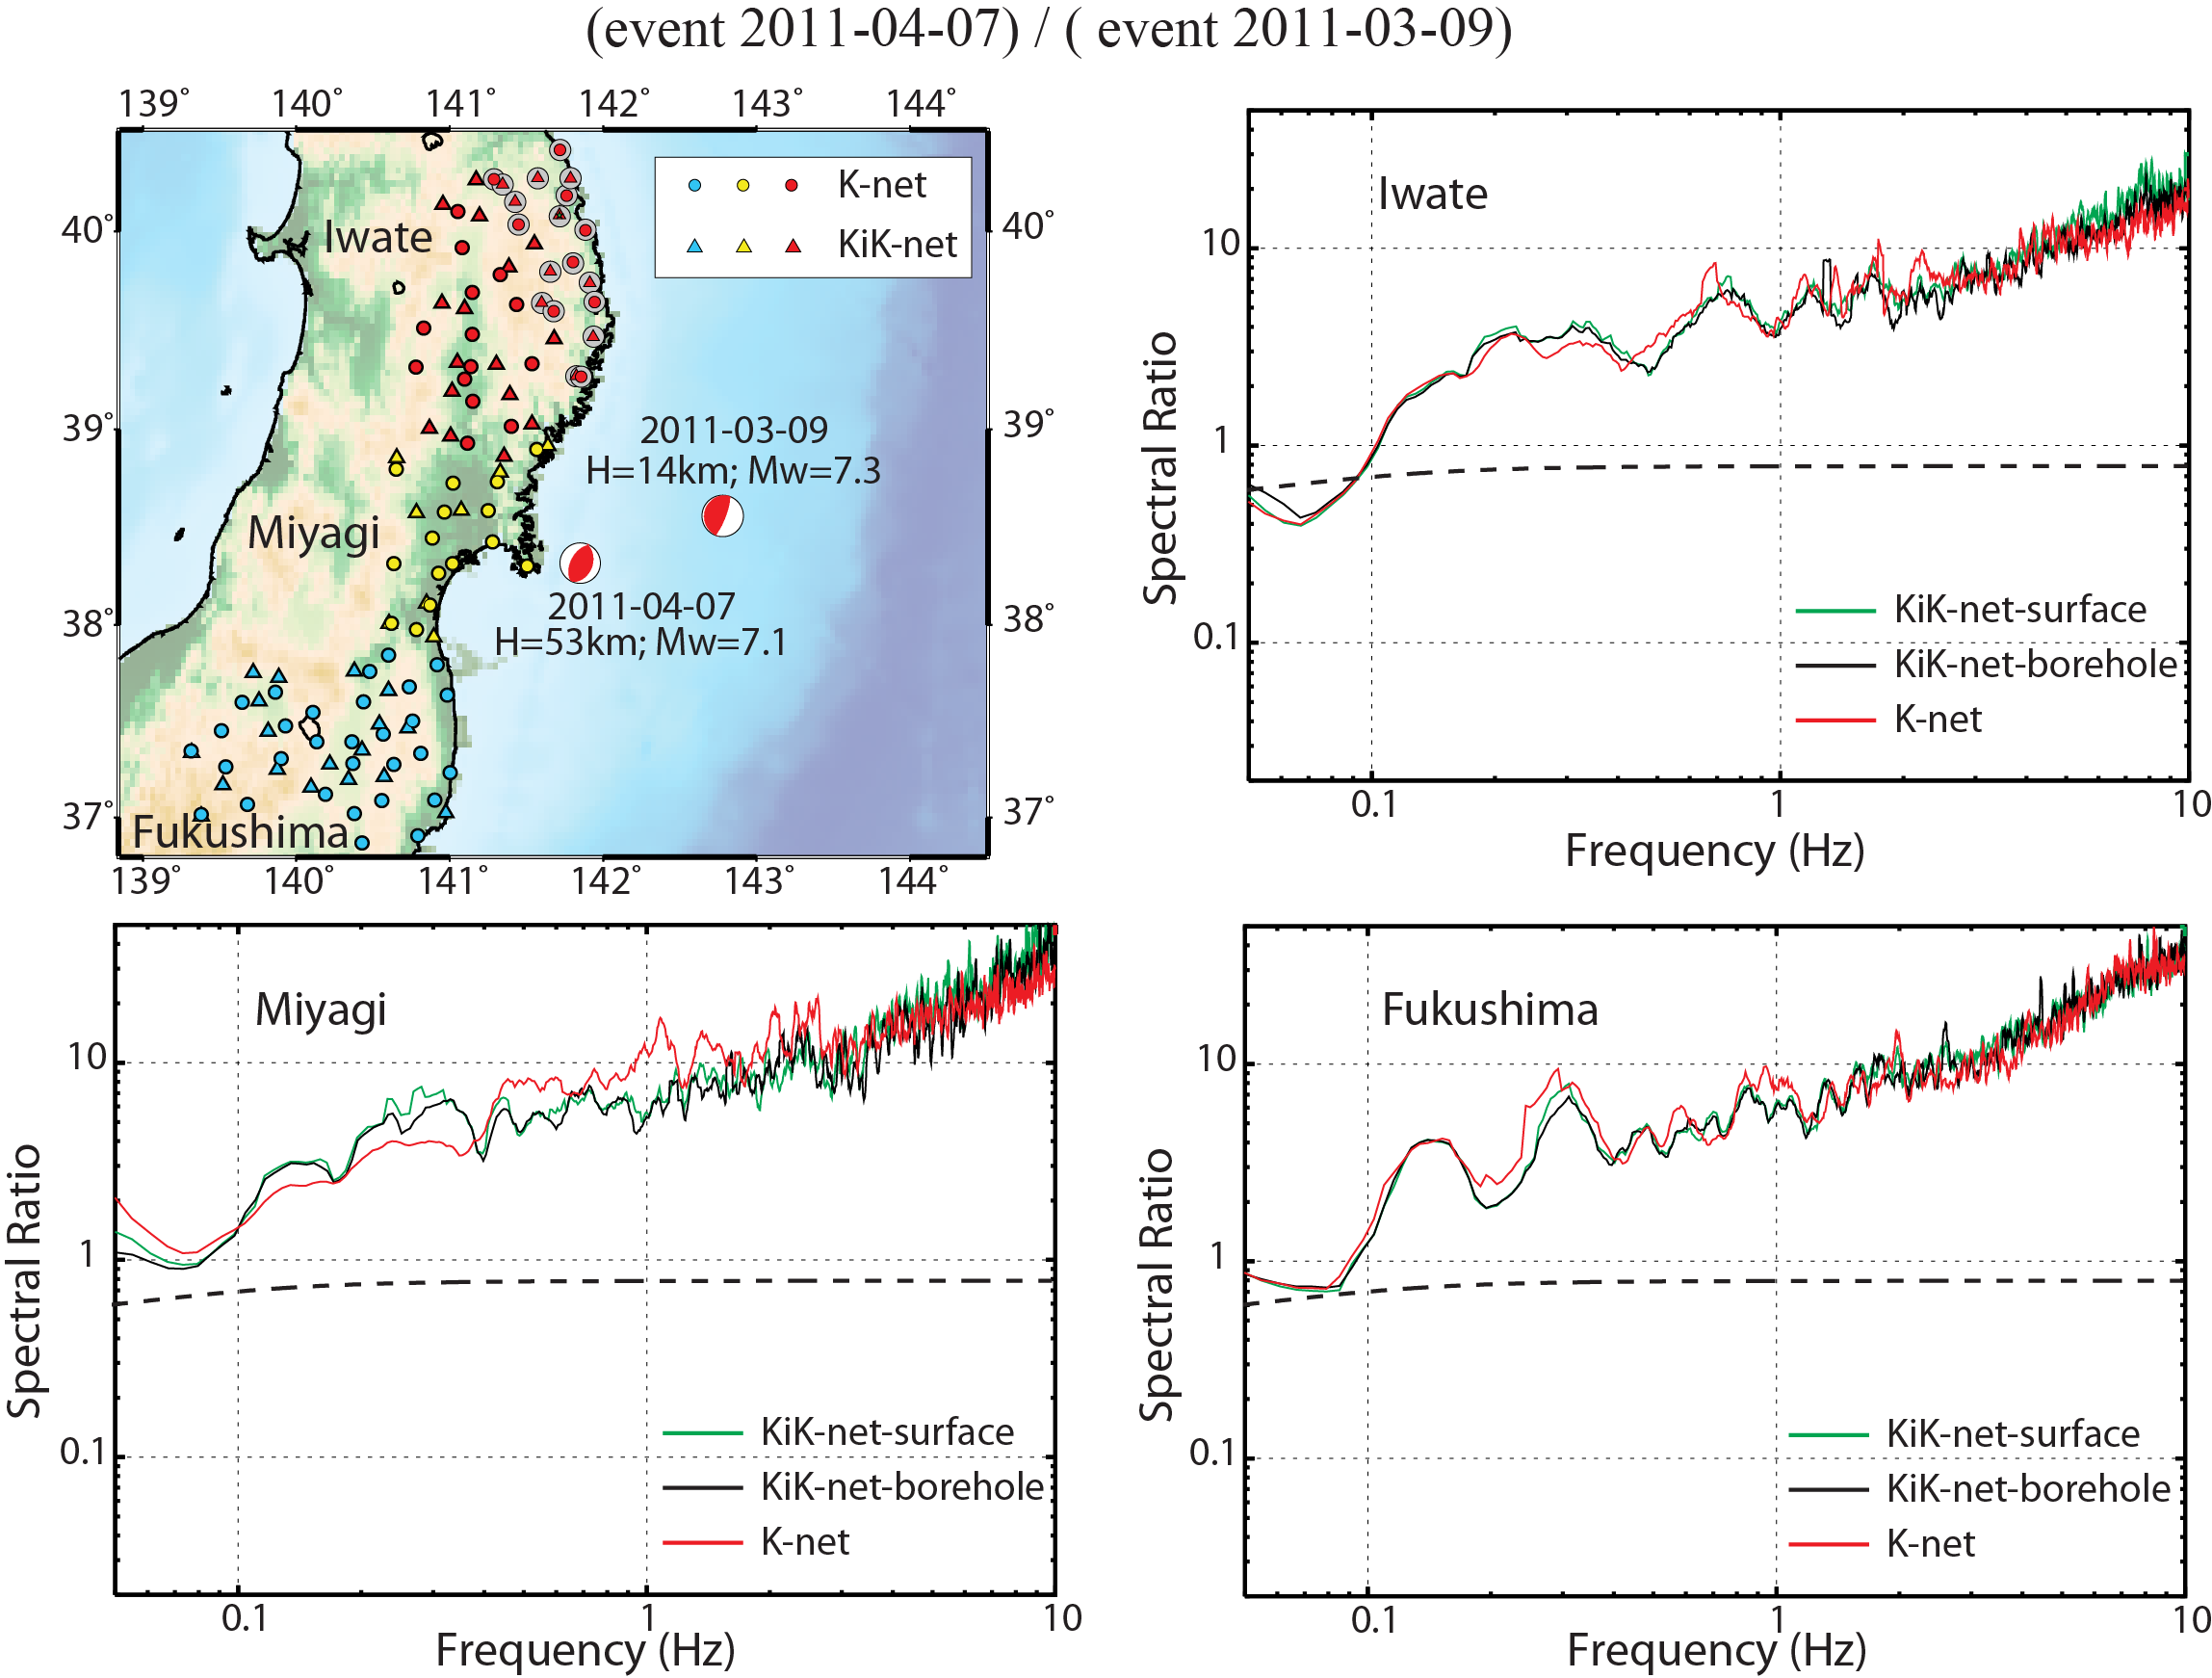
Spectral ratios relative to the foreshock of 2011-03-09 from K-net and Kik-net strong motion sensors in Iwate, Miyagi, and Fukushima prefectures (map). The stacked, smoothed spectral ratios from all three components of recorded ground accelerations over 100 s windows are shown, with separate averaged computed for K-net and KiK-net observations. The gray circles show the sensors with common path lengths from sources and receivers (within 10 km) used for spectral ratios calculation in Figure 2. The dashed curves show the spectral ratios for the reference 3 MPa Brune ω-2 source models.
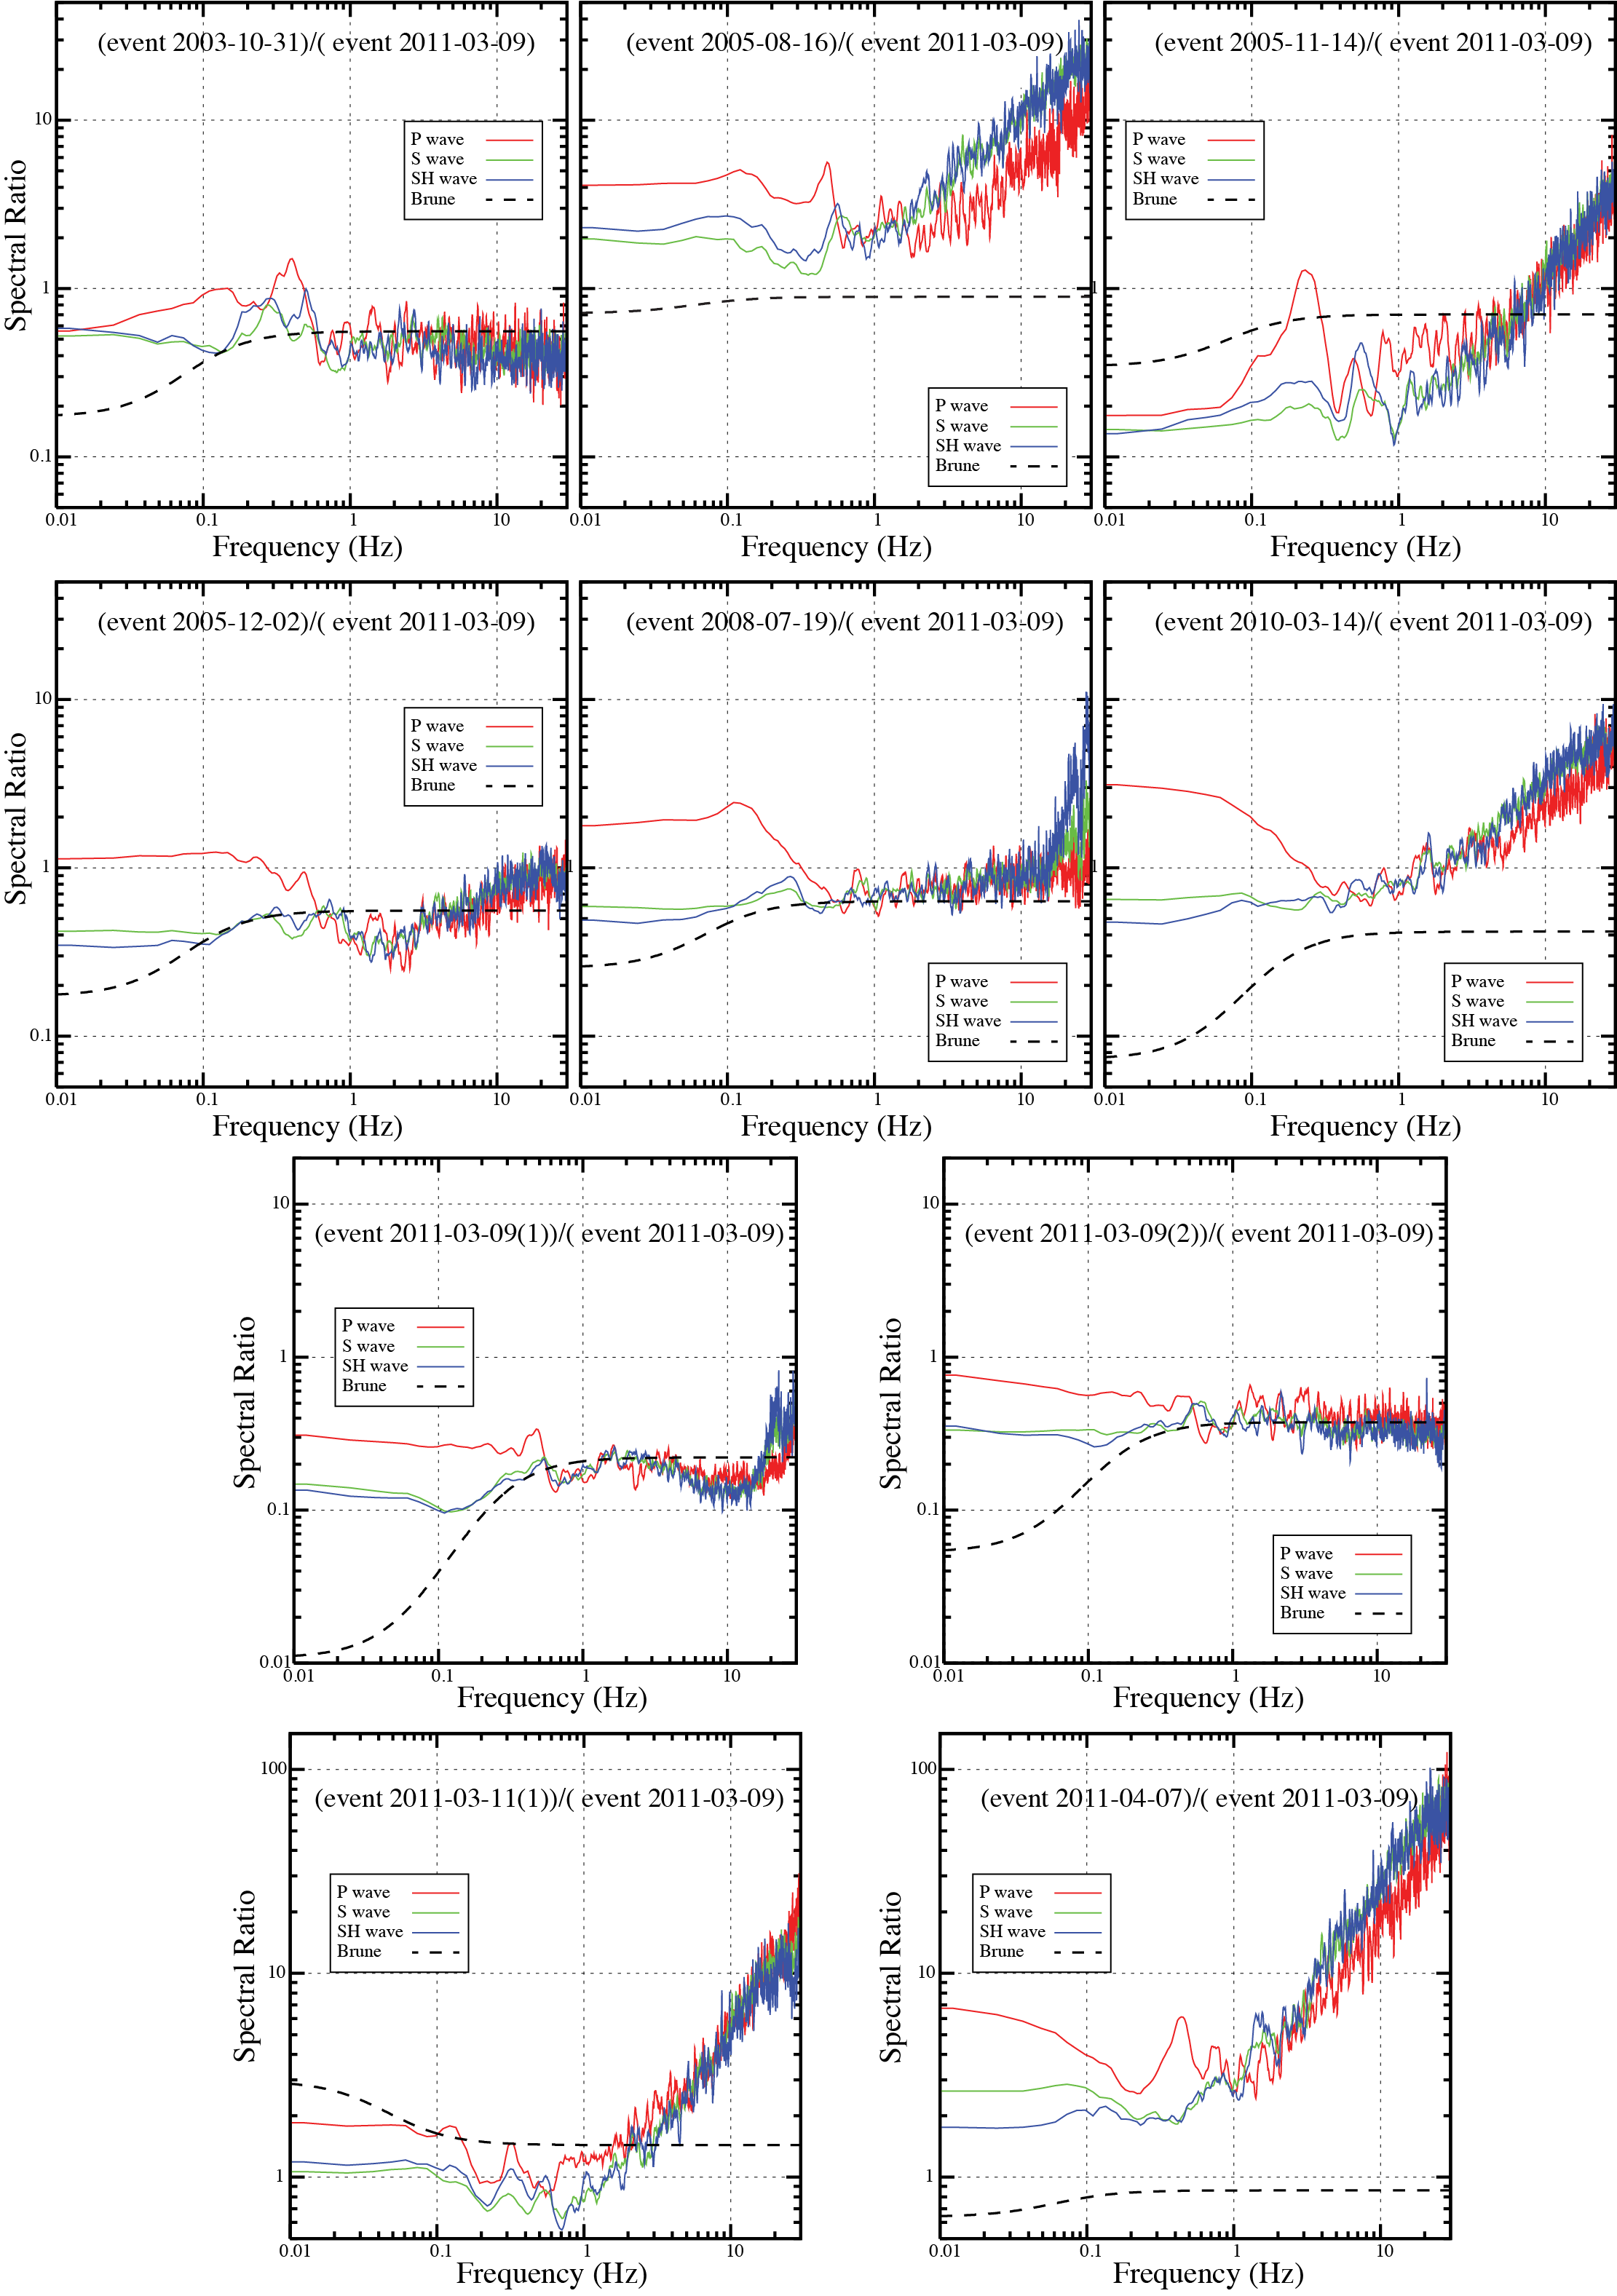
Figure S1. Spectral ratios for (event 2005-08-16)/(event 2011-03-09)
Figure S2. Spectral ratios for (event 2005-12-02)/(event 2011-03-09)
Figure S3. Spectral ratios for (event 2008-07-19)/(event 2011-03-09)
Figure S4. Spectral ratios for (event 2010-03-14)/(event 2011-03-09)
Figure S5. Spectral ratios for (event 2011-03-09(2))/(event 2011-03-09)
Figure S6. Spectral ratios for (event 2011-03-11)/(event 2011-03-09)
Figure S7. Spectral ratios for (event 2011-03-11(1))/(event 2011-03-09)
Figure S8. Spectral ratios for (event 2011-04-07)/(event 2011-03-09)
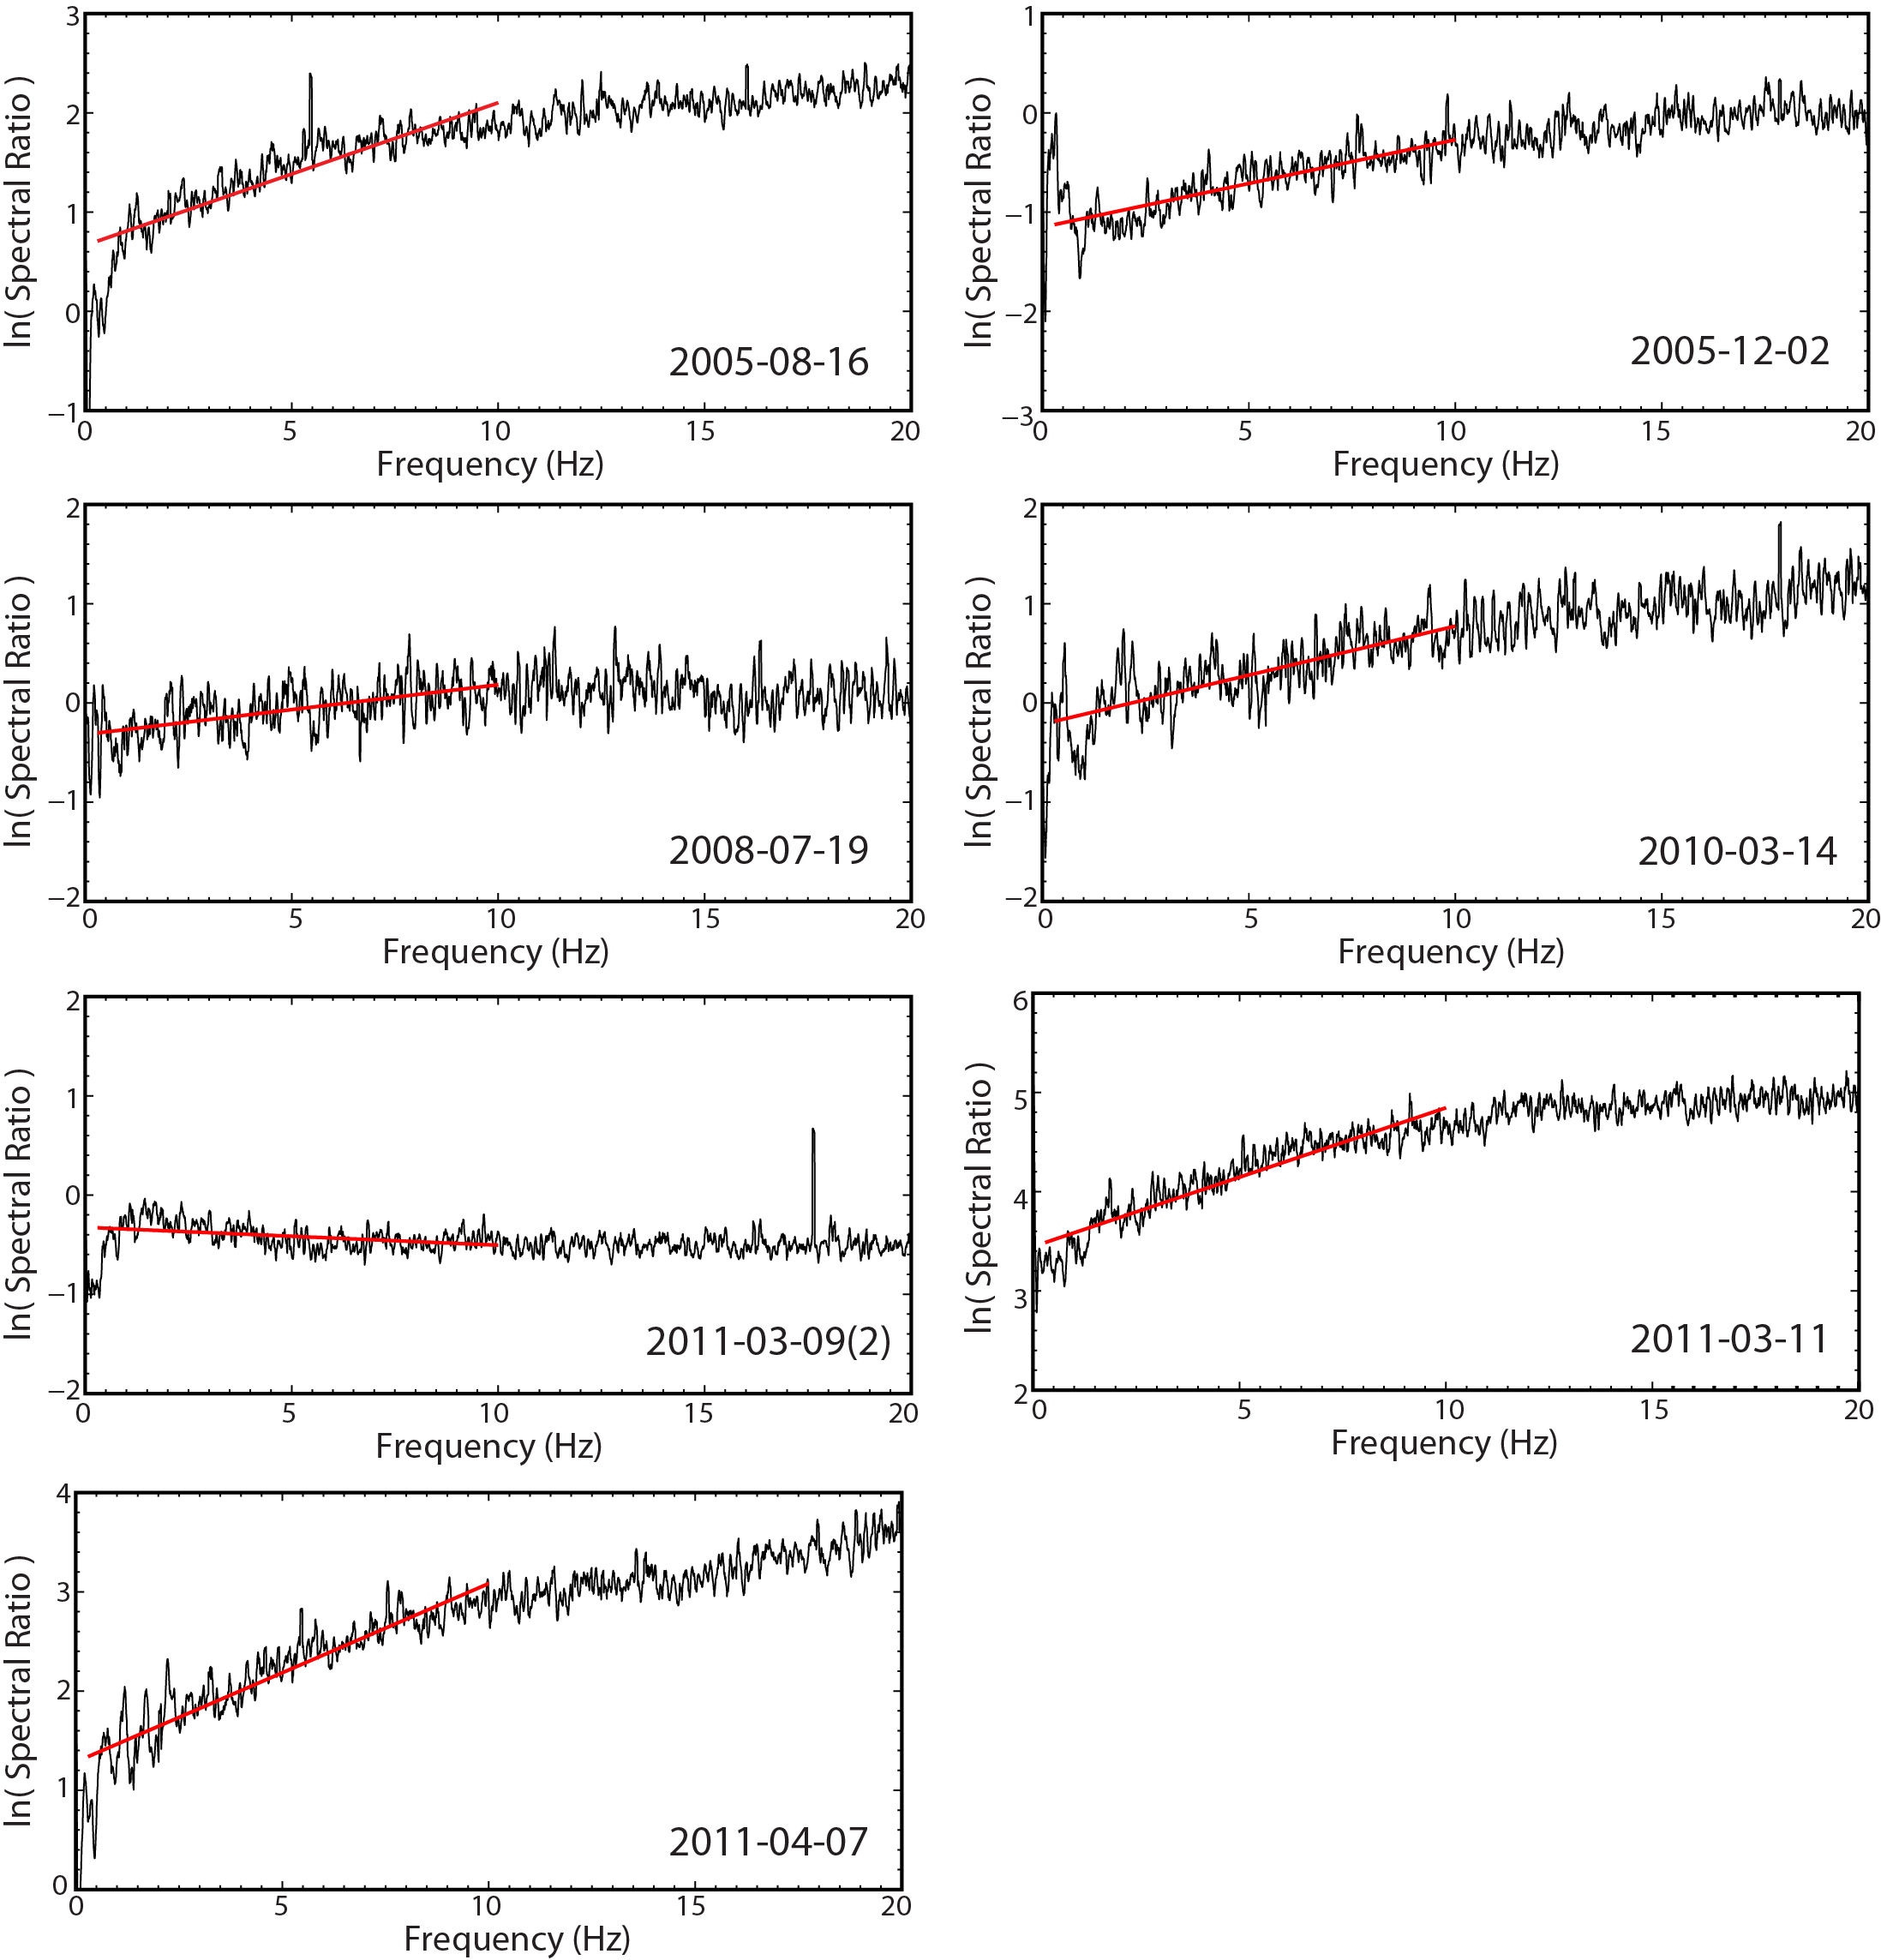
Least squares linear regression of the natural log spectral ratios in the frequency band 0.03-10.0 Hz.
Figure S9. Least squares linear regression of the natural log of averaged spectral ratios in the frequency band 0.03-10.0 Hz in Figure 2 for three-component signals 100 s long
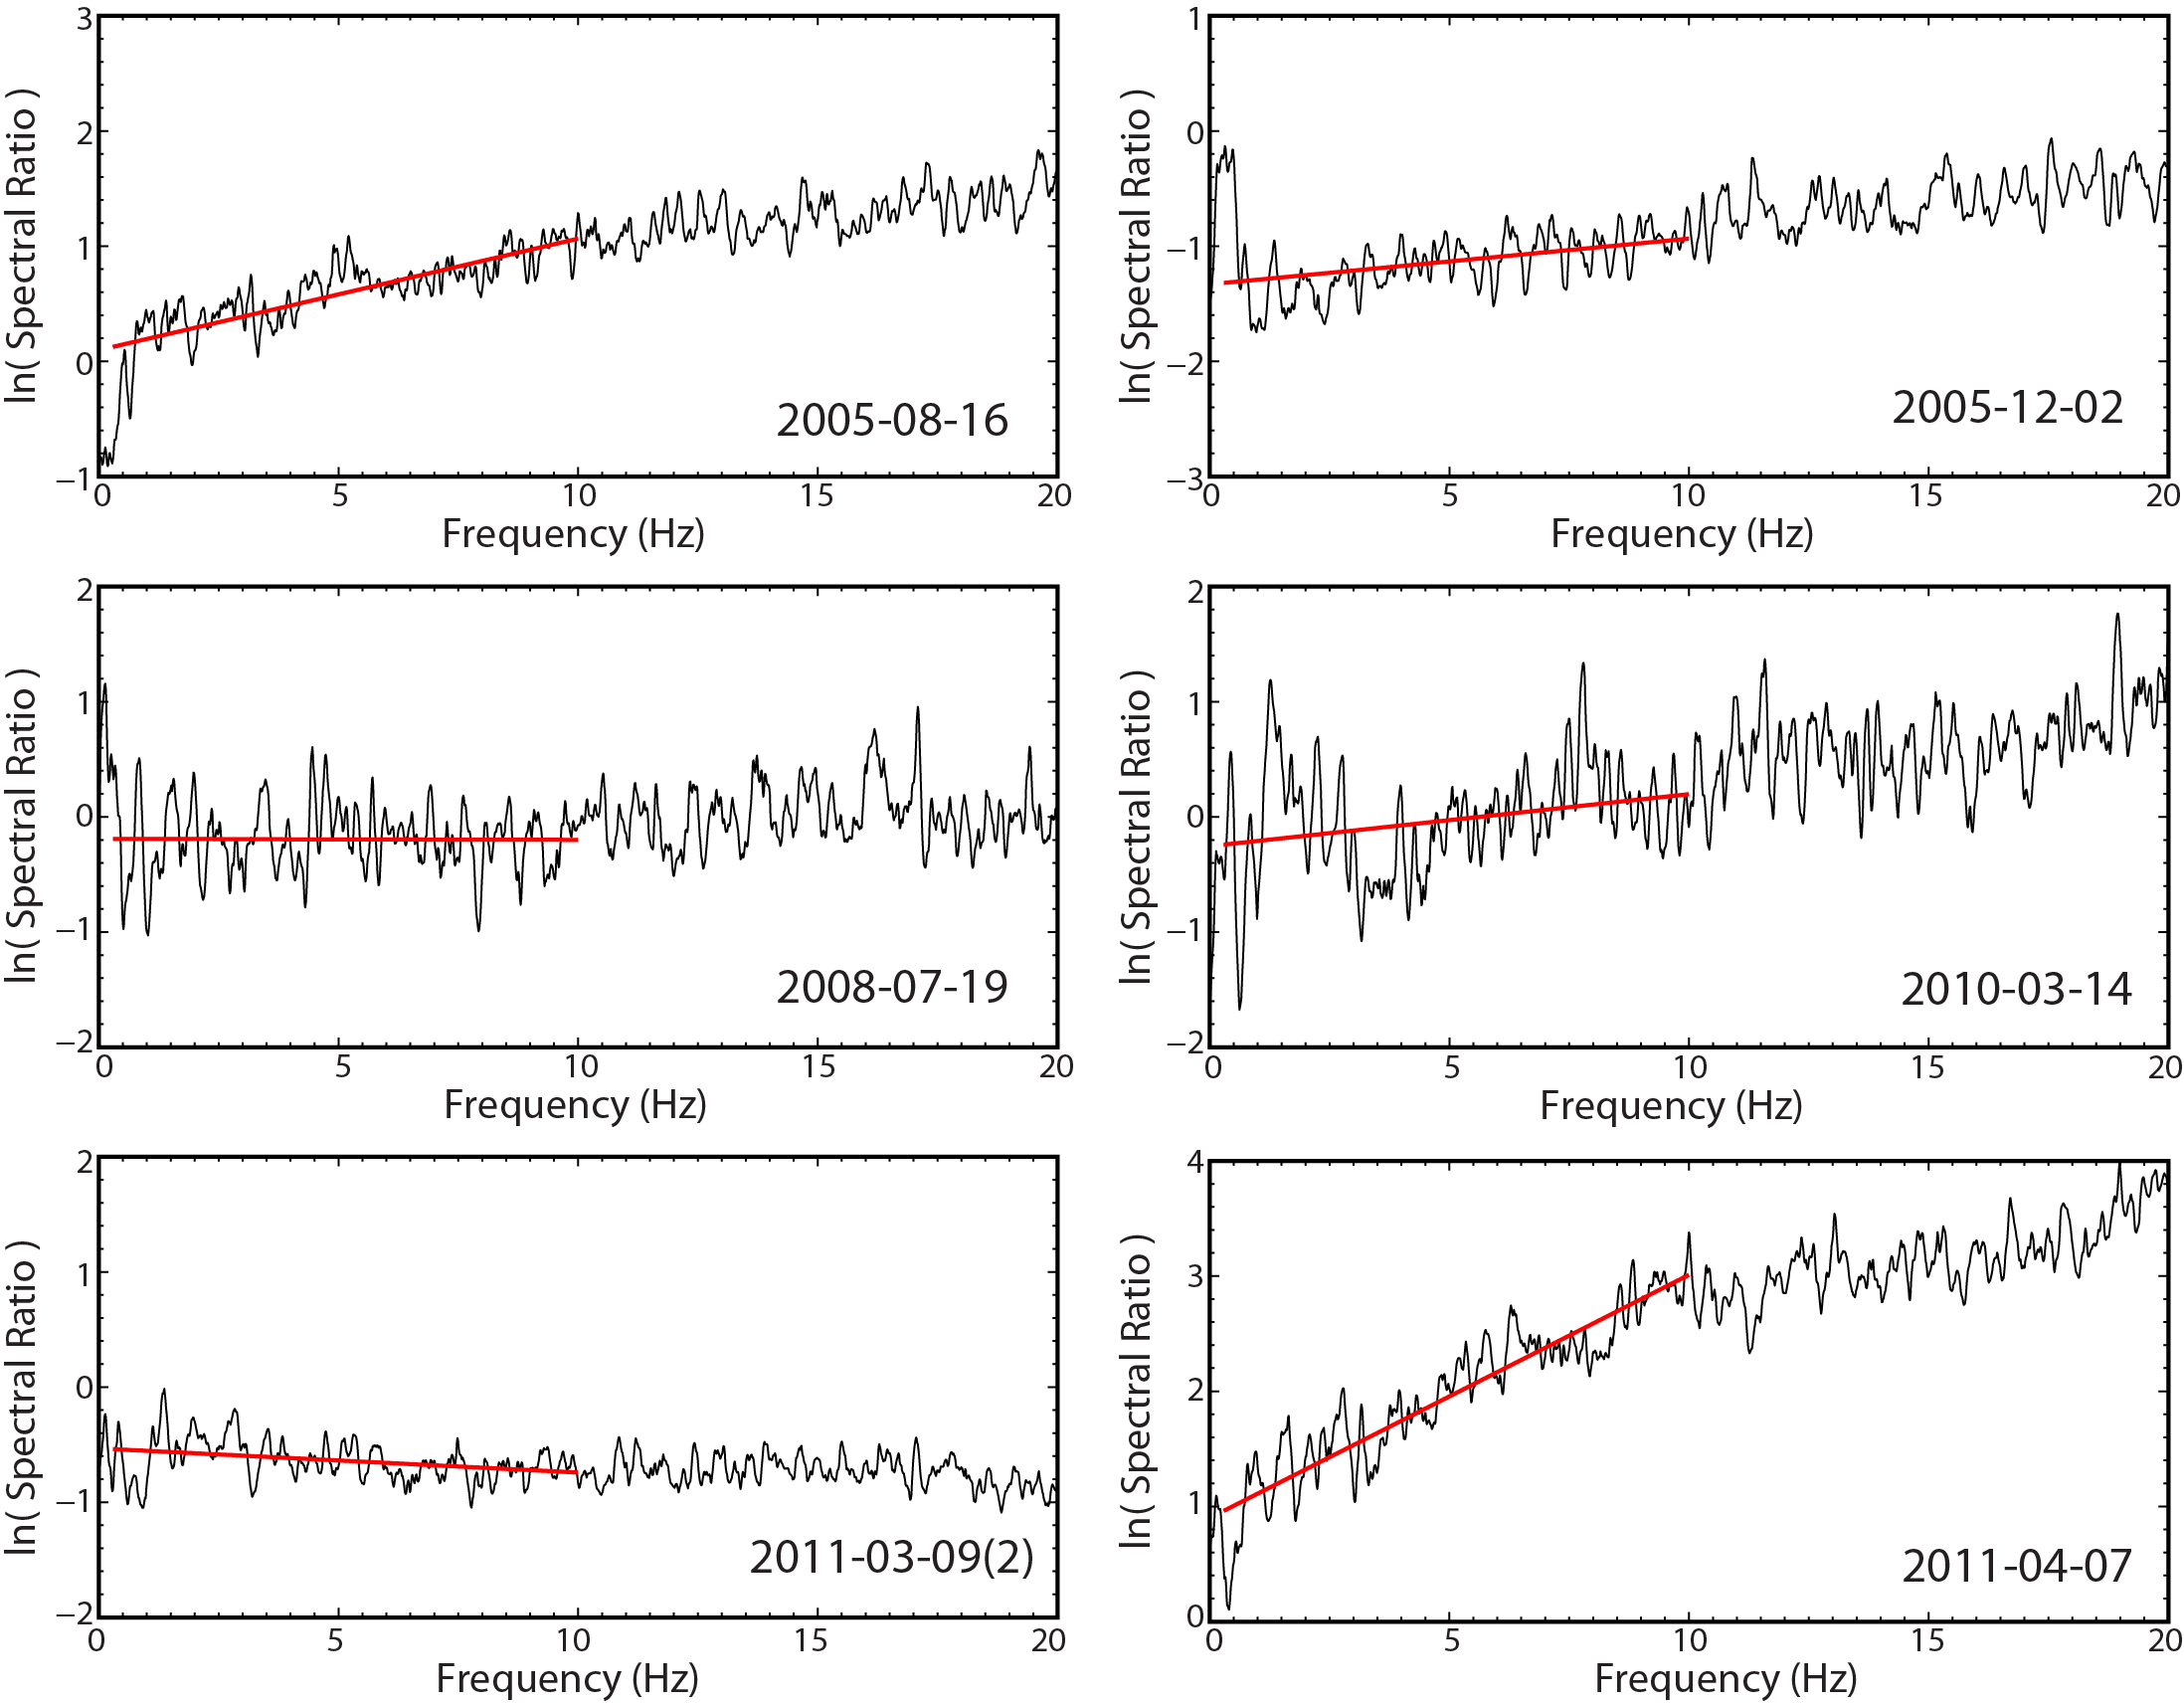
Figure S10. Least squares linear regression of the natural log of averaged P wave spectral ratios in the frequency band 0.03-10.0 Hz in Figure 4(a) for vertical component.
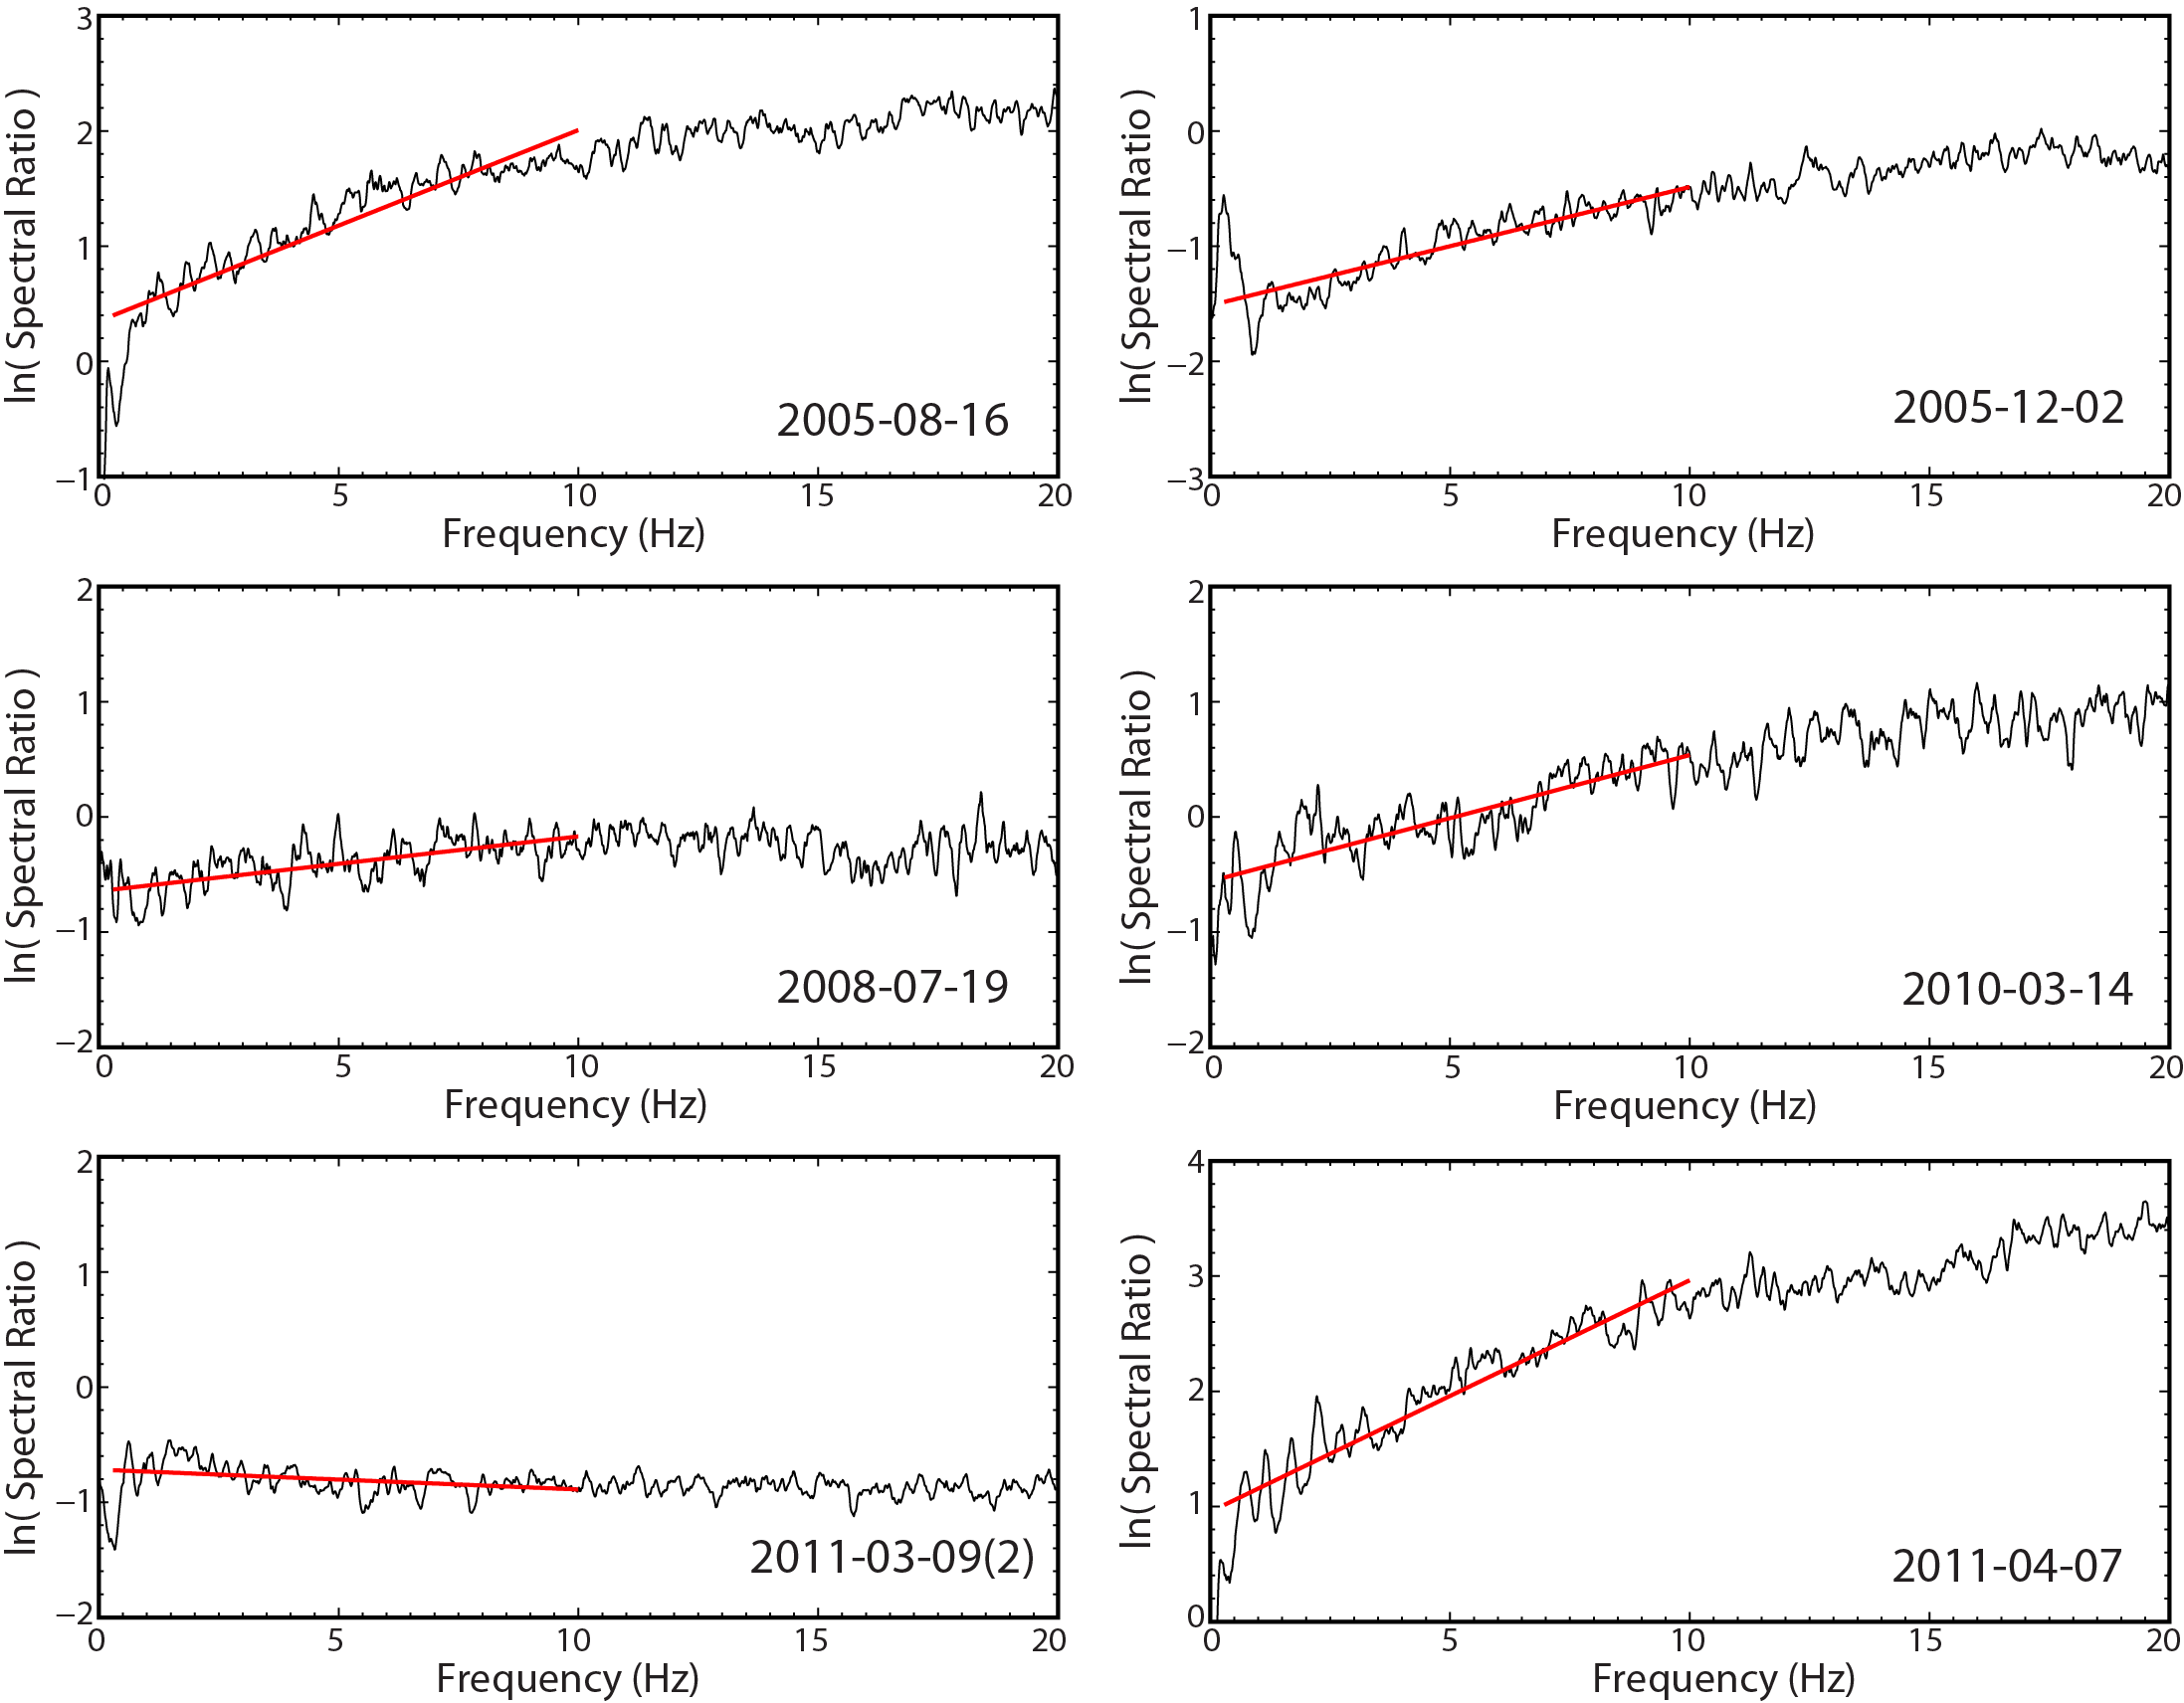
Figure S11. Least squares linear regression of the natural log of averaged S wave spectral ratios in the frequency band 0.03-10.0 Hz in Figure 4(b) for three-components signals.
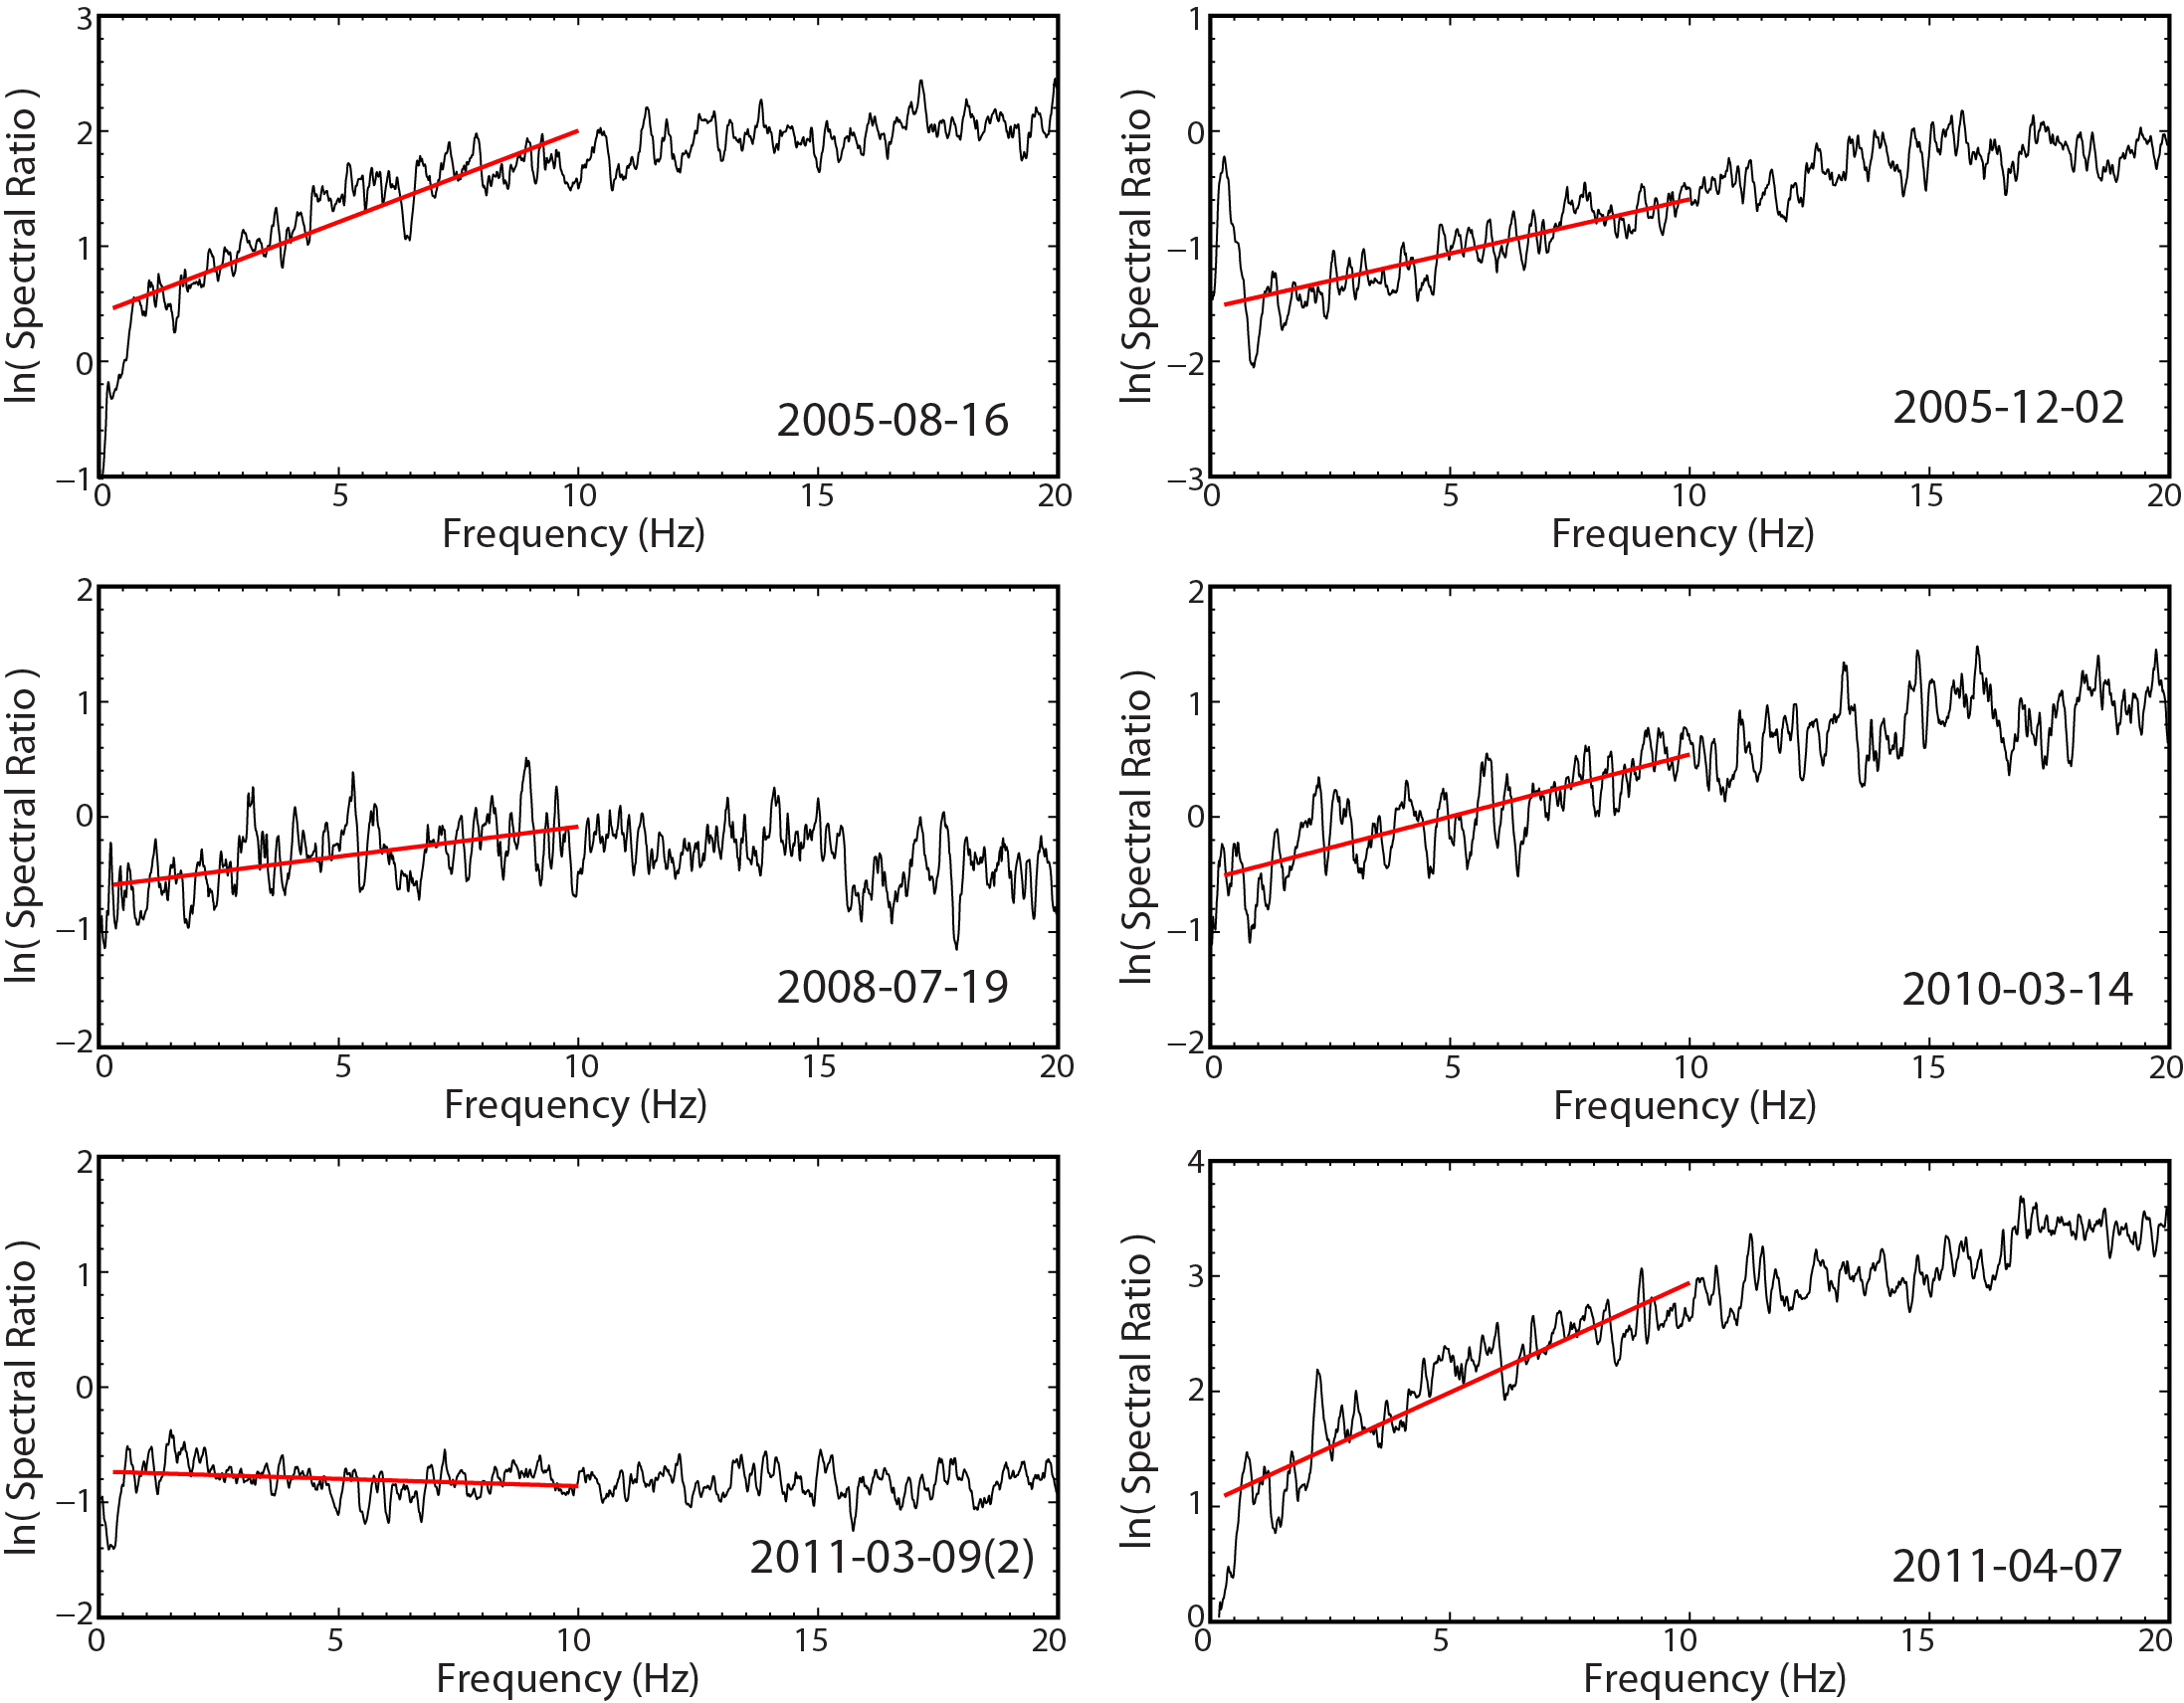
Figure S12. Least squares linear regression of the natural log of averaged SH wave spectral ratios in the frequency band 0.03-10.0 Hz in Figure 4(c) for tangential component.
Stacked spectral ratios of ground velocity recorded by short period Hi-net stations.
Figure S13. Stacked spectral ratios of ground velocity recorded by short period Hi-net stations (Figure 5) for large events in the Japan subduction zone around Tohoku with the foreshock event 2011-03-09 (Mw 7.3) being the reference (denominator) in each case. The stacked, smoothed spectral ratios are from all three components of recorded for 100 s time windows. The dashed curves are predicted spectral ratios for reference Brune omega-2 source models for a 3 MPa constant stress drop and the regional CMT seismic moments.
[ Back ]