Table S1. Triggered tremor locations in different regions.
Table S2. List of the information and measured parameters in all 17 regions used in this study.
Table S3. 1-D velocity model used to locate triggered tremor in each region.
Table S4. Fault orientations in different regions and information about the 2011 Tohoku earthquake.
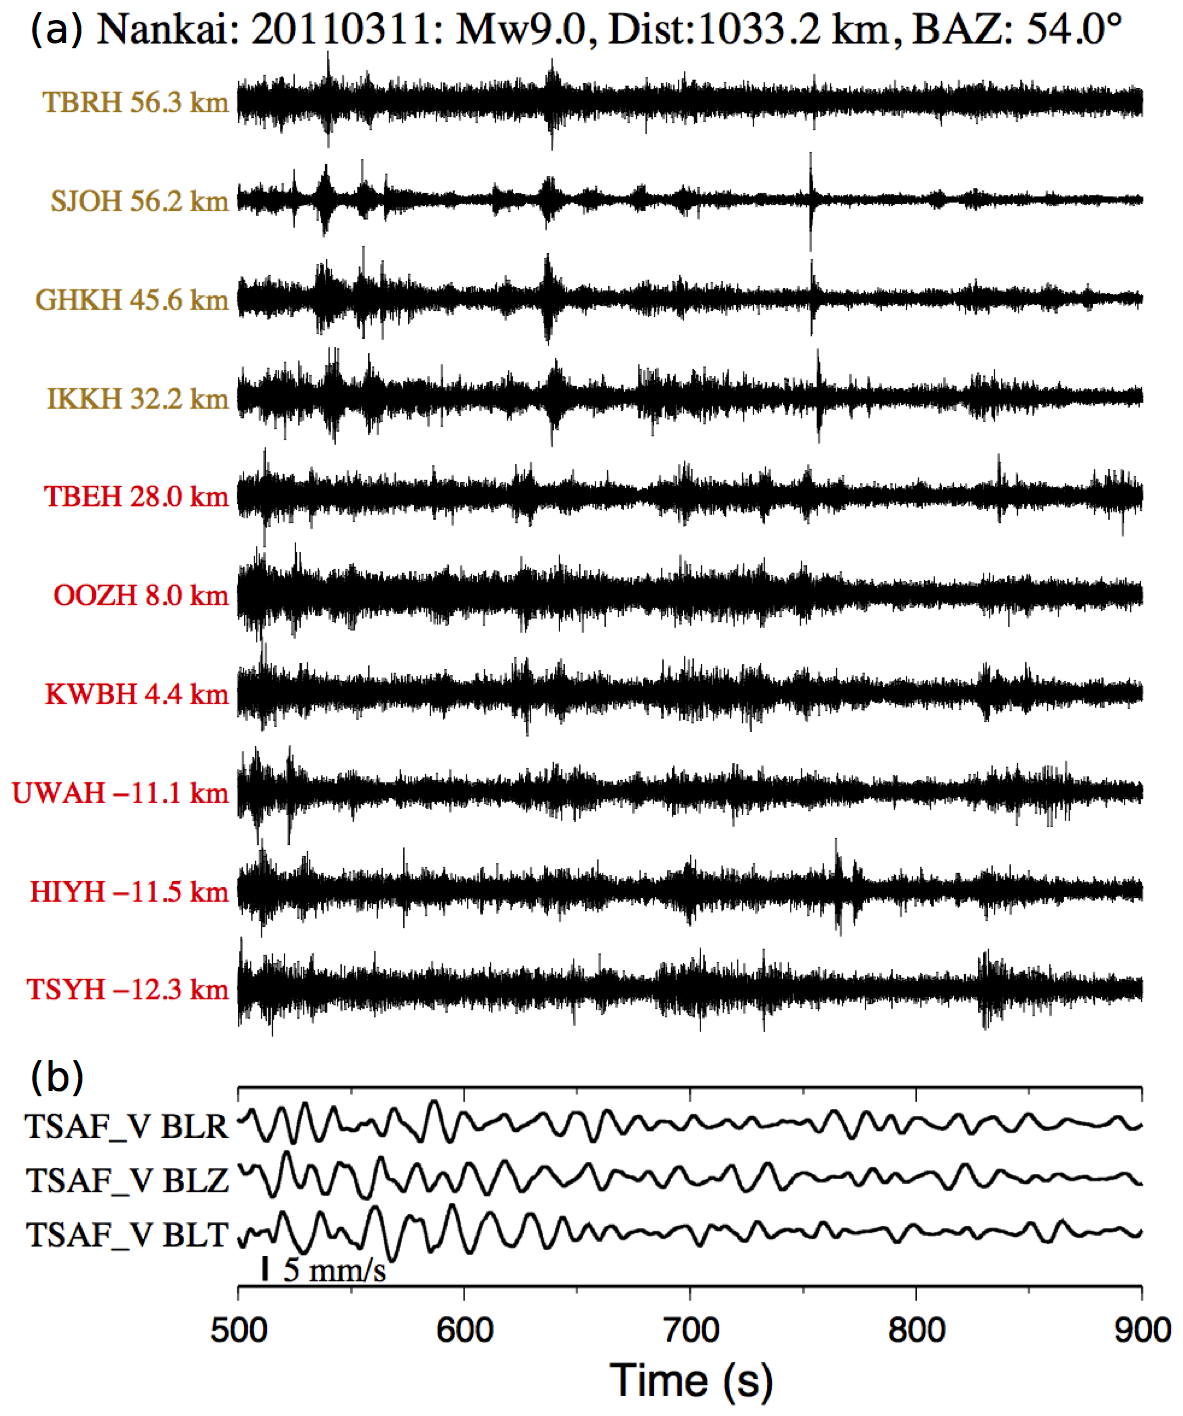
Figure S1 (a) Triggered tremor seismograms in Shikoku, Nankai, around the 2011 Mw9.0 Tohoku mainshock occurrence time. This figure is the same as Figure 3b but represents a zoom-in between 500 s and 900 s. The 5Hz high-pass filtered seismograms in the E-component show the moveout of triggered tremor at multiple source regions in Shikoku. The along-strike distance to the tremor source in western Shikoku (Tables S1 and S2) and the station names are marked to the left of the seismograms. The colored station names in red and yellow represent the stations that record possible tremor sources from western and central Shikoku, respectively. Note that we did not locate any triggered tremor source from any tremor bursts within this time period. (b) Three traces show the instrument-corrected strong motion velocity (V) seismograms in radial (BLR), vertical (BLZ), and transverse (BLT) components at the F-net station TSAF. The study region, the magnitude (M) of the 2011/03/11 Tohoku mainshock, and the epicenter distance (Dist) and back azimuth (BAZ) relative to the station TSAF are shown above the seismograms. The zero time corresponds to the origin time of the Tohoku mainshock. The thick vertical bar marks the amplitude scale of the surface waves.
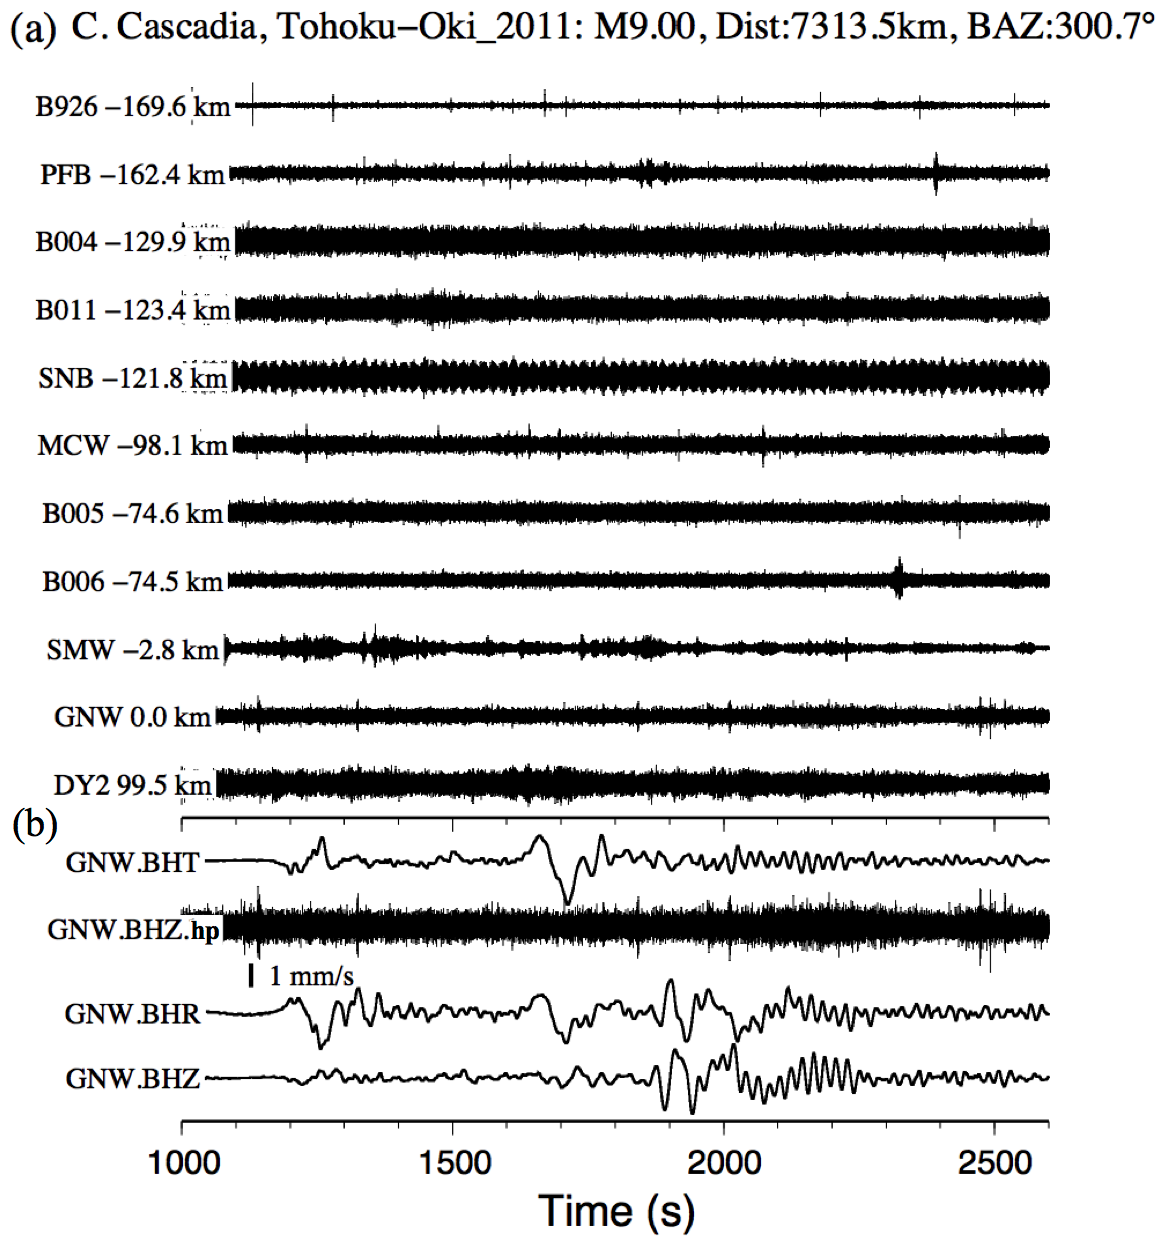
Figure S2. Seismograms illustrating the absence of tremor triggered by the Tohoku earthquake in central Cascadia with 5Hz high-pass-filtered seismograms in the Z-component. (a) The seismograms are plotted along the strike of the Cascadia subduction zone. (b) Three traces show the instrument-corrected broadband velocity seismograms and the 5Hz high-pass-filtered seismograms in the Z-component at station UW.GNW. Other notations are the same as in Figure S1.
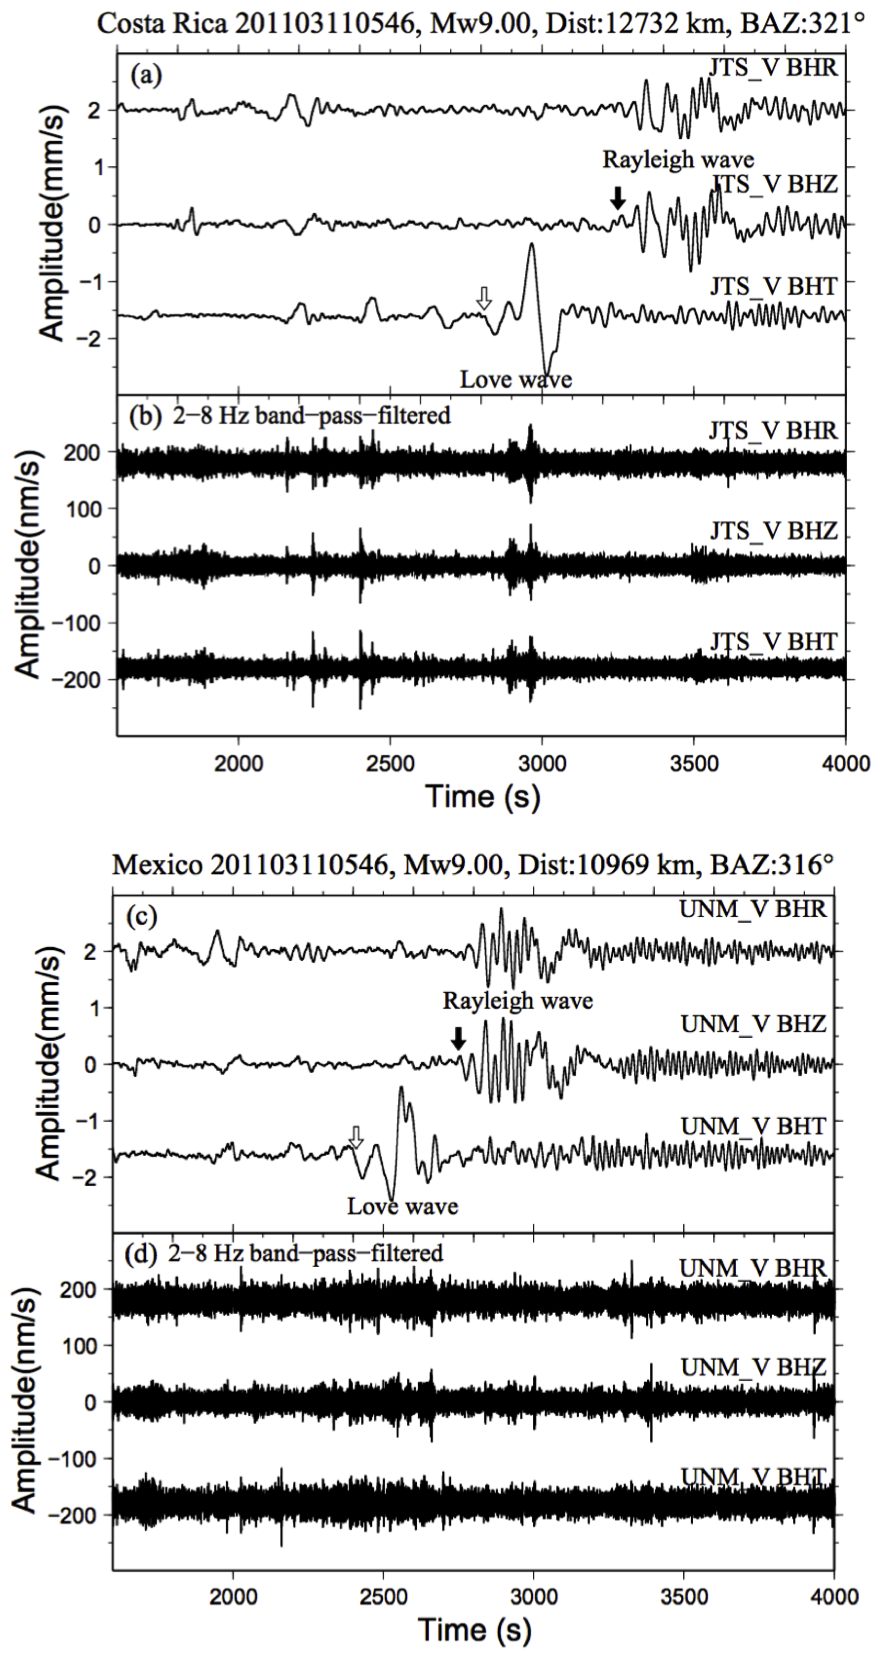
Figure S3. Seismograms illustrating possible triggered tremor examples in Costa Rica (a-b) and lack of triggered tremor Mexico (c-d). A comparison of the (a) broadband station II.JTS and (b) 2–8Hz band-pass-filtered seismograms at JTS, and the (c) broadband station G.UNM and (d) 2–8Hz band-pass-filtered seismograms at station UNM. Other notations are the same as in Figure S3.
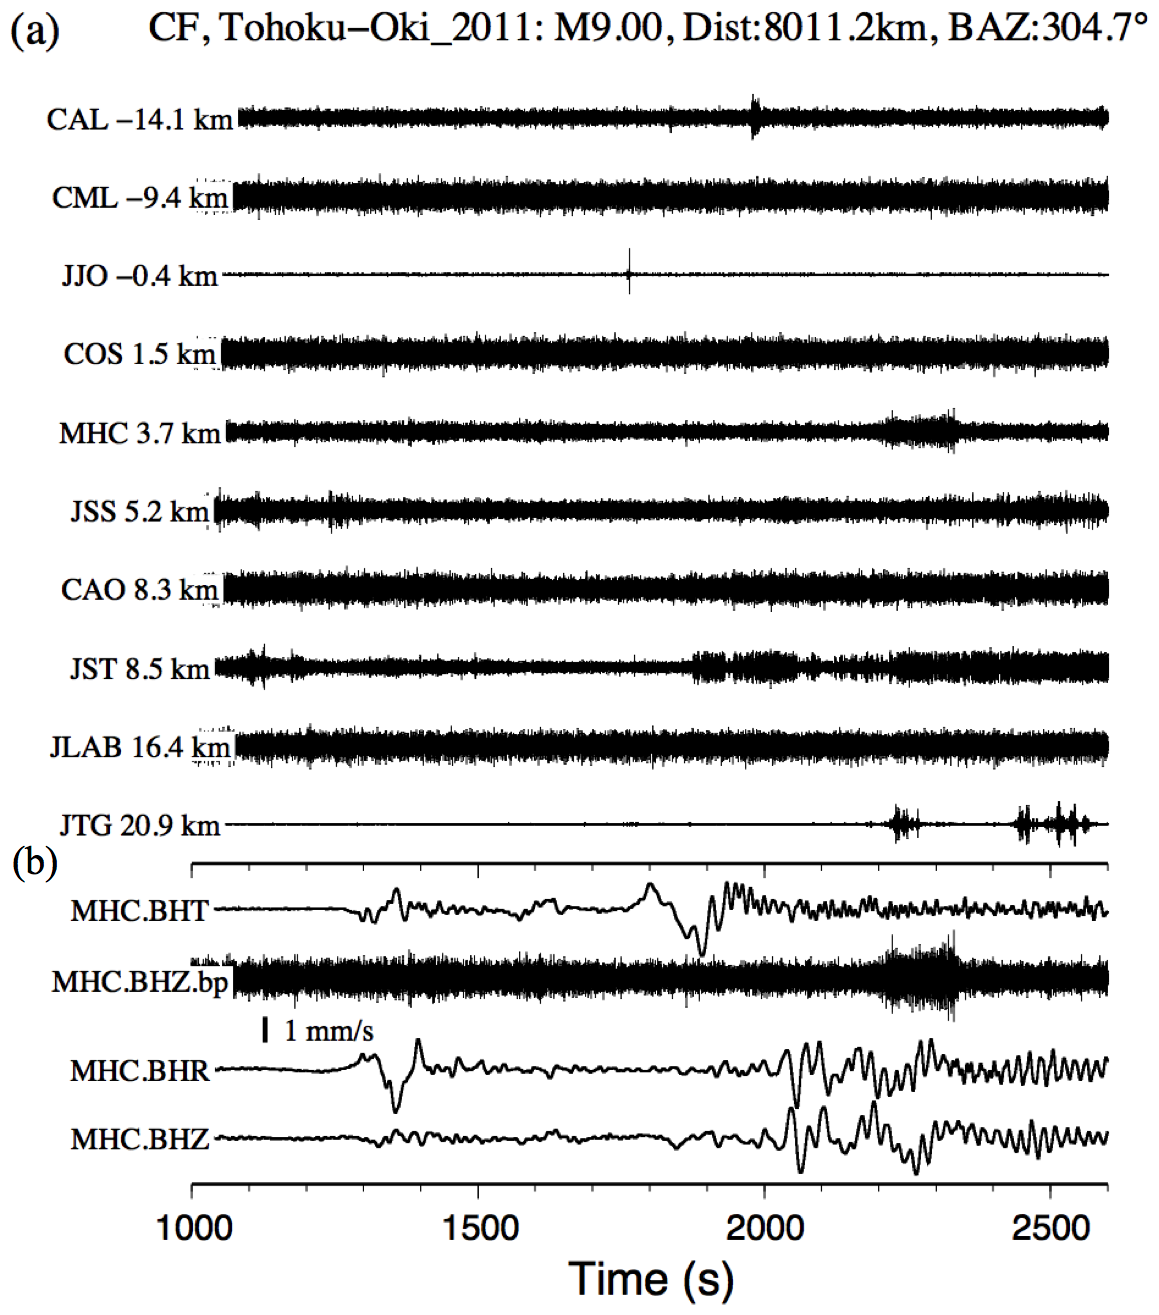
Figure S4. Seismograms illustrating the absence of tremor triggered by the Tohoku earthquake in the Calaveras Fault (CF) with 2-8Hz band-pass-filtered seismograms in the Z-component. (a) The seismograms are plotted along the strike of the Calaveras Fault. (b) Three traces show the instrument-corrected broadband velocity seismograms and the 2-8Hz band-pass-filtered seismograms in the Z-component at station MHC. Other notations are the same as in Figure S1.
[ Back ]