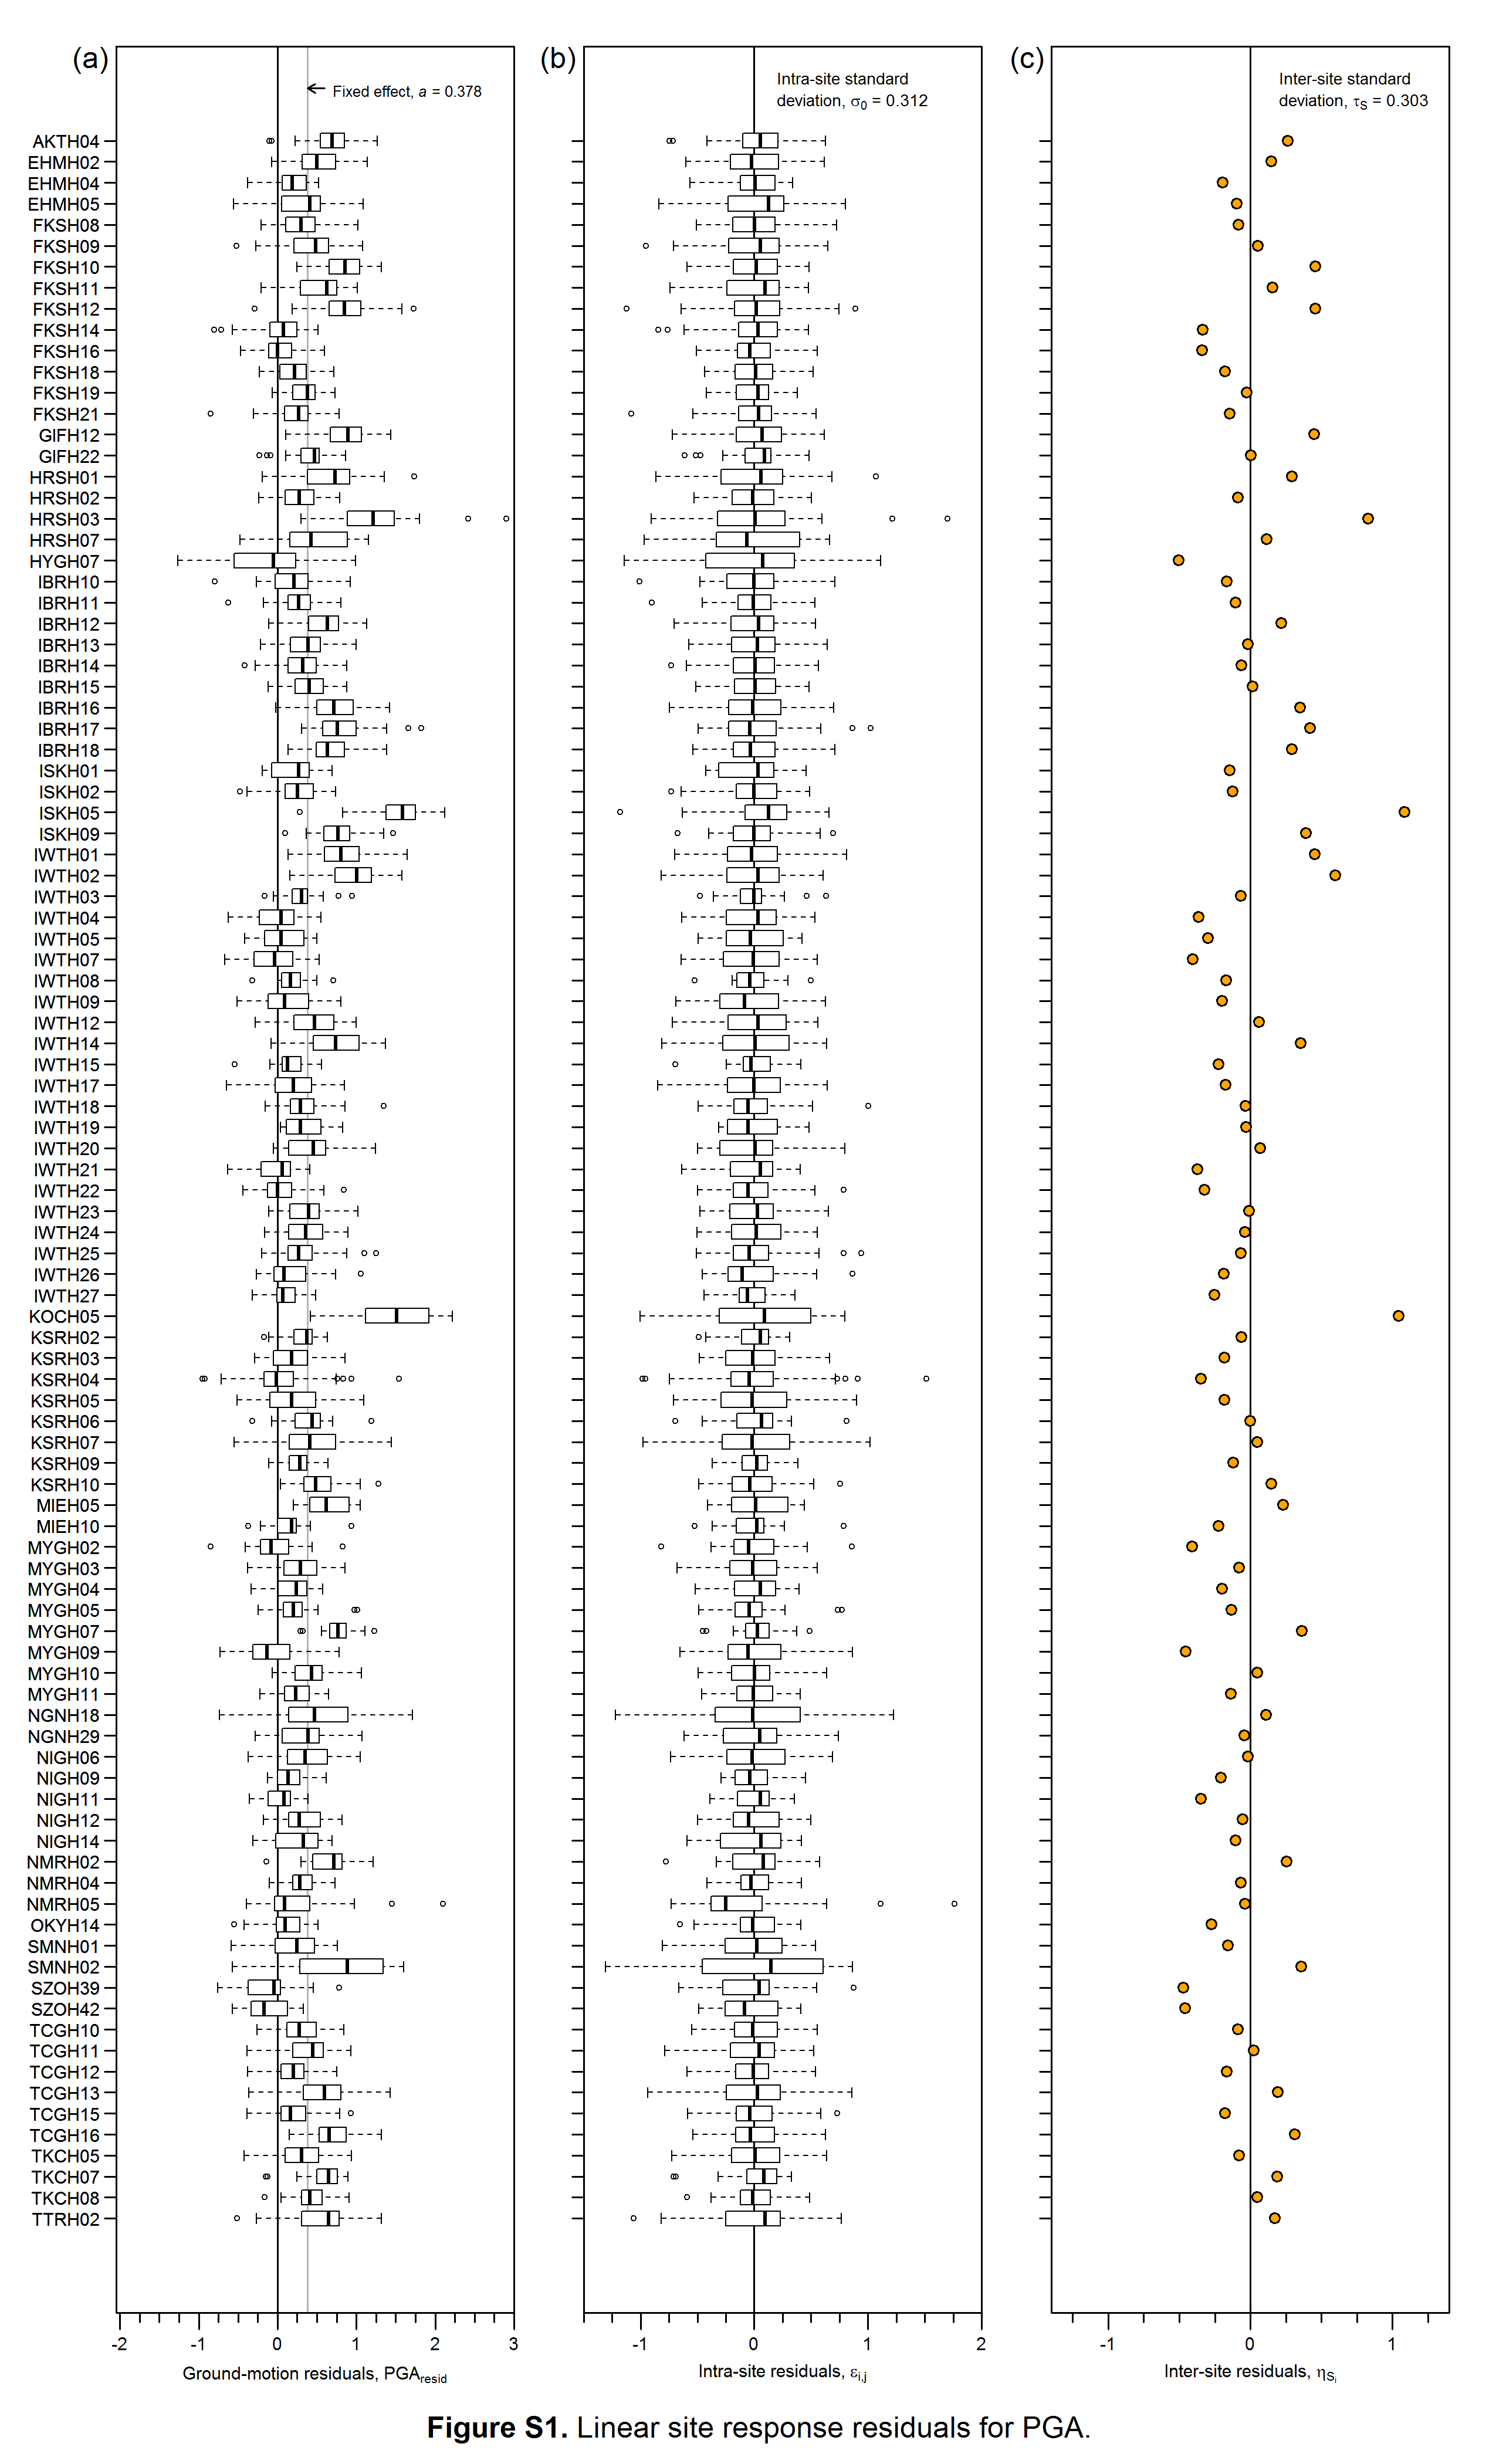
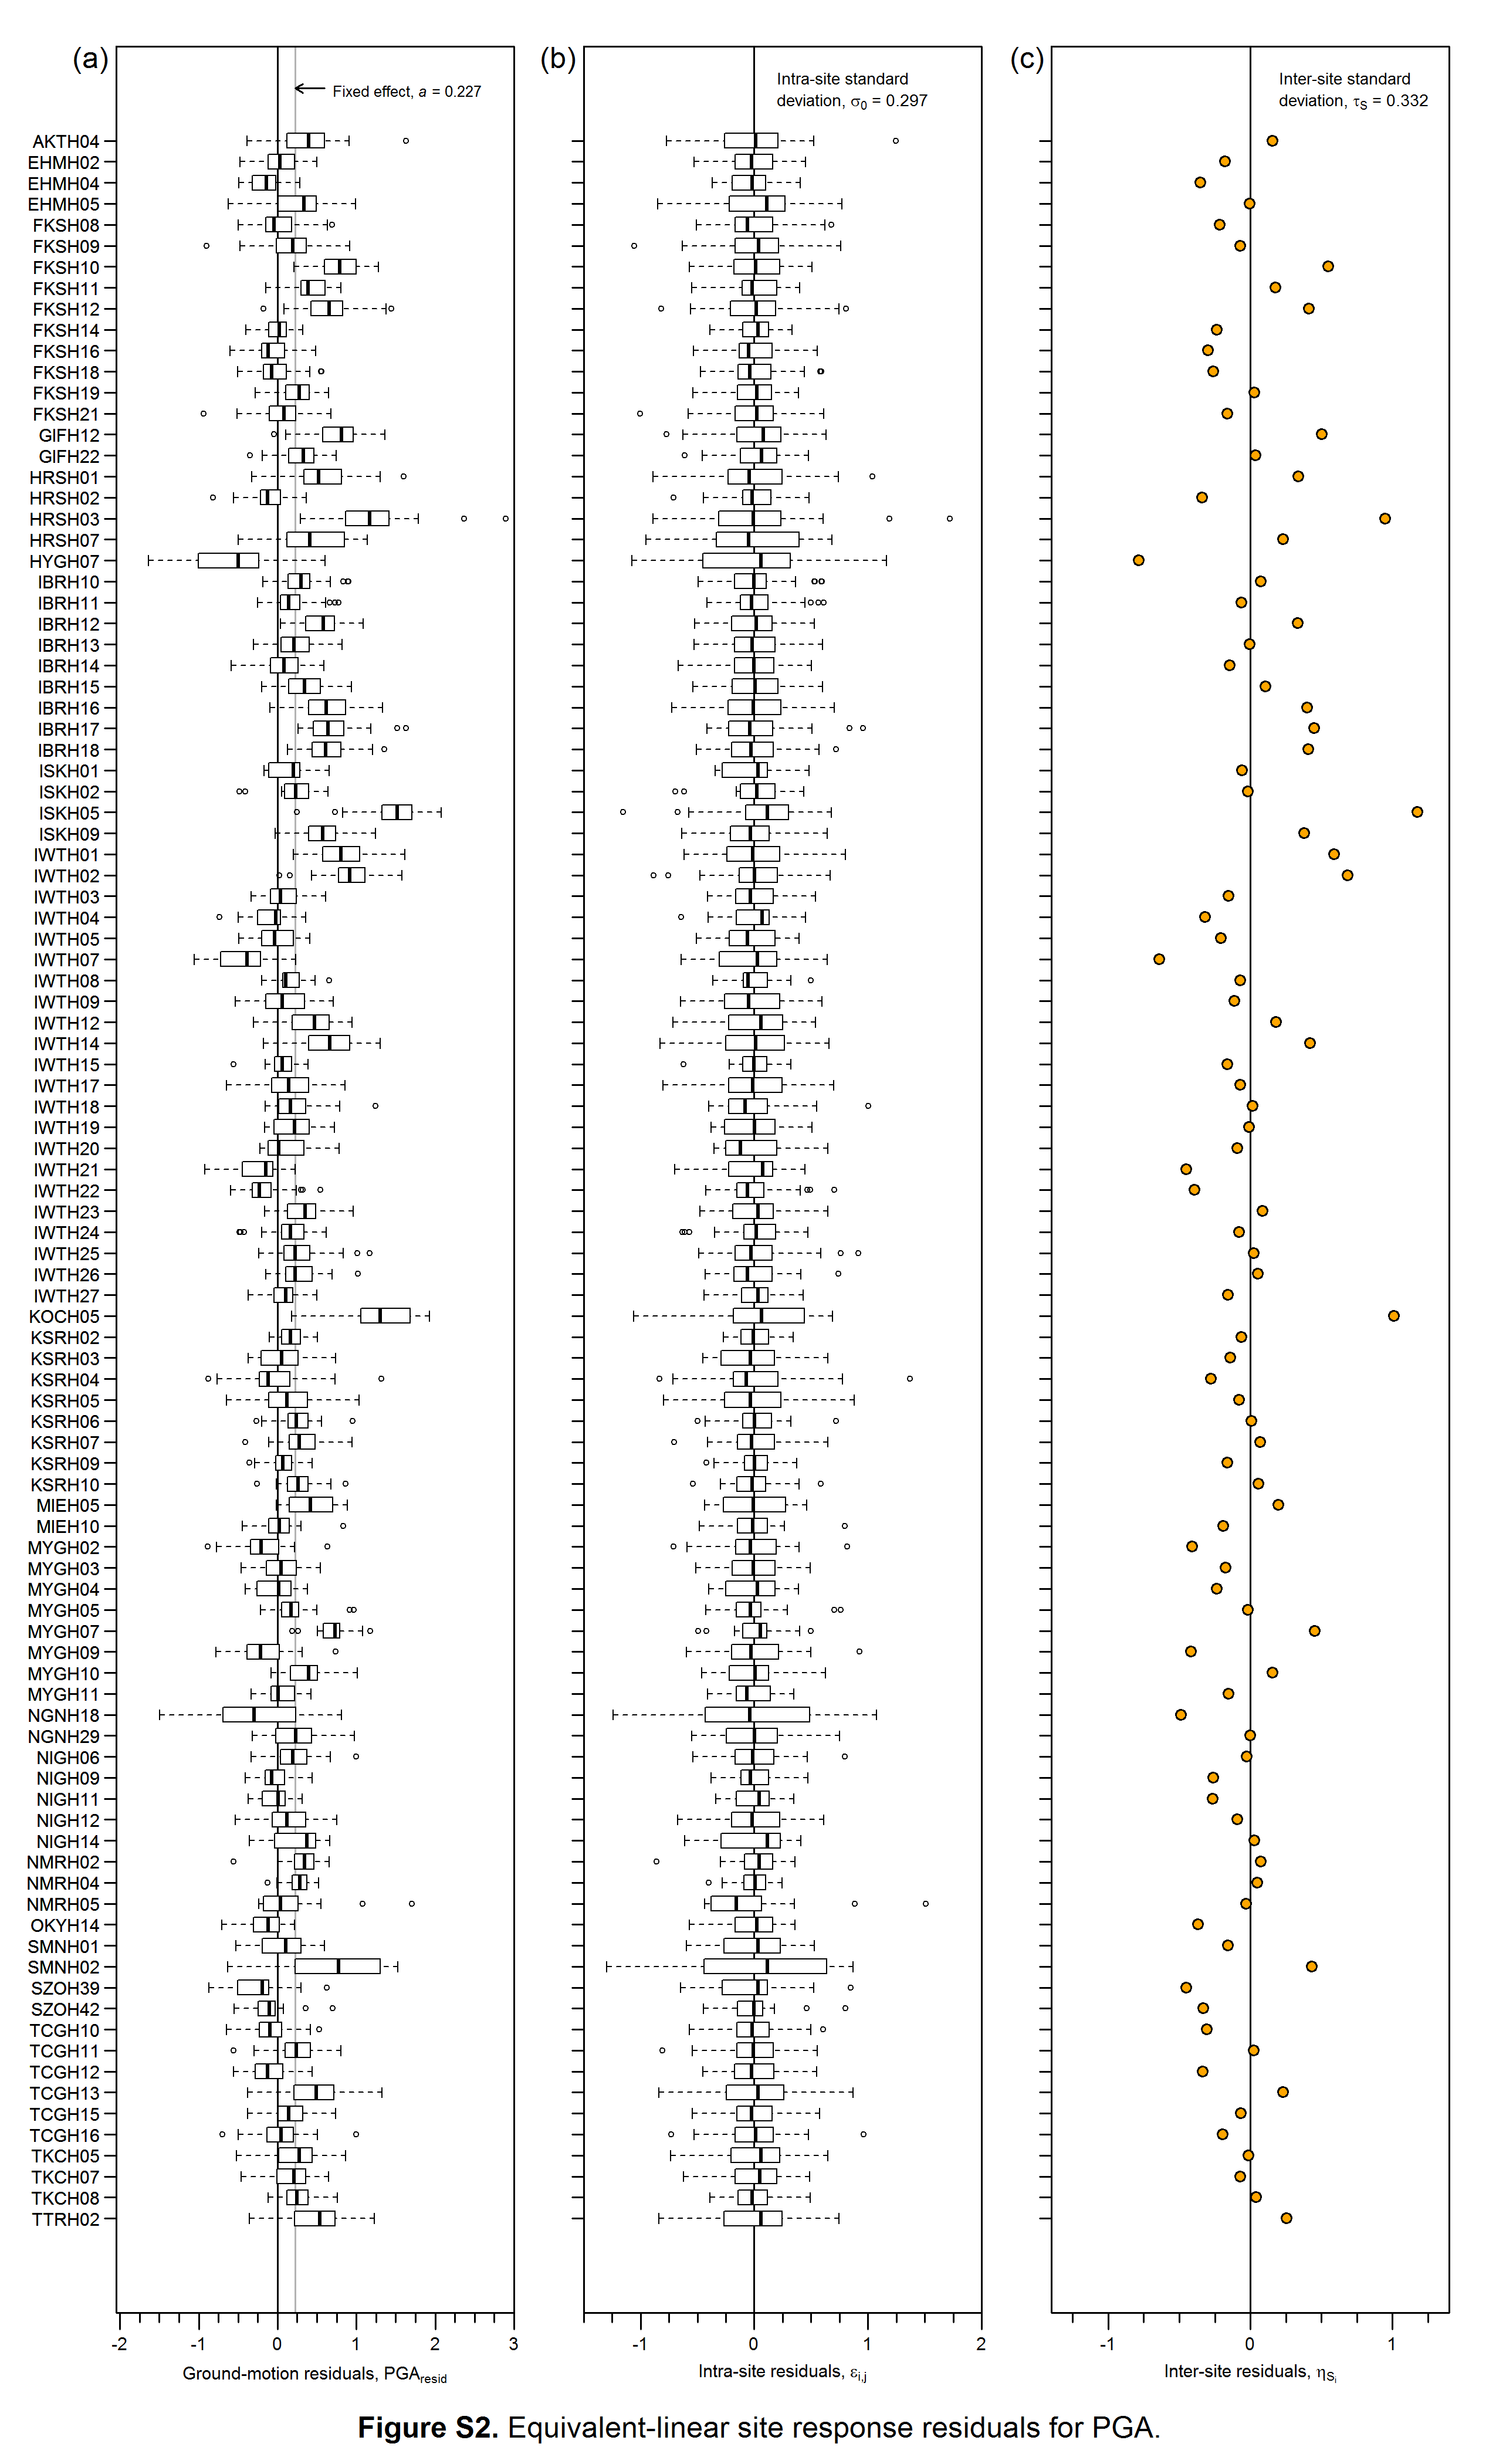
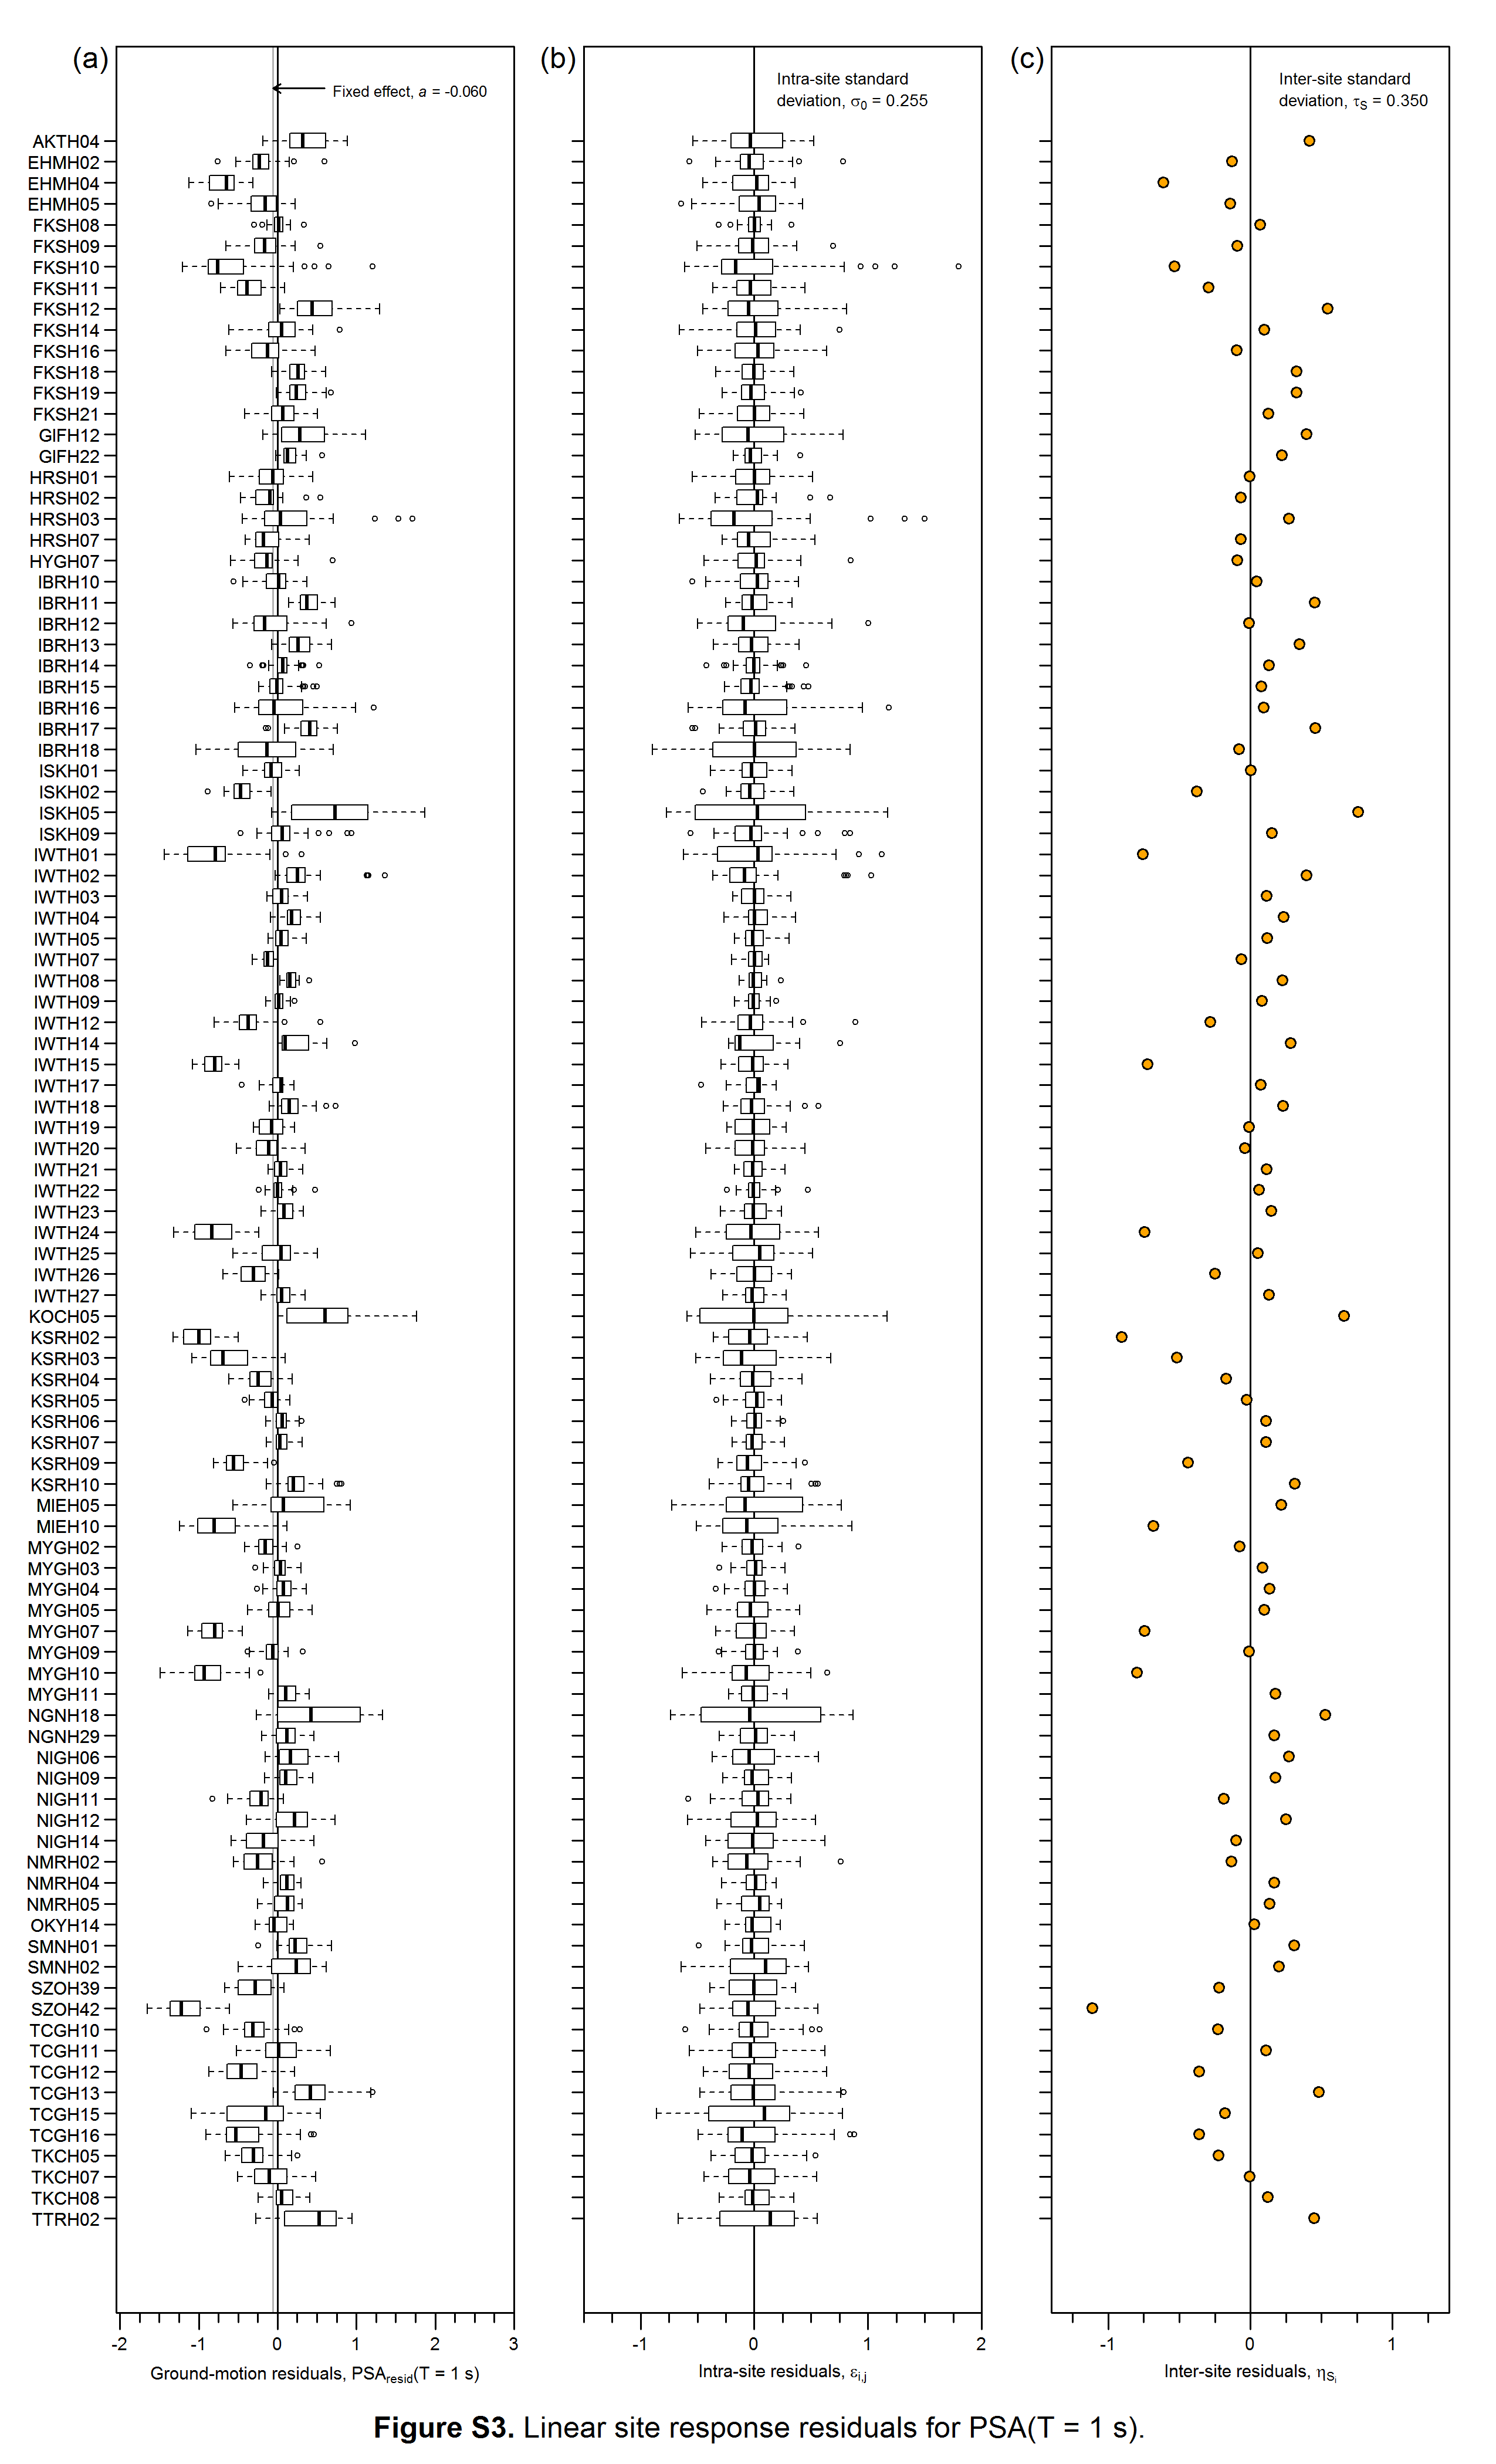
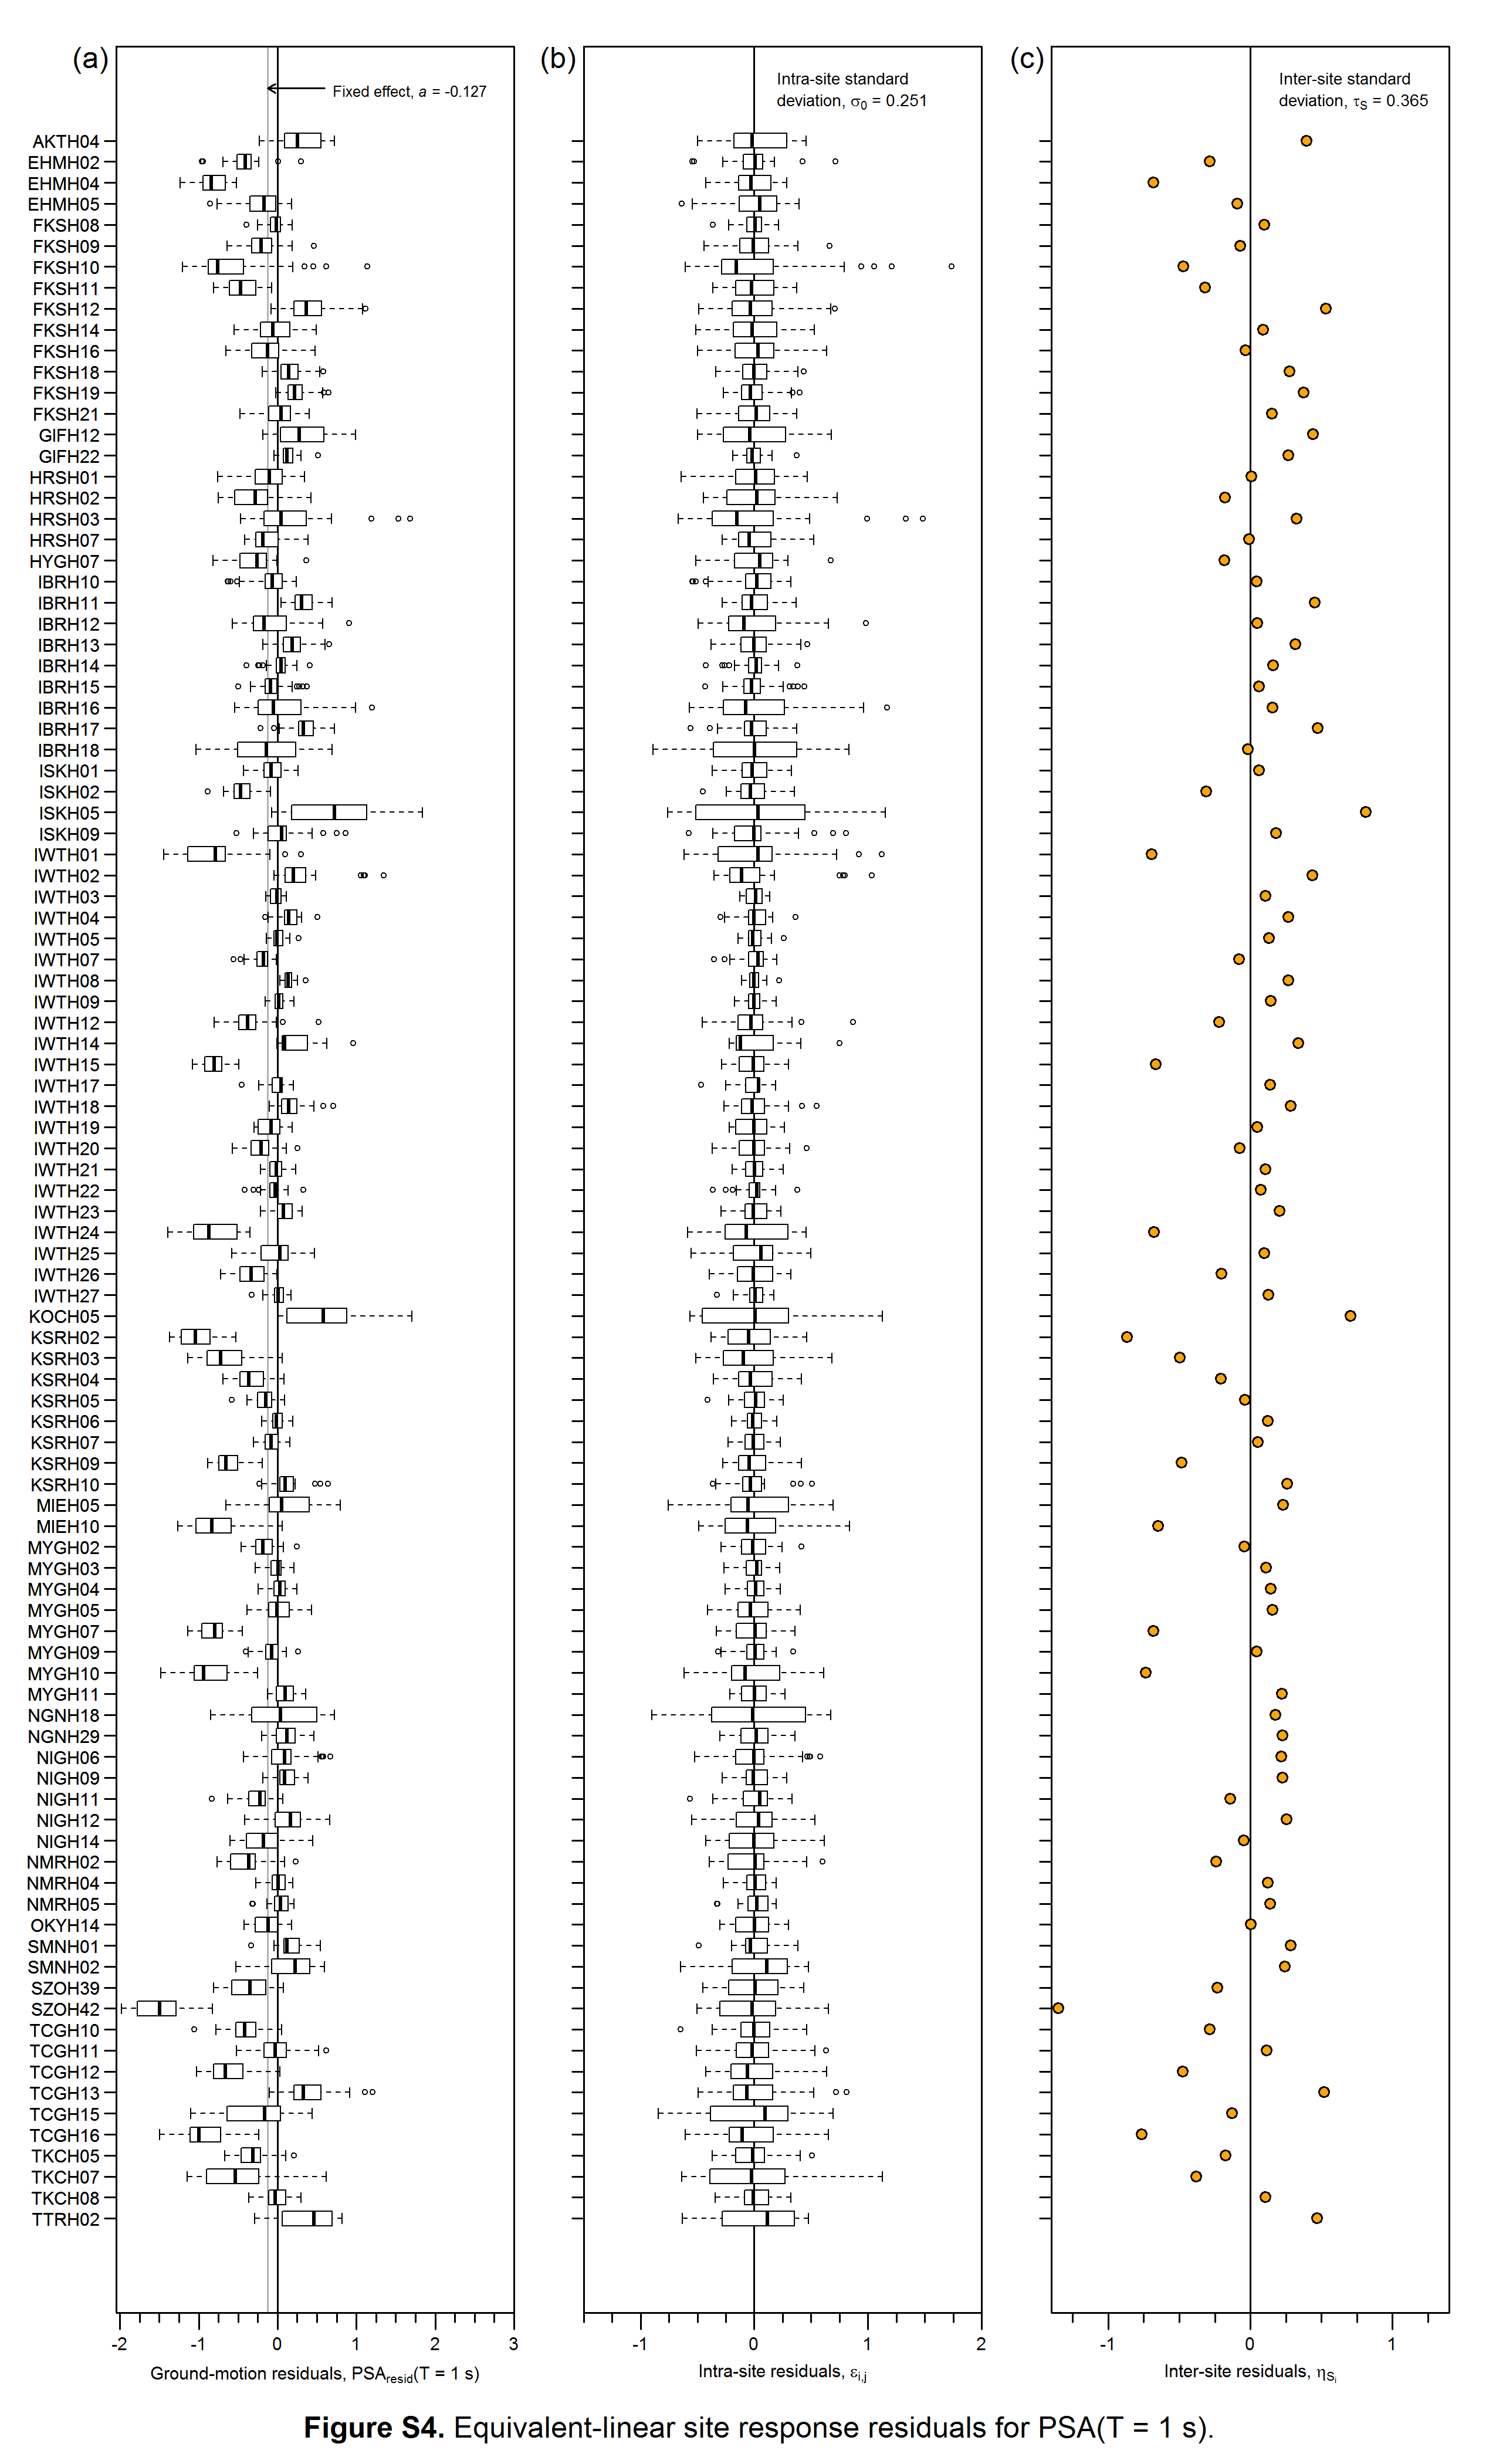
The electronic supplement to this article contains one table and 12 figures that contain site-specific information and results at the 100 KiK-net stations used in this study. Table S1 is a summary table of the 100 KiK-net stations and their site characteristics. Figures S1 to S4 contain boxplots of the ground-motion residuals, intra-site residuals, and inter-site residuals for the site response analyses at the stations. For the linear and equivalent-linear analyses, the residuals are displayed for (a) peak ground acceleration (PGA), and (b) the 5%-damped pseudo-response spectral acceleration (PSA) at a spectral period (T) of 1 s. Figure S1 displays the linear residuals for PGA, Figure S2 displays the equivalent-linear residuals for PGA, Figure S3 displays the linear residuals for PSA(T = 1 s), and Figure S4 displays the equivalent-linear residuals for PSA(T = 1 s). The distributions of ground-motion residuals and intra-site residuals at each site are represented by boxplots: the interquartile range (IQR) is enclosed by the rectangular area, and the median is shown as a thick line within the box. The dashed whiskers extend to 1.5*IQR, and extreme data points outside this range are shown as circles.
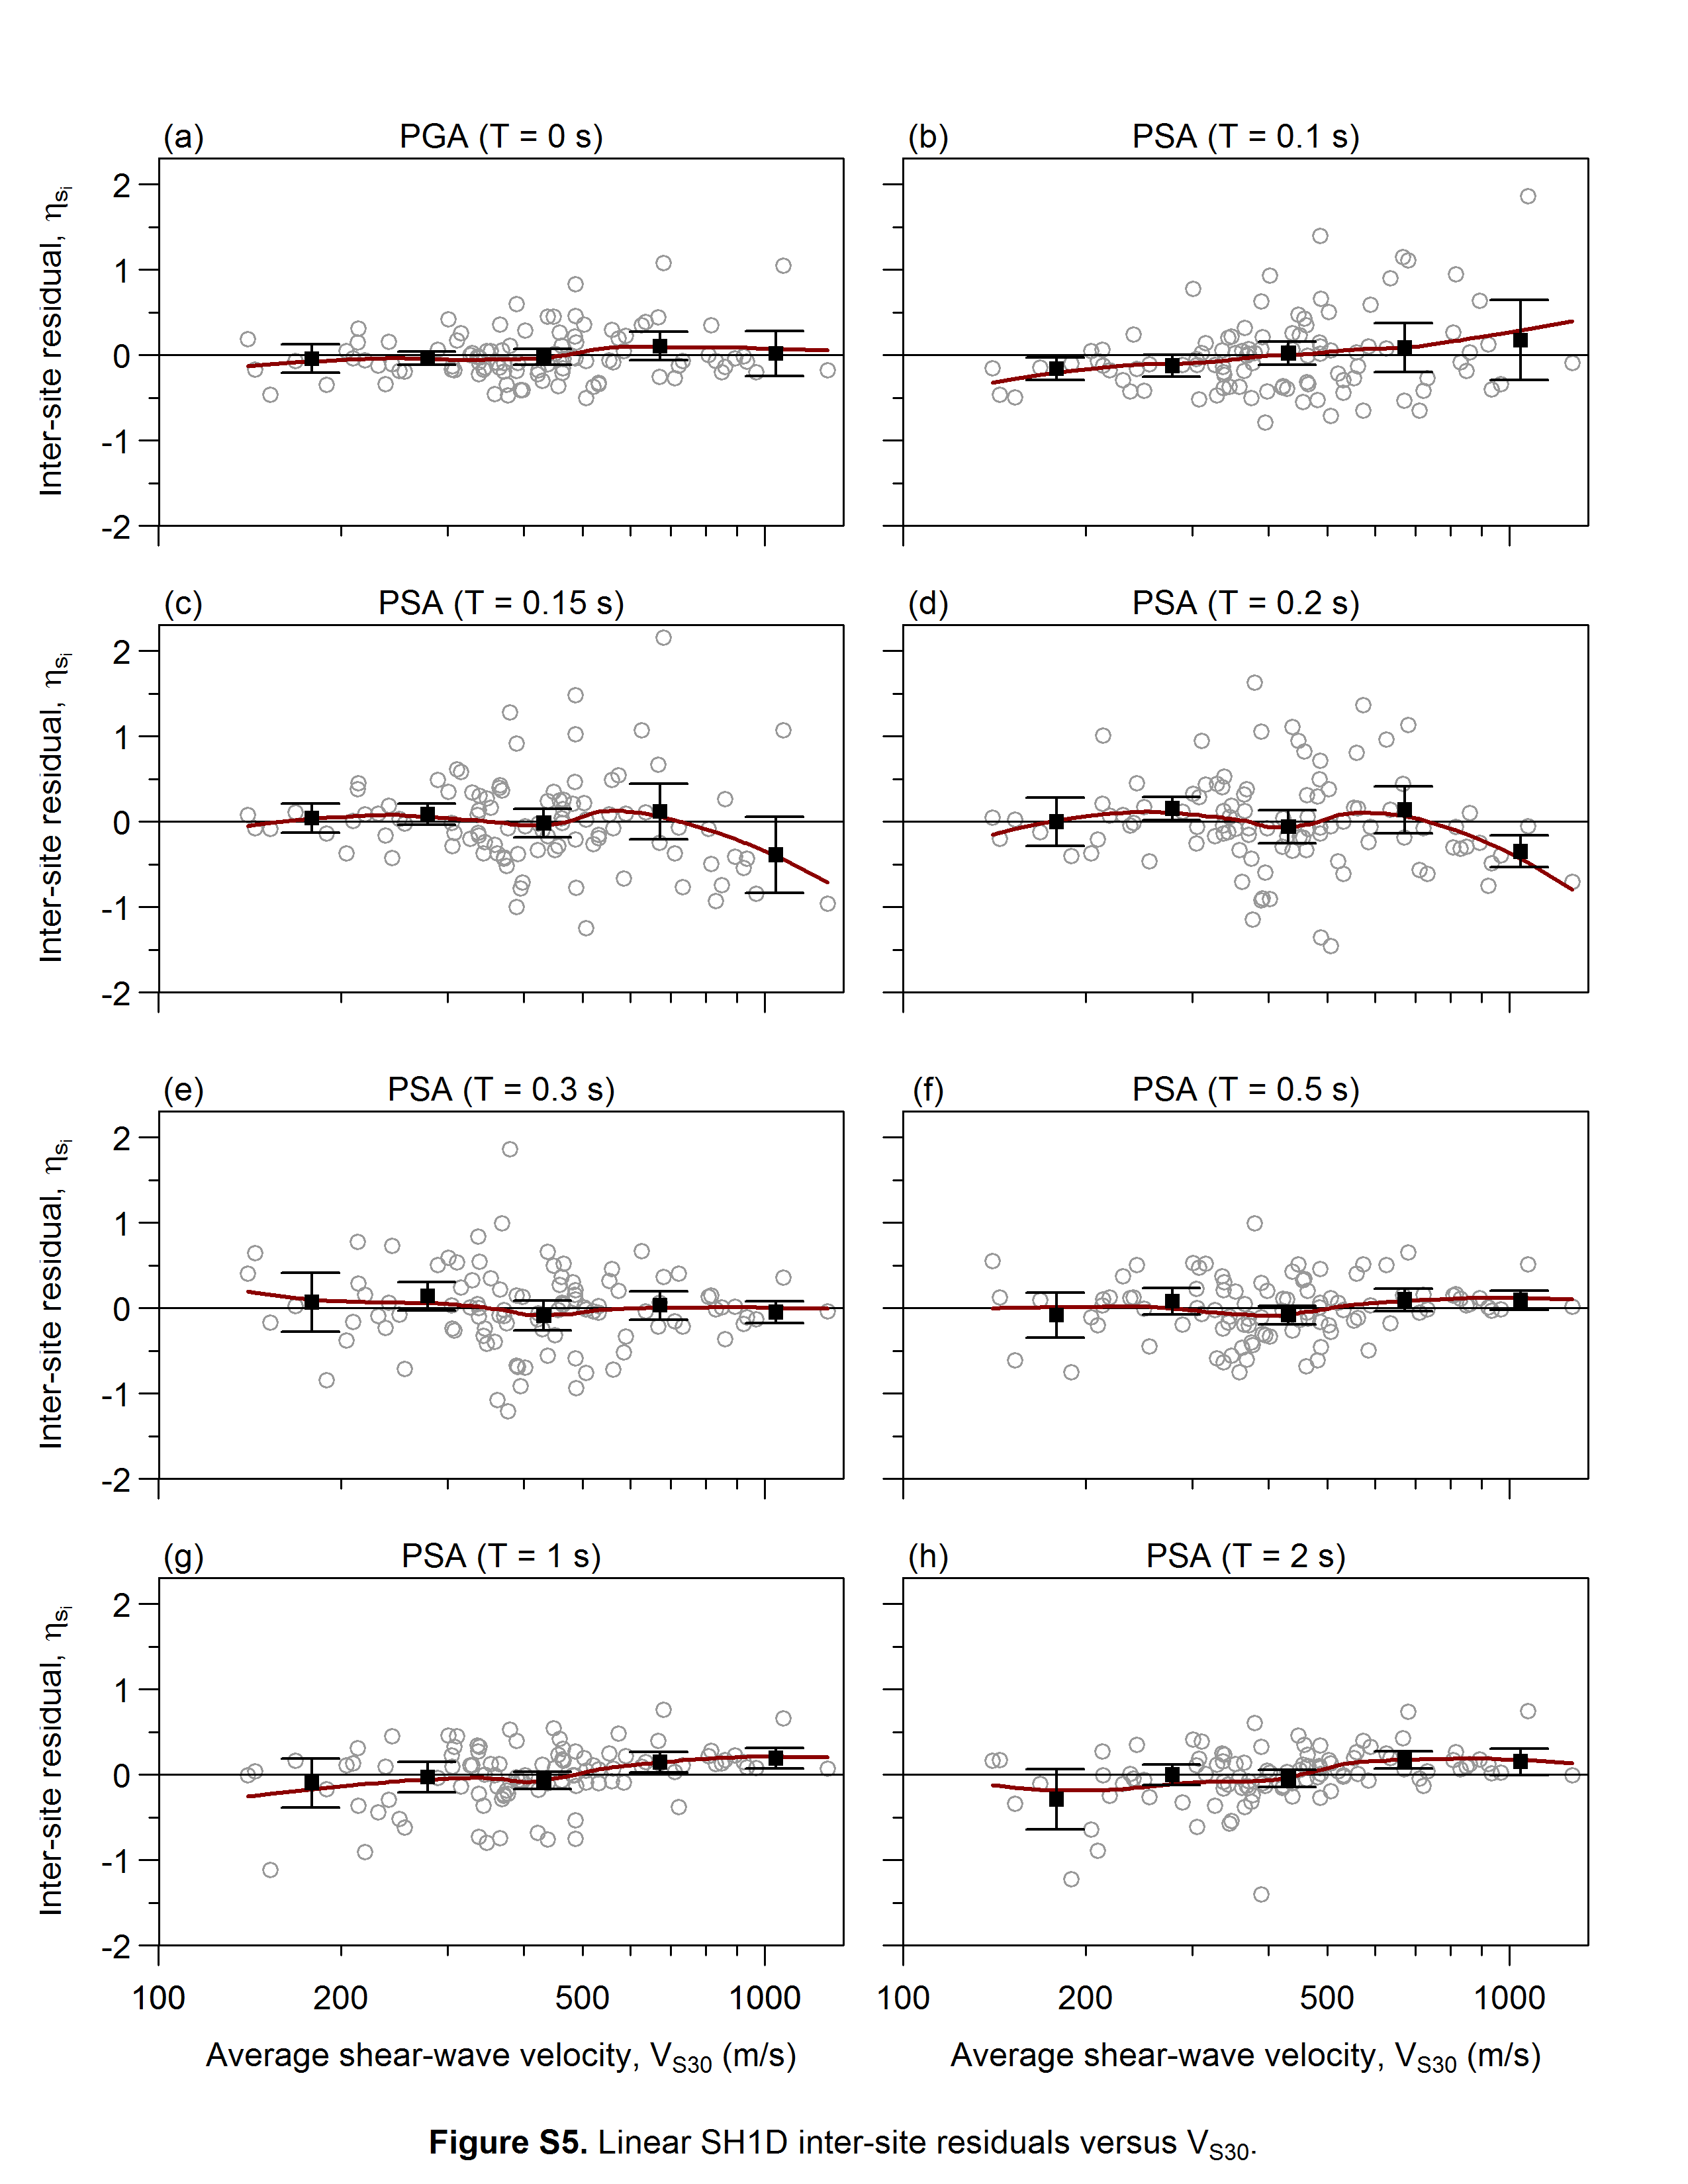
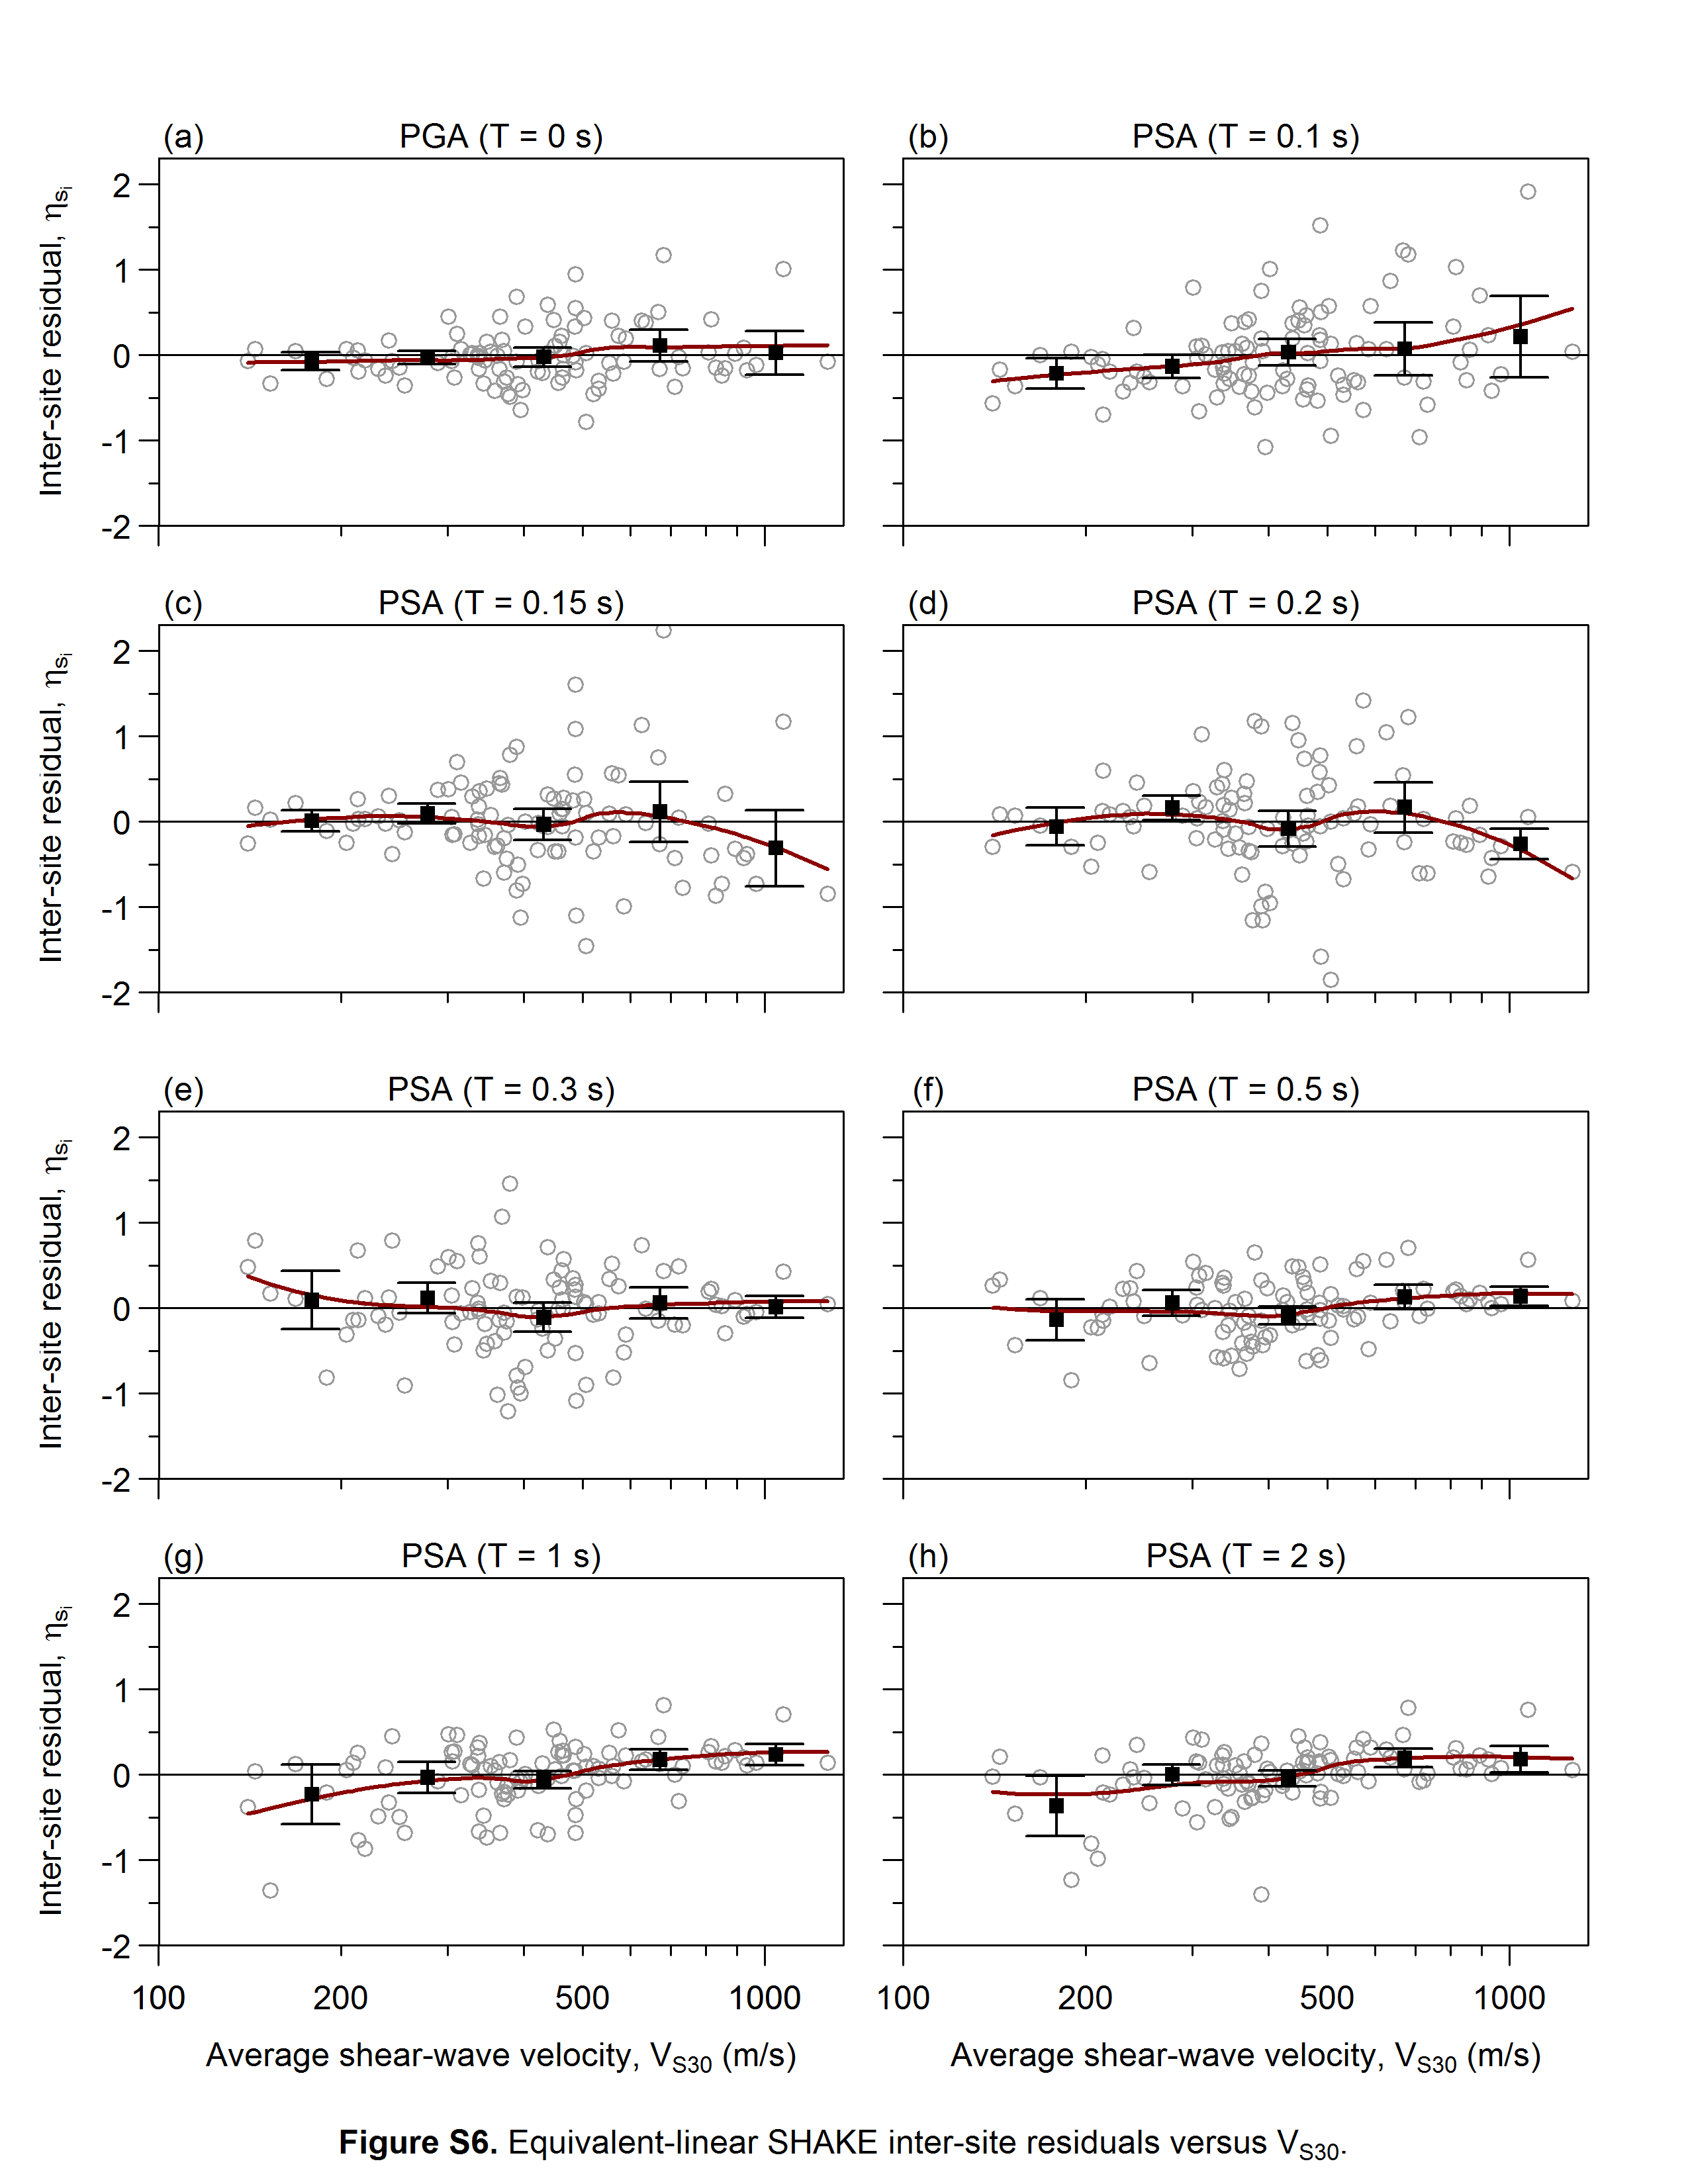
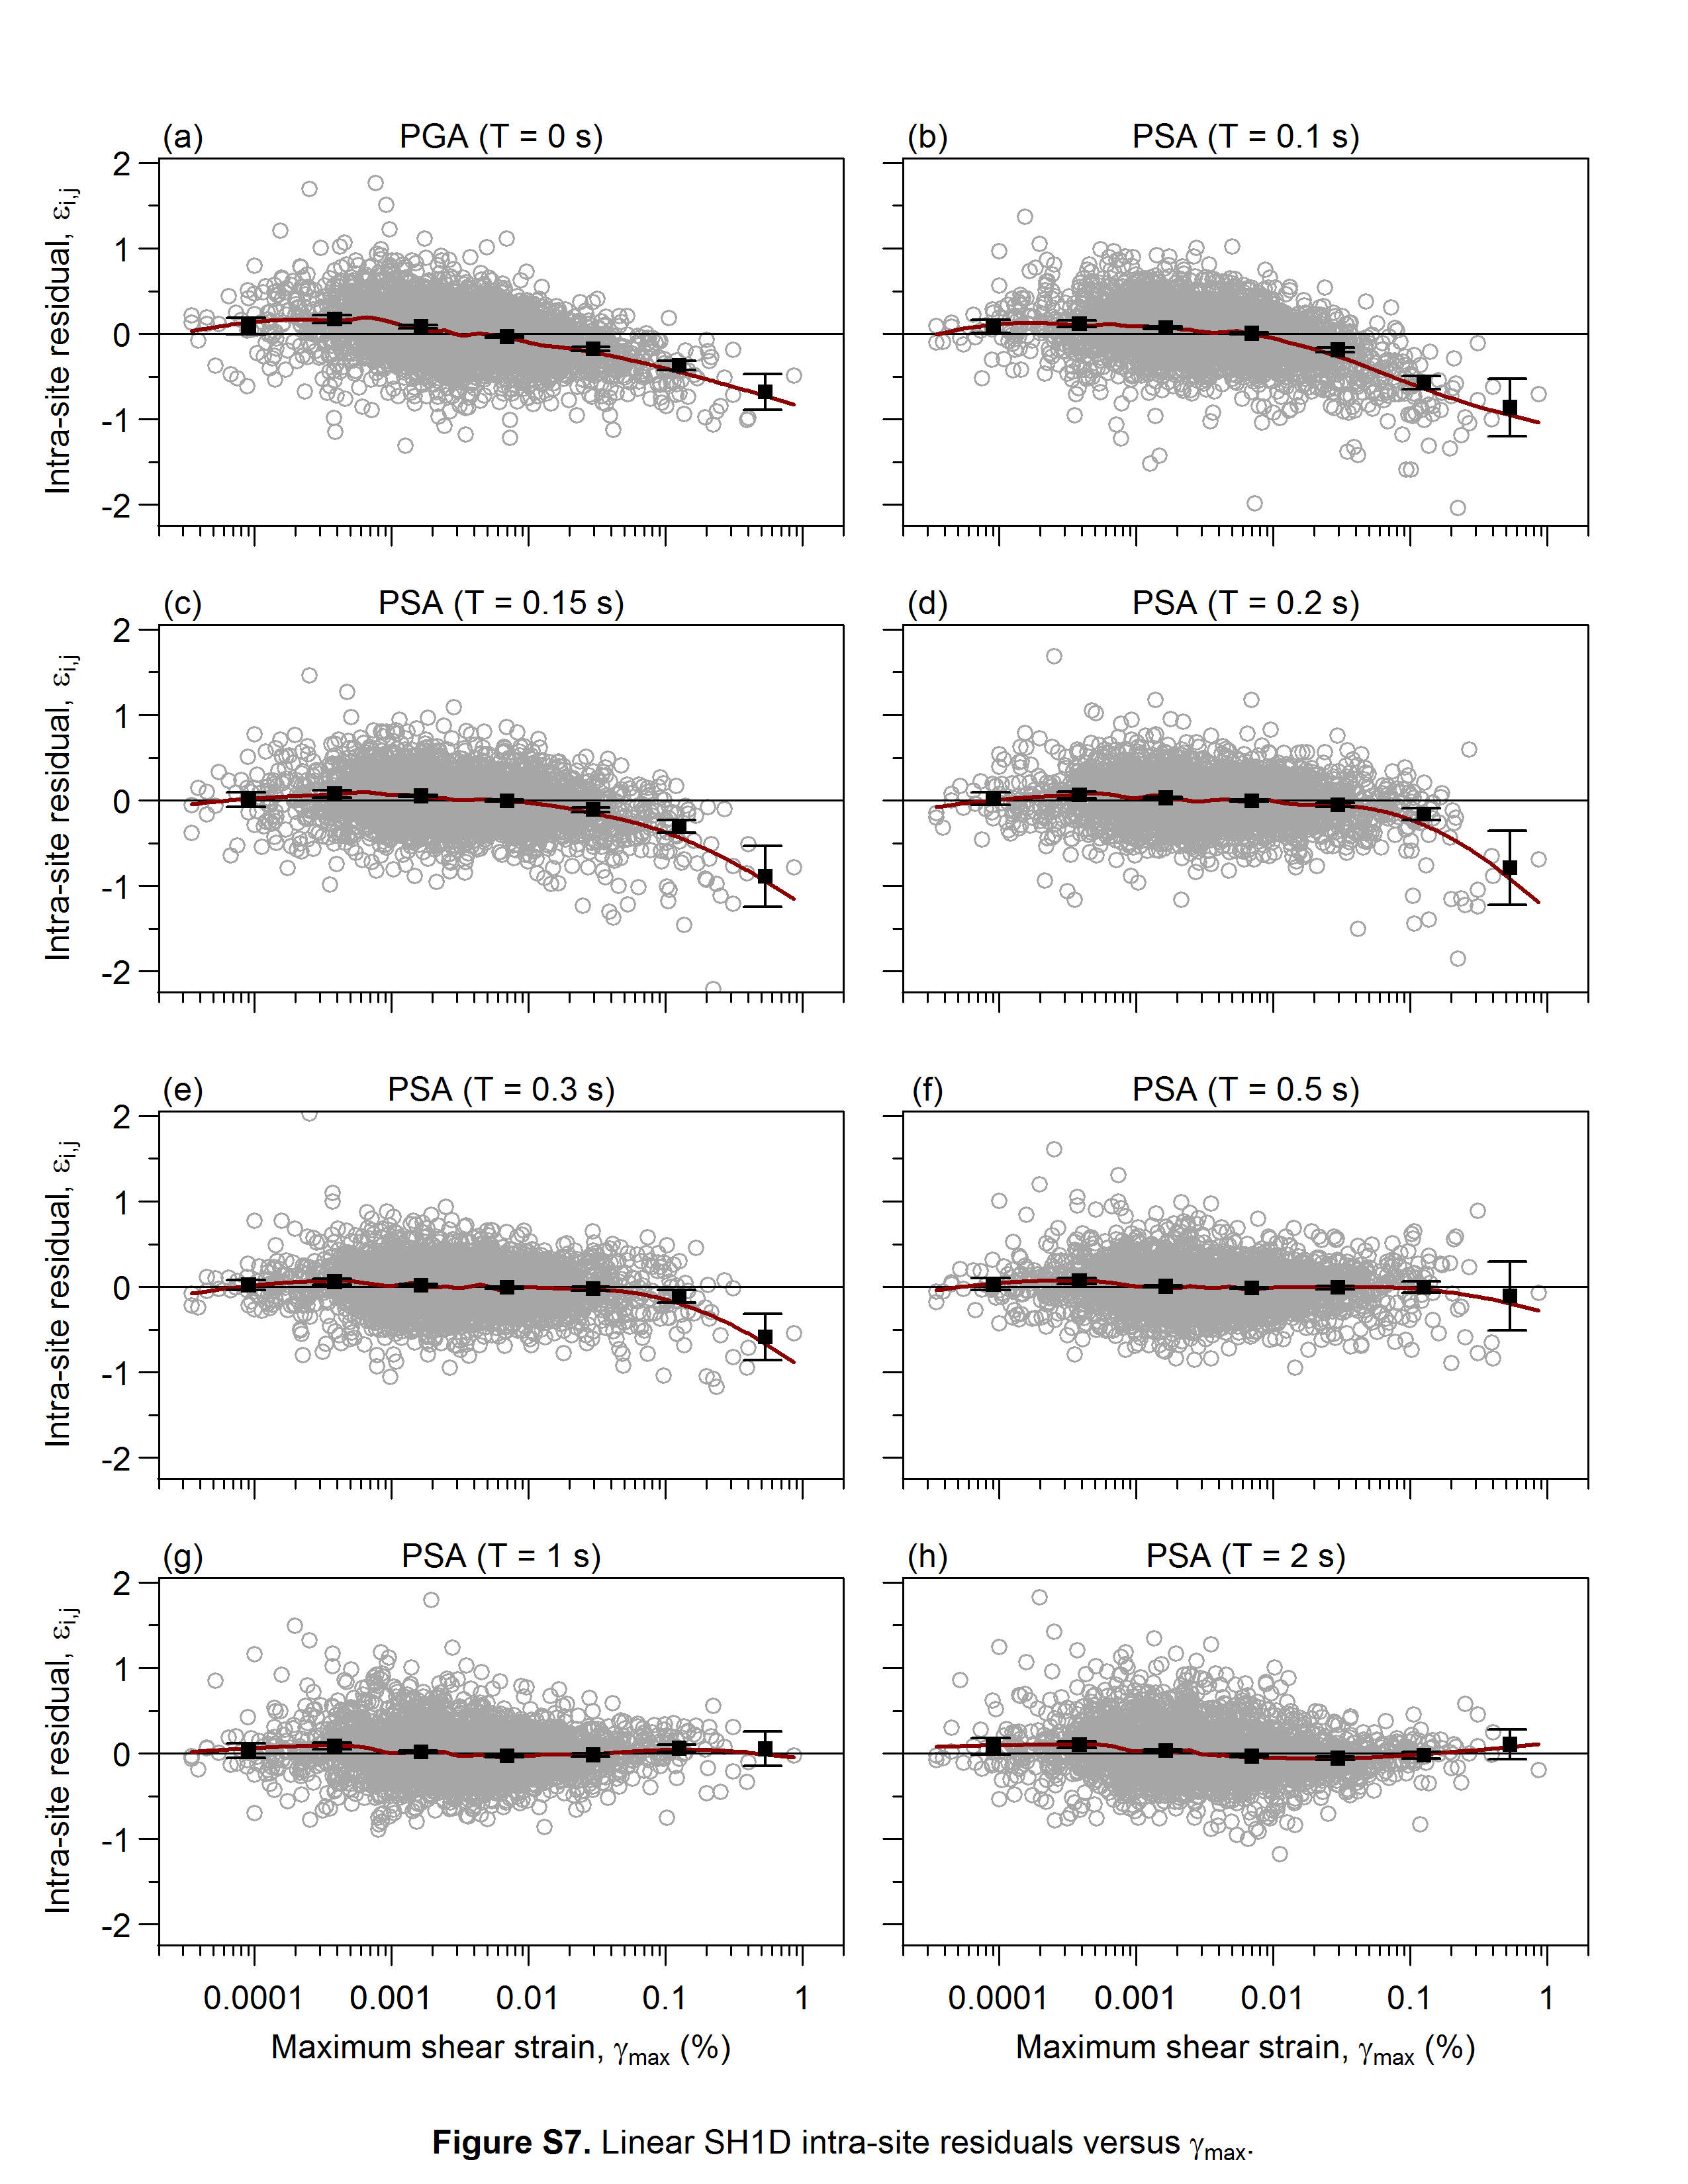
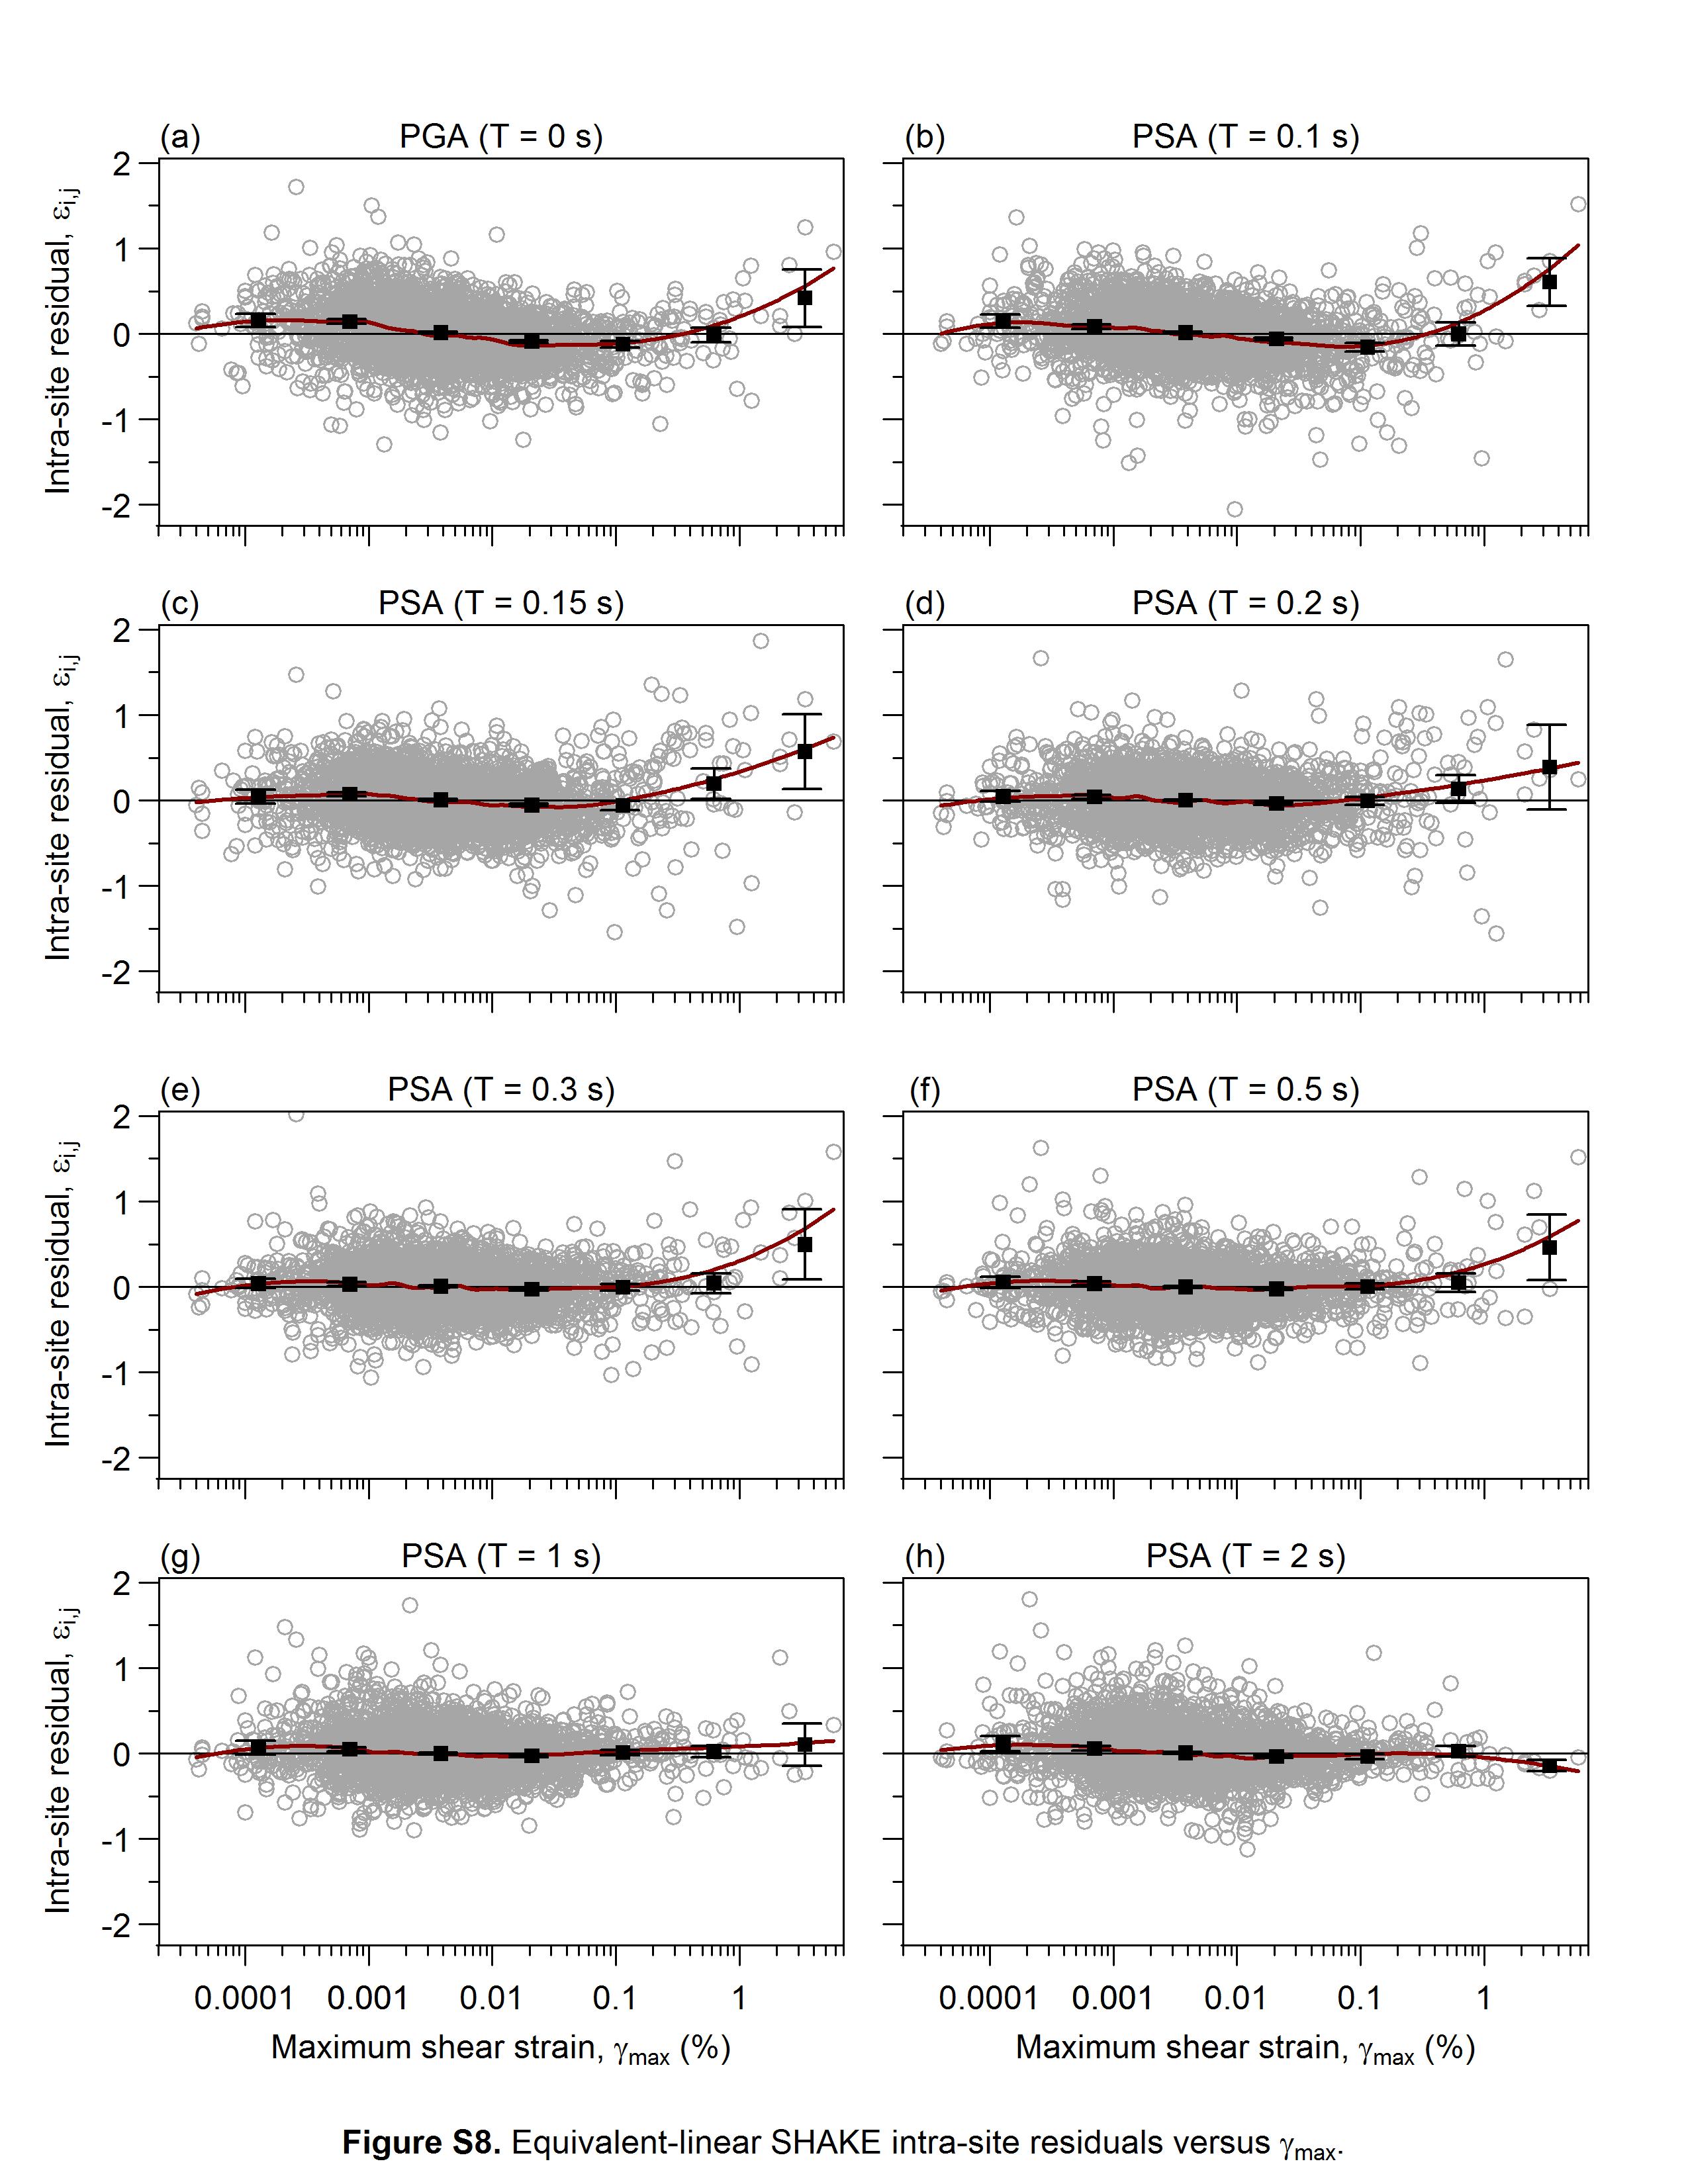
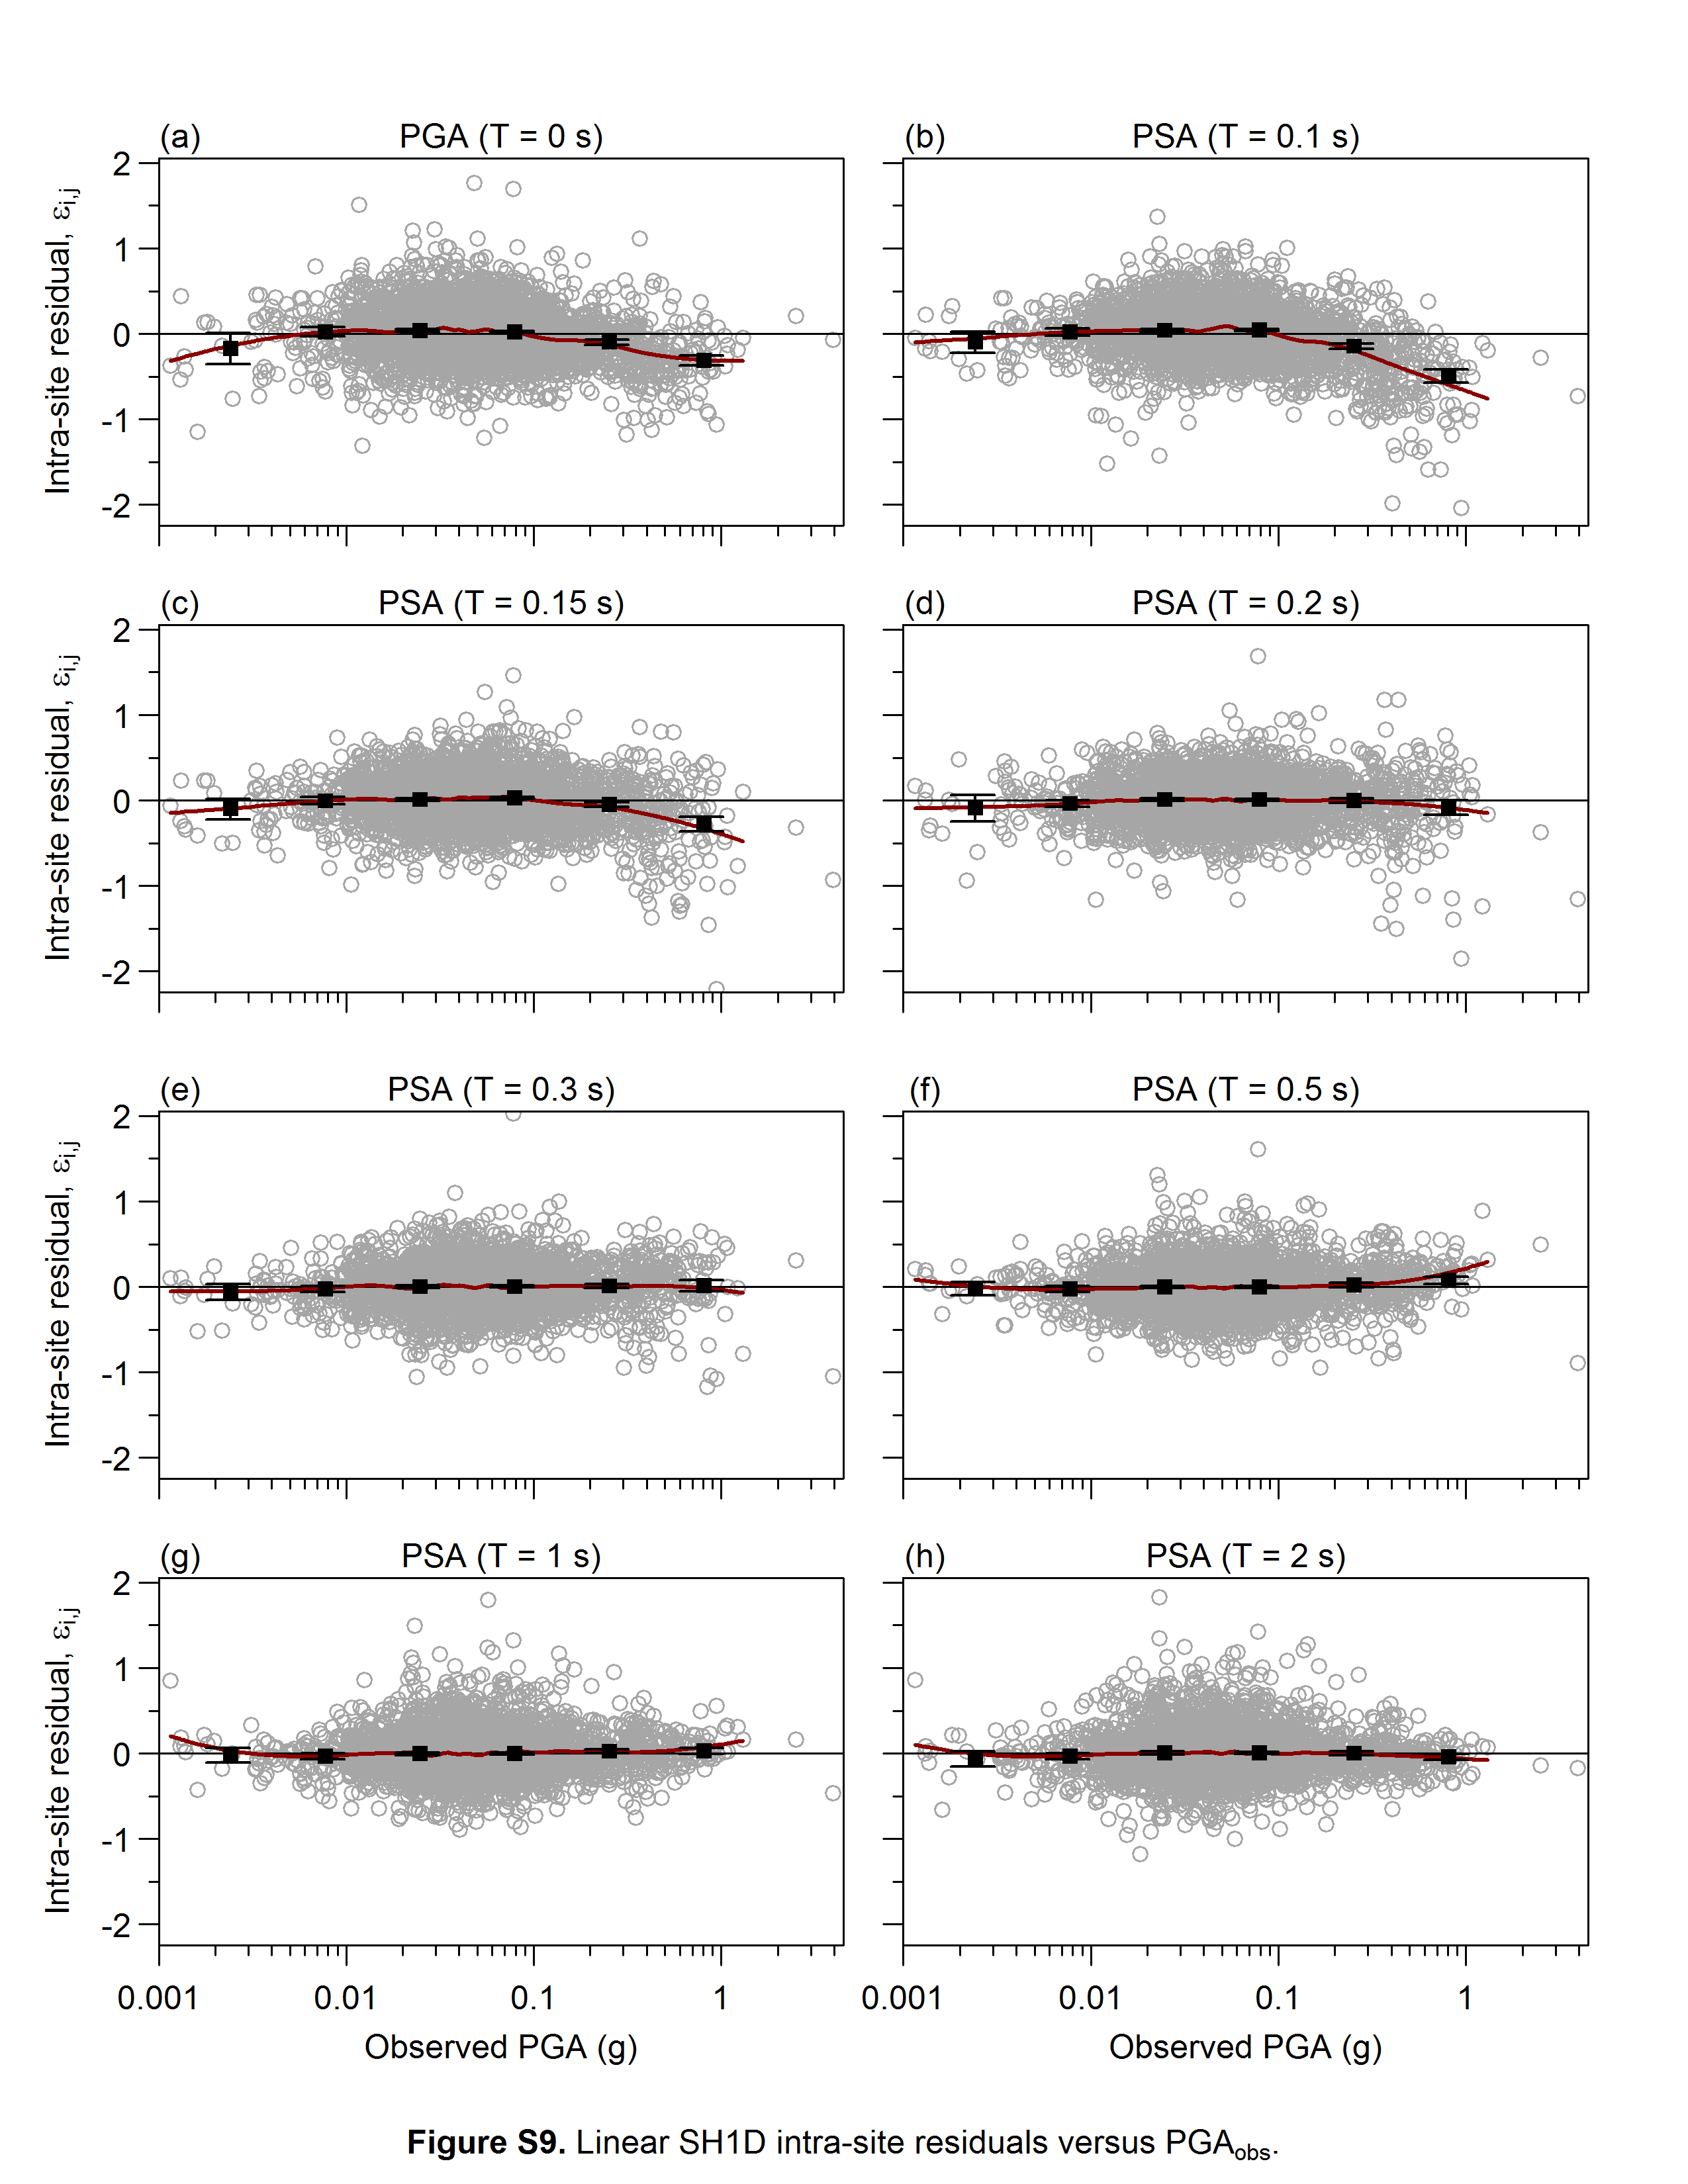
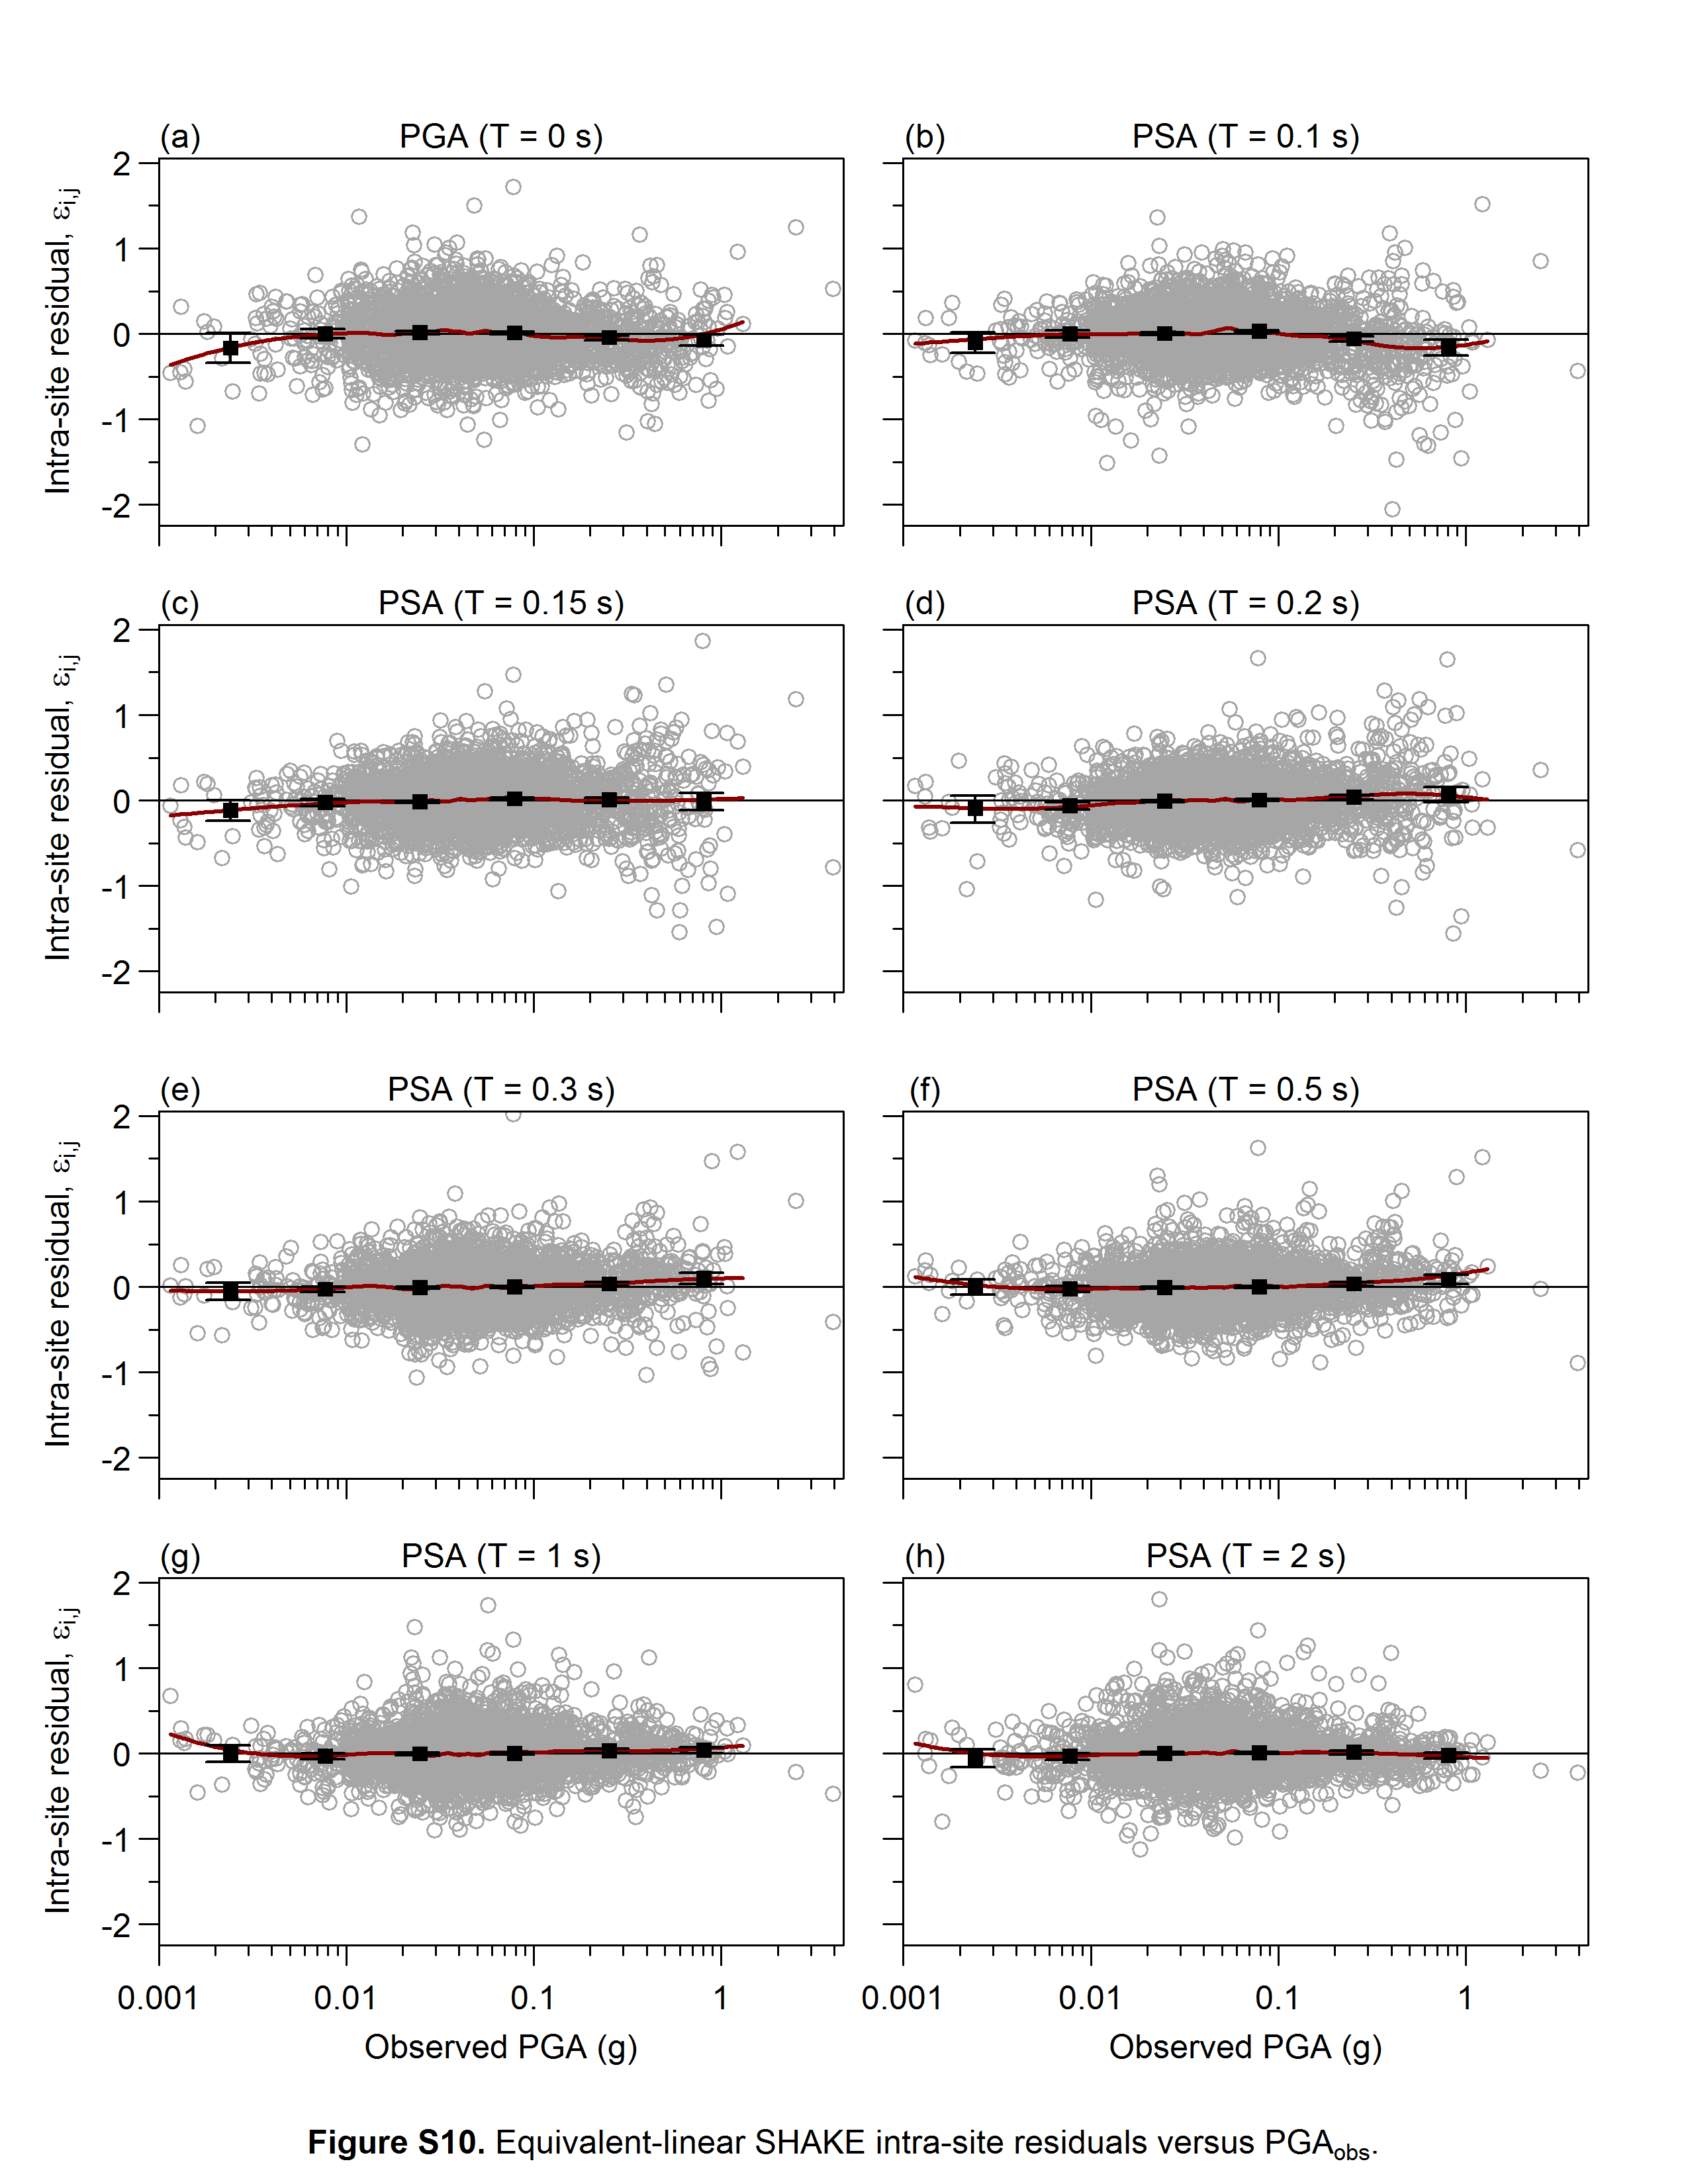
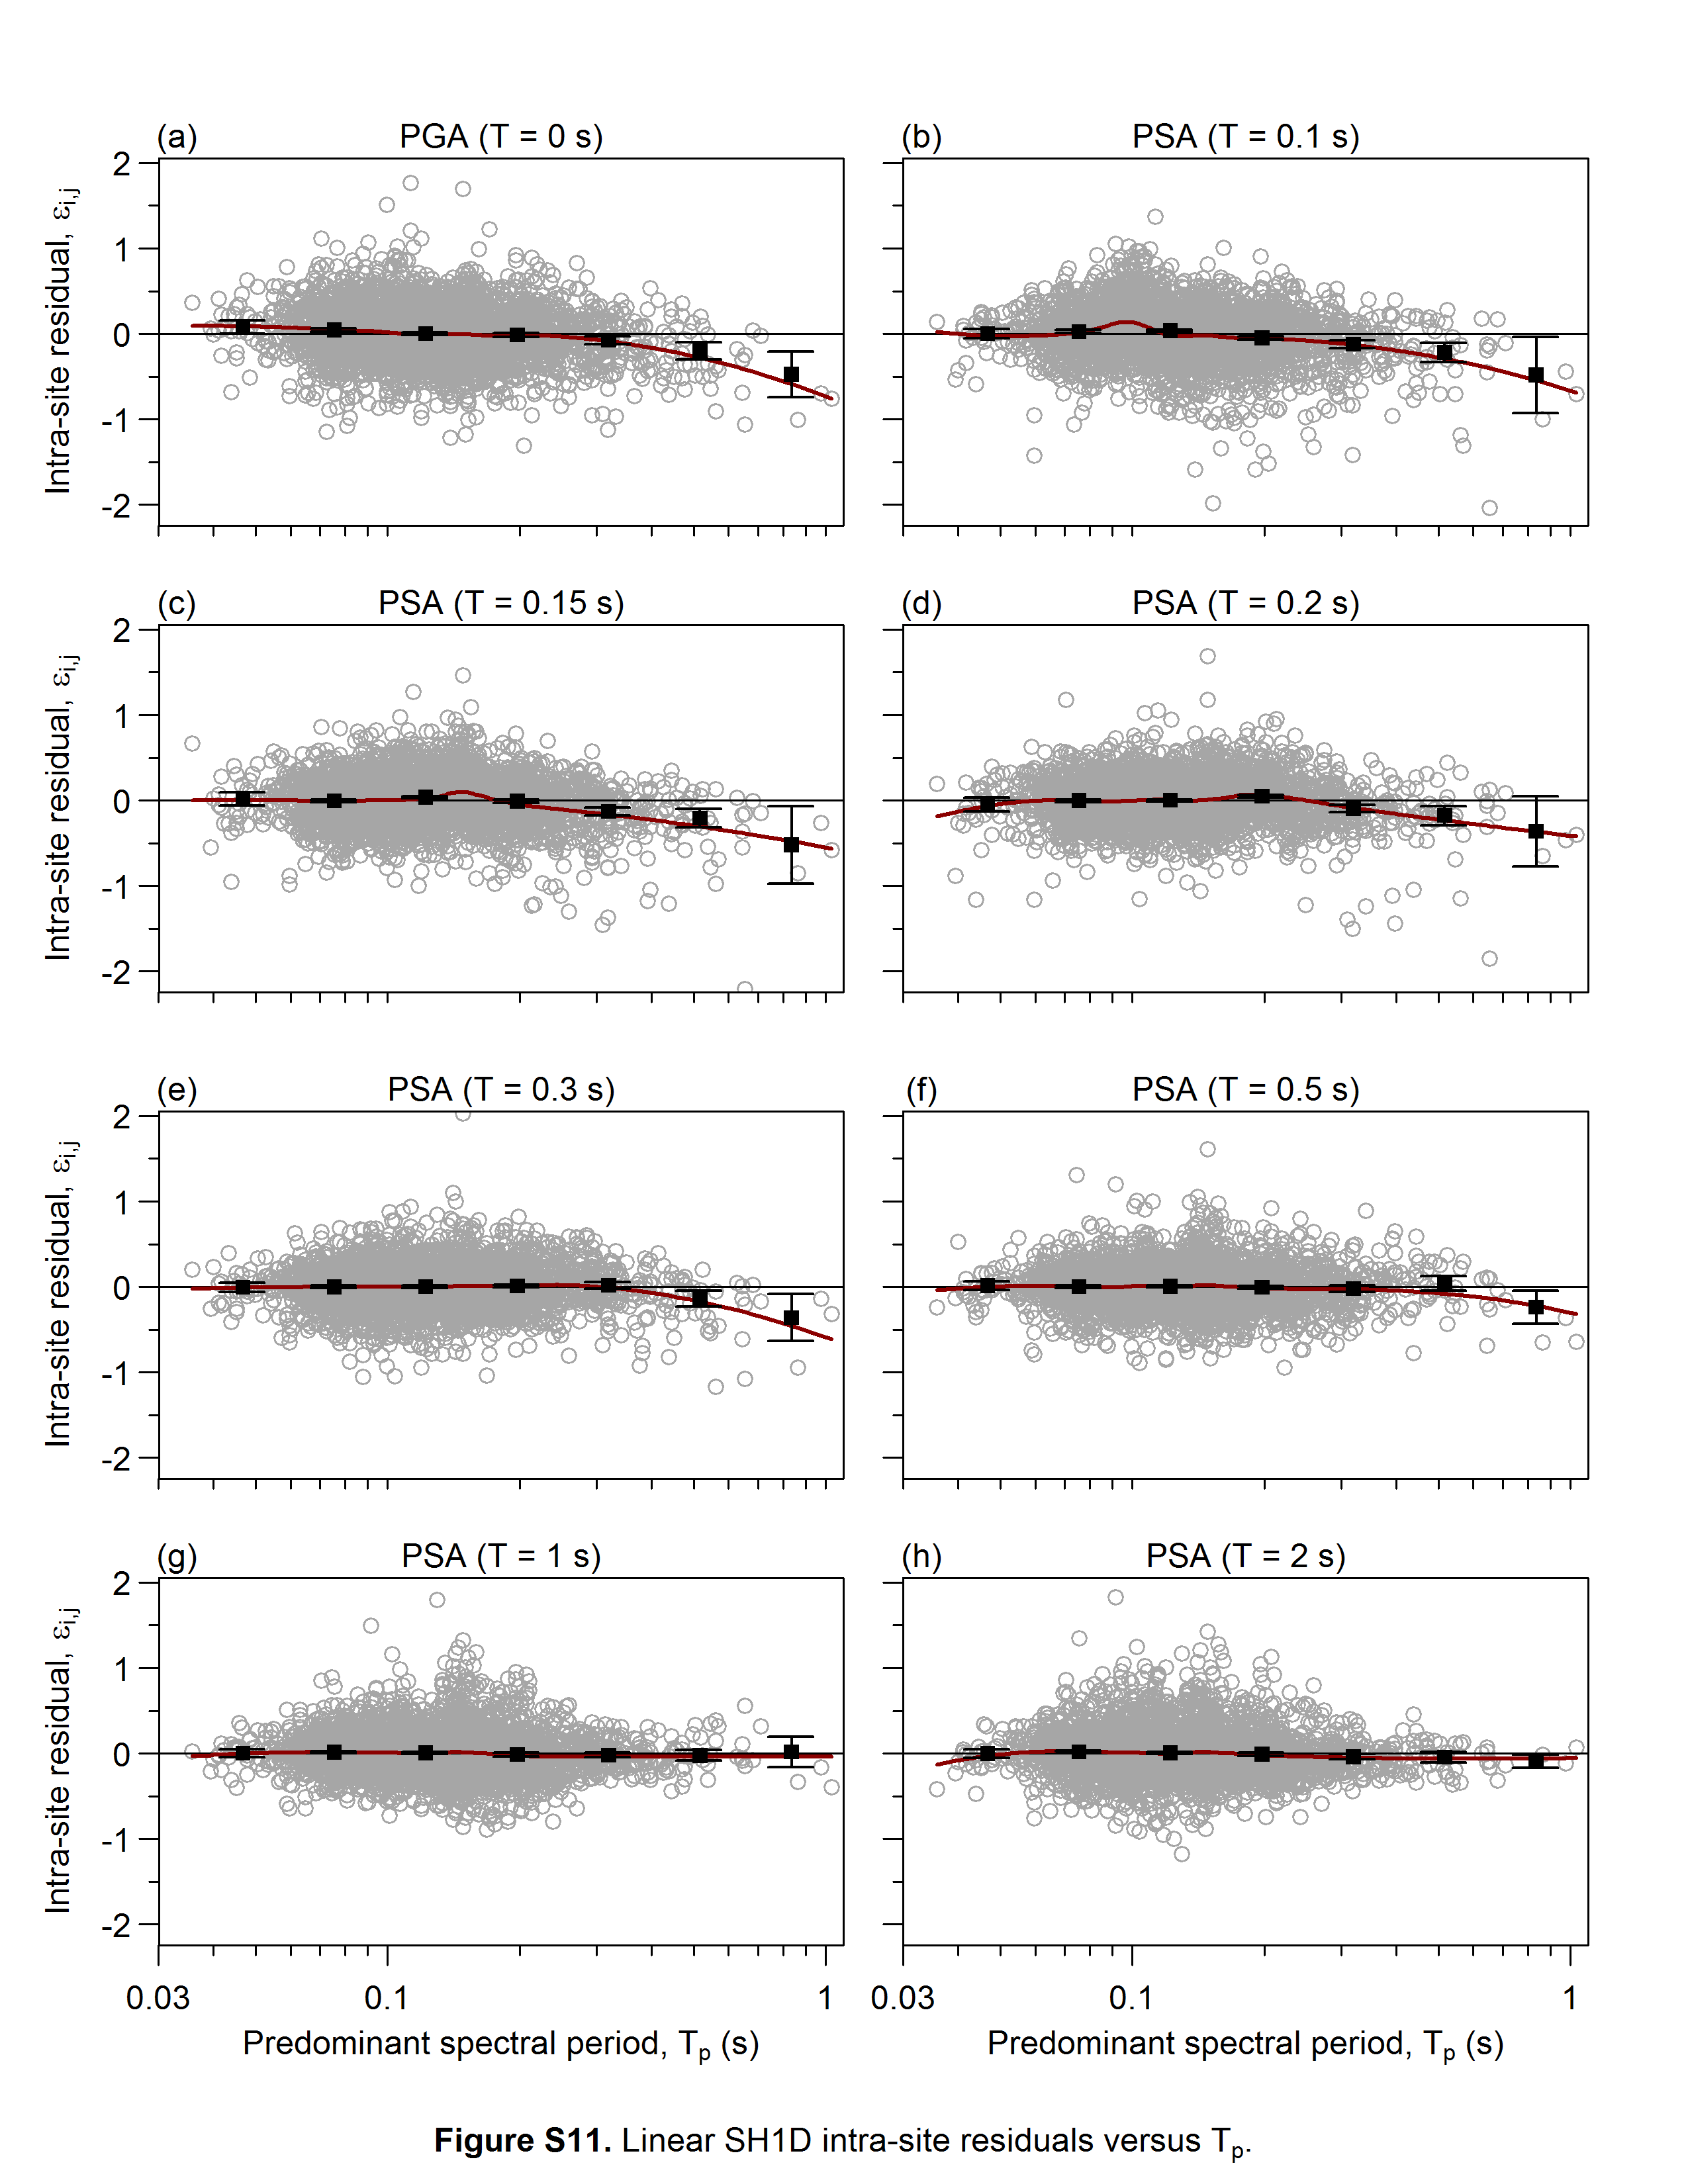
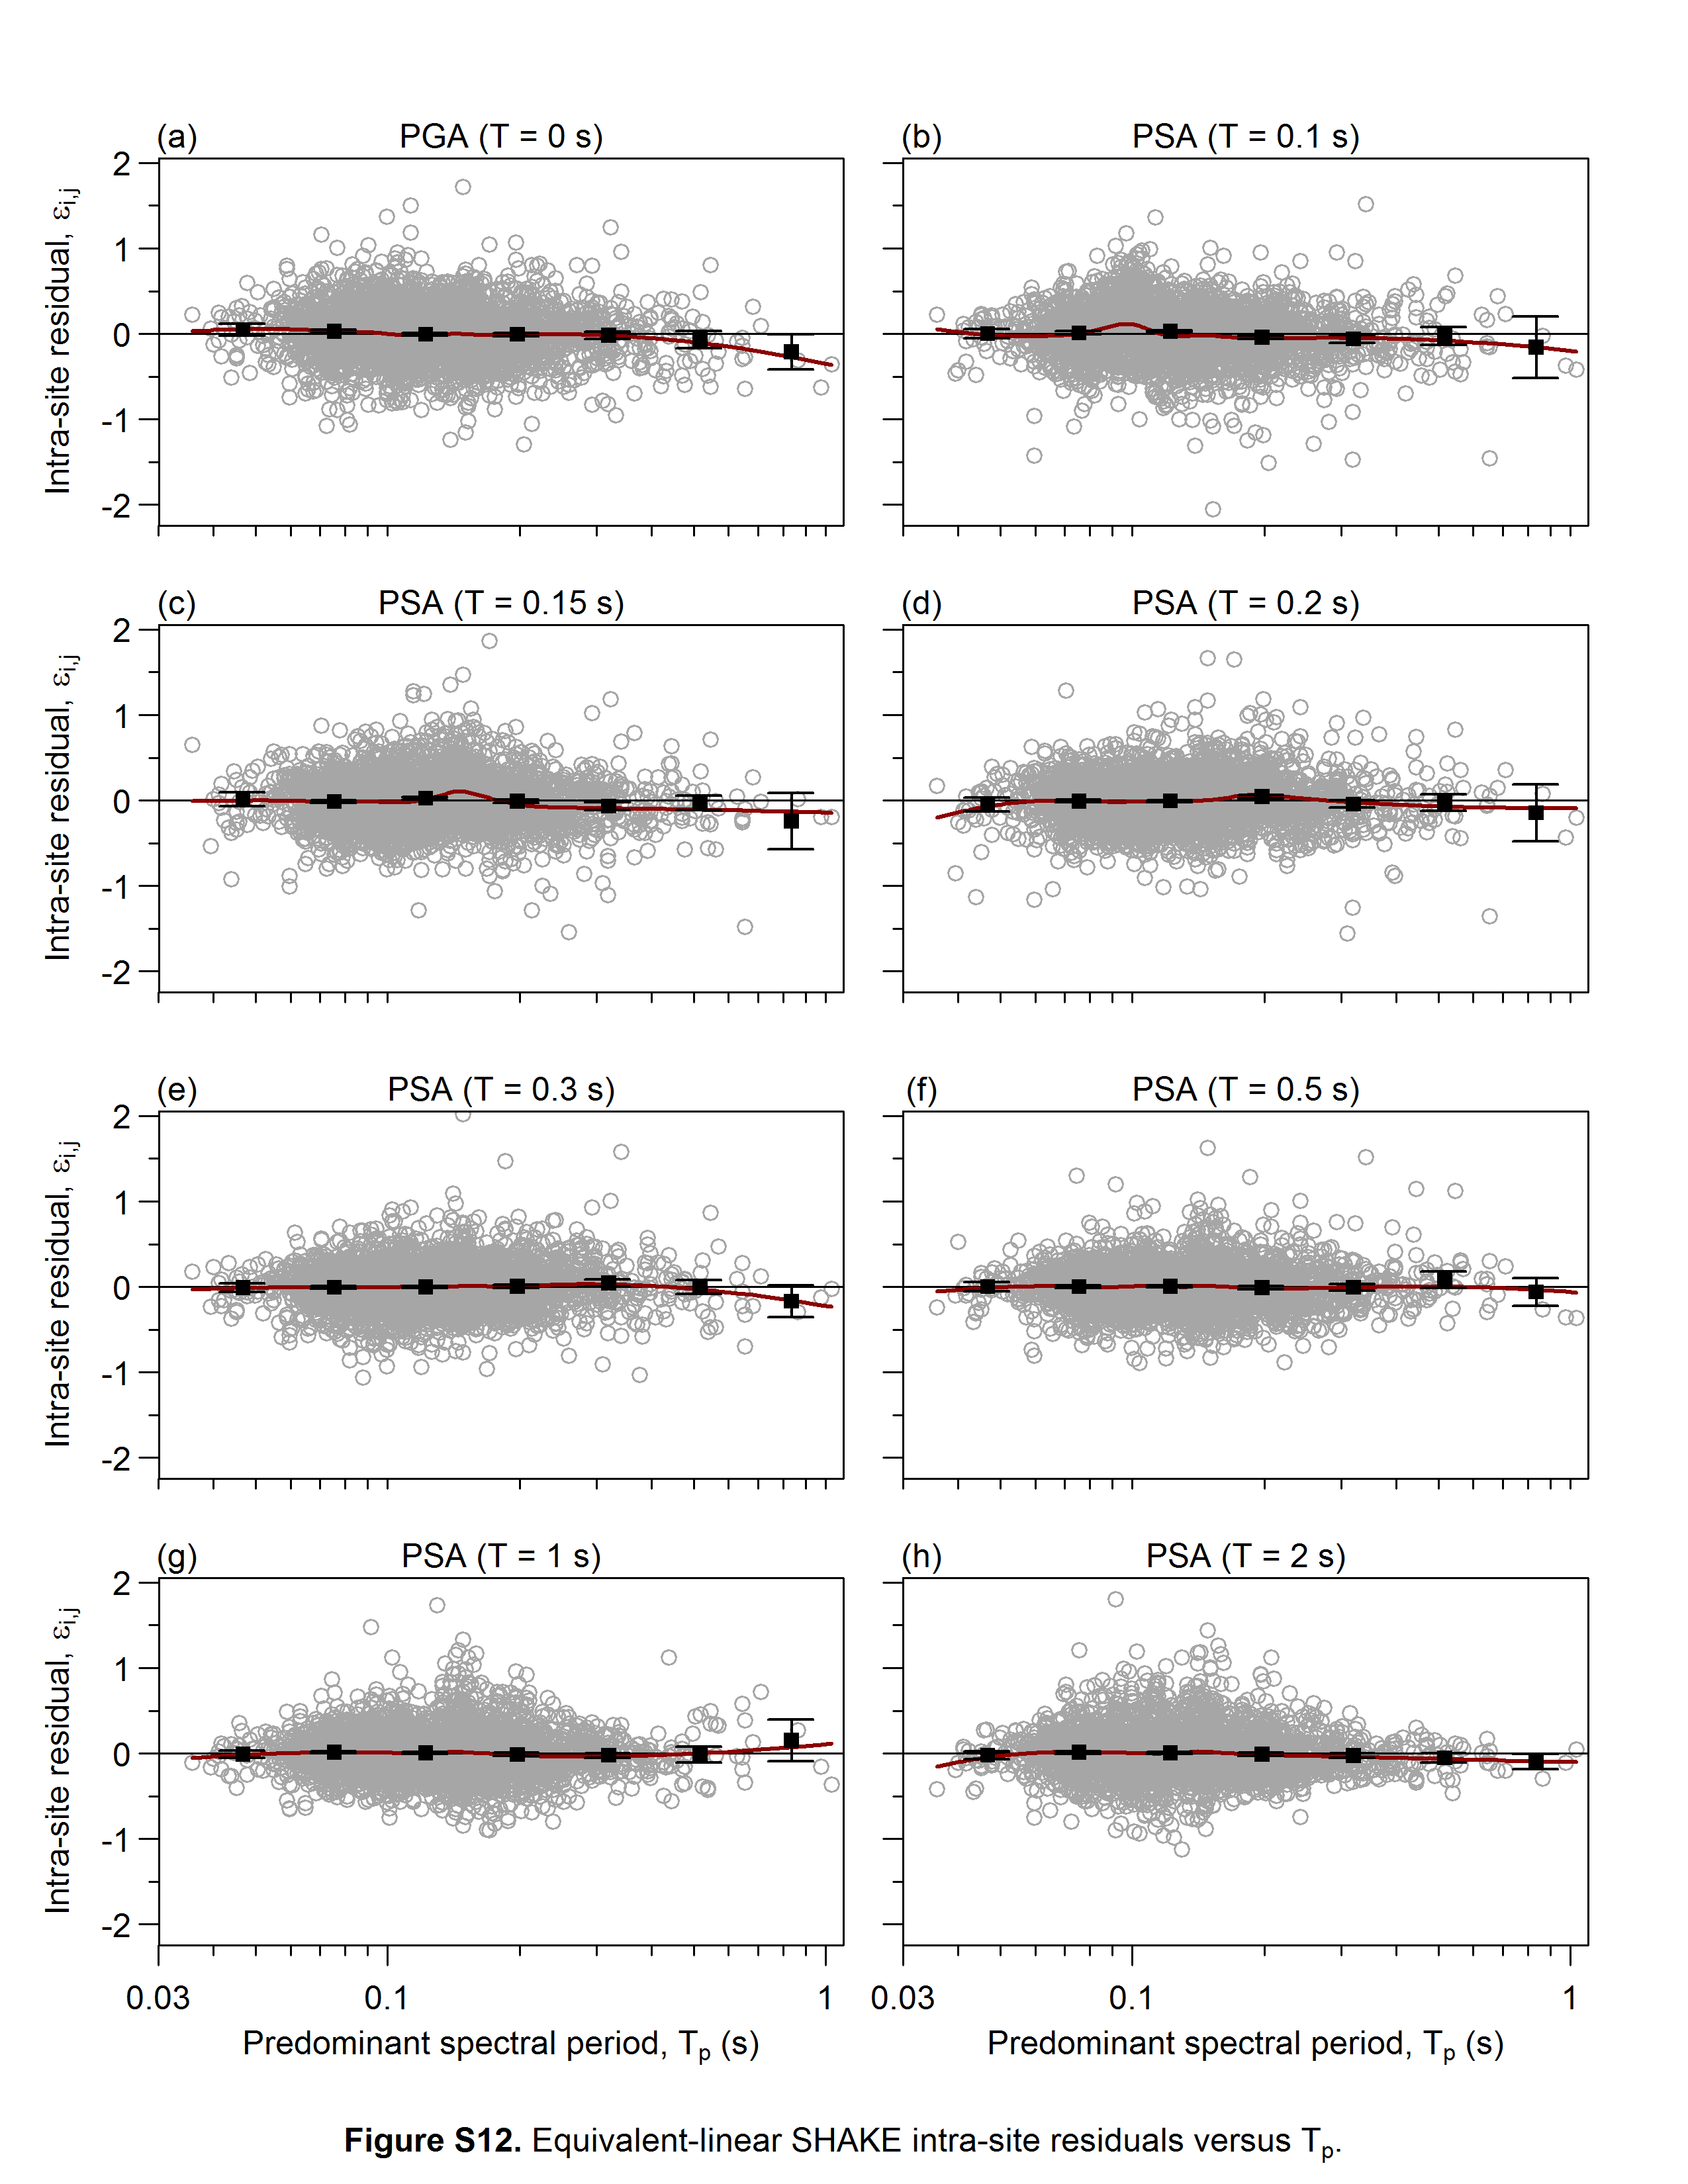
Figures S5 to S12 contain expanded versions of the critical parameter plots in the article, for PSA at spectral periods of 0, 0.1, 0.15, 0.2, 0.3, 0.5, 1.0, and 2.0 s. Plots of the inter-site residuals versus the time-averaged shear-wave velocity over the top 30 m of the subsurface (VS30) are displayed in Figure S5 and Figure S6 for the linear (SH1D) and equivalent-linear (SHAKE) site response analyses, respectively. Plots of the intra-site residuals versus the maximum shear strain in the soil profile (γmax) are shown in Figure S7 (linear) and Figure S8 (equivalent-linear); plots against the observed PGA at the ground surface (PGAobs) are shown in Figure S9 (linear) and Figure S10 (equivalent-linear); and plots against the predominant spectral period of the observed surface ground motion (Tp) are shown in Figure S11 (linear) and Figure S12 (equivalent-linear).
Table S1. Summary table of the 100 KiK-net stations and their site characteristics, including including the time-averaged shear-wave velocity over the top 30 m of the subsurface (VS30), depth to bedrock (Zrock, selected as the depth to the first rock layer in the geologic profile), install depth of the downhole seismometer (Zmax, the base of the profile where the input motion is applied in the site response model), quality factor used in the linear-elastic site response analysis (Q), and number of recorded events used in the analyses (nev).
Figure S1. Plots of (a) ground-motion residuals, (b) intra-site residuals, and (c) inter-site residuals for PGA from the linear site response analyses.
Figure S2. Plots of (a) ground-motion residuals, (b) intra-site residuals, and (c) inter-site residuals for PGA from the equivalent-linear site response analyses.
Figure S3. Plots of (a) ground-motion residuals, (b) intra-site residuals, and (c) inter-site residuals for PSA(T = 1 s) from the linear site response analyses.
Figure S4. Plots of (a) ground-motion residuals, (b) intra-site residuals, and (c) inter-site residuals for PSA(T = 1 s) from the equivalent-linear site response analyses.
Figure S5. Plots of the linear SH1D inter-site residuals versus VS30, drawn for PSA at eight spectral periods (a-h). For each spectral period, we also display an estimate of the trendline, and the binned means and error bars (representing +/- two standard errors).
Figure S6. Plots of the equivalent-linear SHAKE inter-site residuals versus VS30, drawn for PSA at eight spectral periods (a-h). For each spectral period, we also display an estimate of the trendline, and the binned means and error bars (representing +/- two standard errors).
Figure S7. Plots of the linear SH1D intra-site residuals versus the maximum calculated shear strain in the soil profile (γmax), drawn for PSA at eight spectral periods (a-h). For each spectral period, we also display an estimate of the trendline, and the binned means and error bars (representing +/- two standard errors).
Figure S8. Plots of the equivalent-linear SHAKE intra-site residuals versus the maximum calculated shear strain in the soil profile (γmax), drawn for PSA at eight spectral periods (a-h). For each spectral period, we also display an estimate of the trendline, and the binned means and error bars (representing +/- two standard errors).
Figure S9. Plots of the linear SH1D intra-site residuals versus the observed PGA at the ground surface, drawn for PSA at eight spectral periods (a-h). For each spectral period, we also display an estimate of the trendline, and the binned means and error bars (representing +/- two standard errors). For bins with fewer than five observations, we omit the trendline and error bars.
Figure S10. Plots of the equivalent-linear SHAKE intra-site residuals versus the observed PGA at the ground surface, drawn for PSA at eight spectral periods (a-h). For each spectral period, we also display an estimate of the trendline, and the binned means and error bars (representing +/- two standard errors). For bins with fewer than five observations, we omit the trendline and error bars.
Figure S11. Plots of the linear SH1D intra-site residuals versus the predominant spectral period of the observed surface ground motion (Tp), drawn for PSA at eight spectral periods (a-h). For each spectral period, we also display an estimate of the trendline, and the binned means and error bars (representing +/- two standard errors).
Figure S12. Plots of the equivalent-linear SHAKE intra-site residuals versus the predominant spectral period of the observed surface ground motion (Tp), drawn for PSA at eight spectral periods (a-h). For each spectral period, we also display an estimate of the trendline, and the binned means and error bars (representing +/- two standard errors).
[ Back ]