The electronic supplement contains tables of station coordinates and tremor event parameters and figures of the moving−window grid−search (MWGS) test with local earthquakes, tremor triggered by the 2011 Tohoku−Oki earthquake, and additional examples of detected ambient tremors.
Table S1. Station coordinates of the Liouguei (LG) array.
Table S2. Station coordinates of the Lidao (LD) array.
Table S3. Parameters of the nine triggered tremor bursts.
Table S4. Parameters of detected tremor by the combined broadband frequency–wavenumber (BBFK)–MWGS method.
Table S5. Parameters for the eight migrating tremor events.
Figure S1. (a) The origin waveform, (b) 5−20 Hz band-passed waveform, and (c) the corresponding spectrogram of station F5 of the LG array. The 2011 Tohoku-Oki mainshock triggered nonvolcanic tremor (NVT) activity, which contains nine clear bursts with frequency reaching to 20 Hz at the LG array. The frequency content of the 2011 Tohoku-Oki mainshock is up to 10 Hz, and those of other aftershocks (pointed by arrows) are between 5 and 10 Hz.
Figure S2. Deep tremor triggered by the 2011 Mw 9.0 Tohoku-Oki earthquake recorded at the LD array. From top to bottom: (a) the 5 Hz high-pass envelope function, (b) spectrogram, and (c) the 5−20 Hz band-pass filtered seismograms recorded nine tremor bursts triggered by the mainshock.
Figure S3. The individual and mean time drifts of TEXAN data loggers during each of the three-week acquisitions.
Figure S4. Back-azimuth (BAZ) differences between the BBFK and the envelope cross-correlation (WECC) methods among the nine triggered tremor bursts for both arrays.
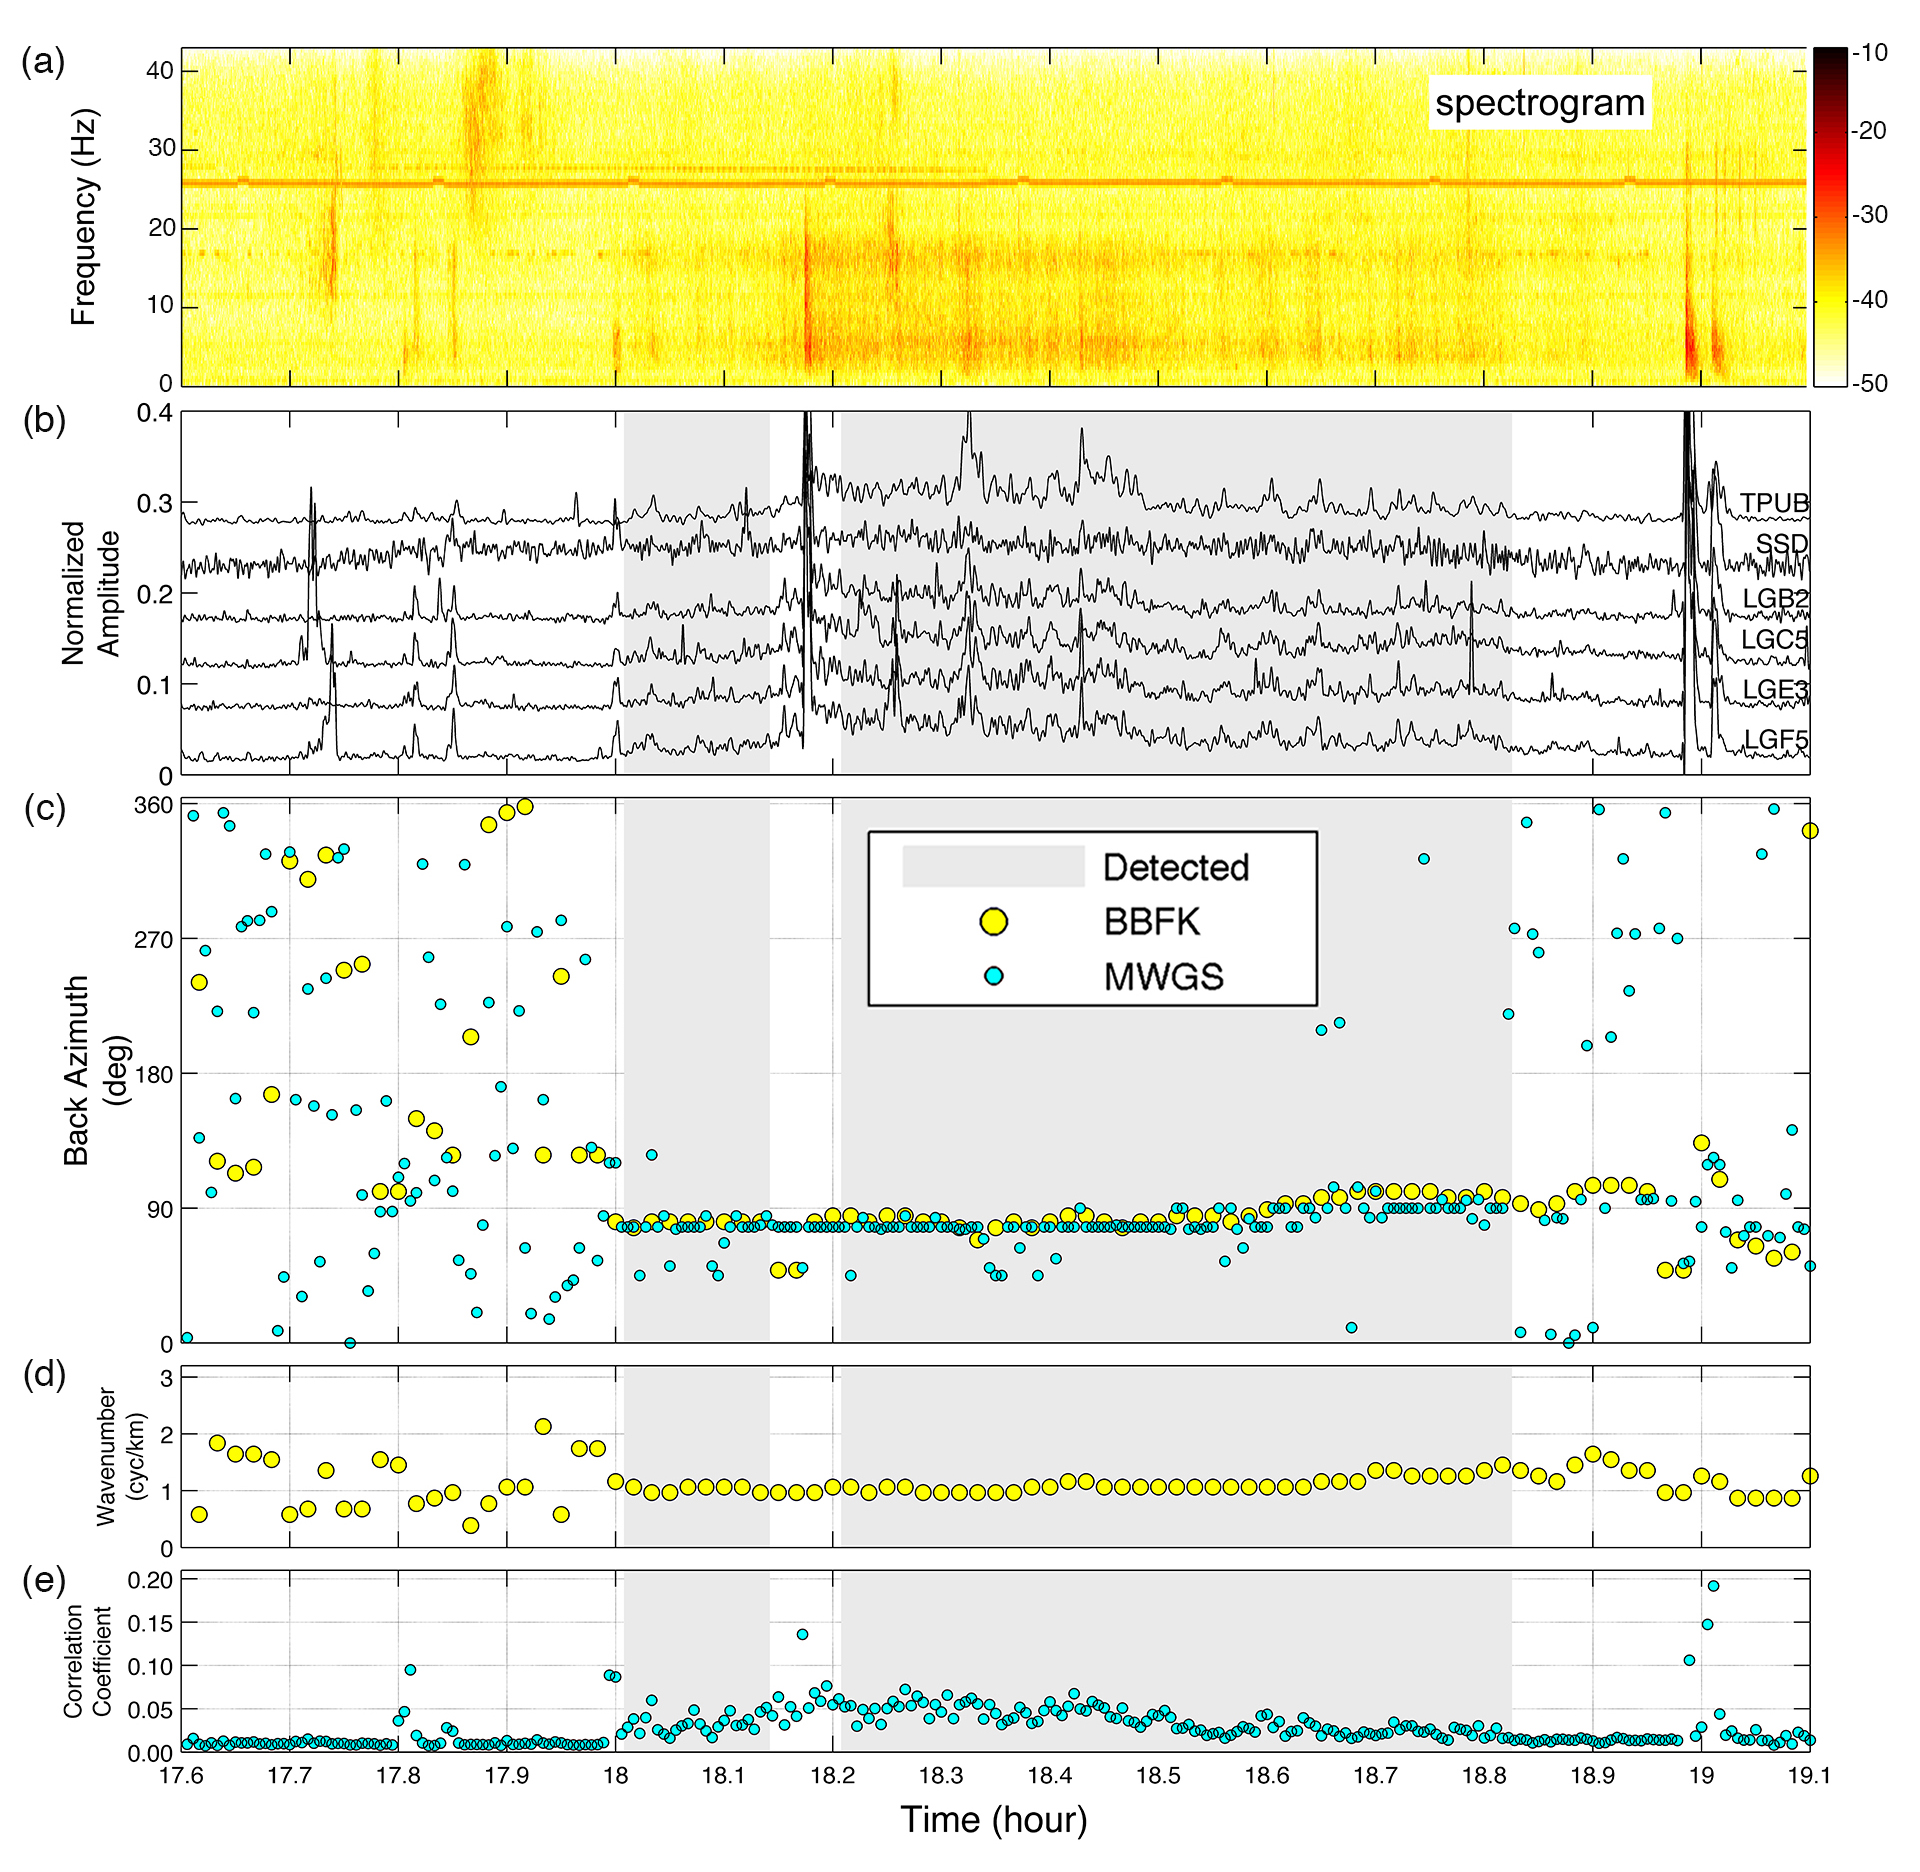
Figure S5. An example of ambient tremor detected only by our combined BBFK–MWGS method. (a–e) The spectrogram, normalized envelope function, back azimuth, wavenumber, and correlation coefficient versus UTC time on 2011 Julian day 179. The shaded areas mark the tremor period and other symbols and notations are marked in the legend.
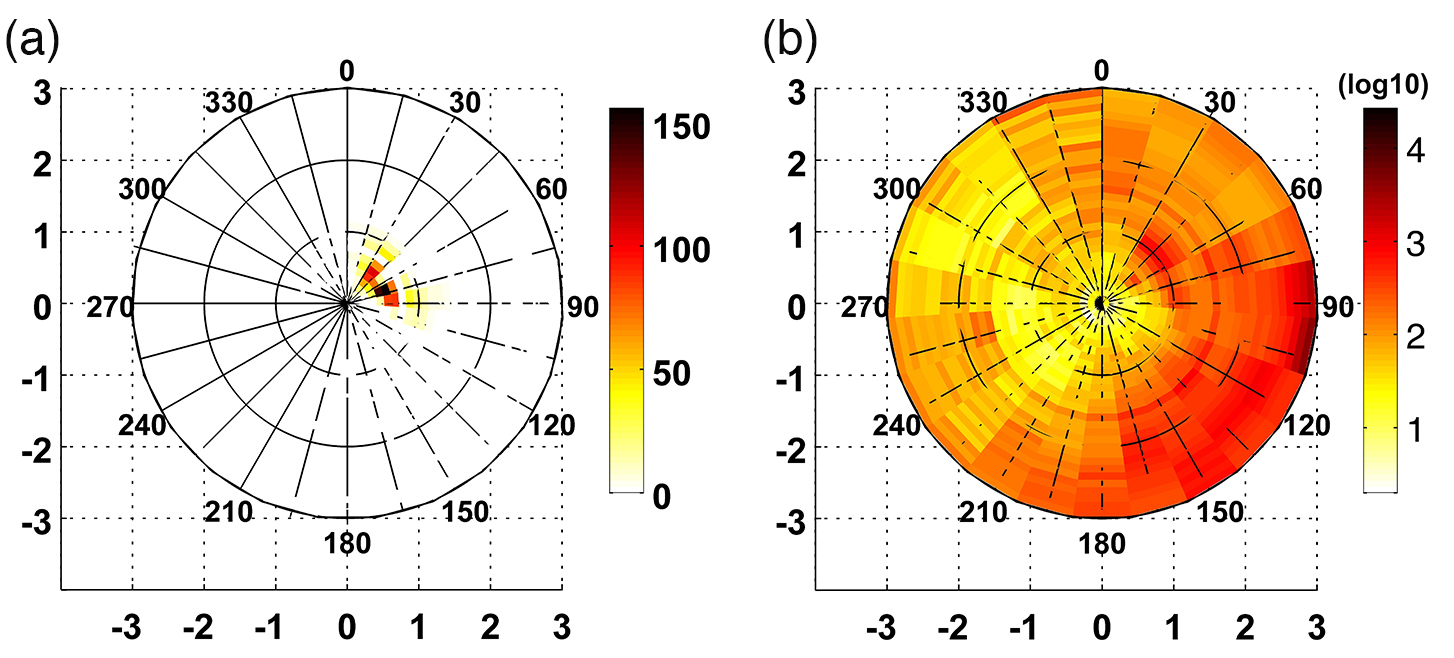
Figure S6. The distribution of back−azimuth and wavenumber of the BBFK method at the LG array: (a) the 1481-minute detected tremor sources and (b) the total data points (192,558 min). The polarizations are sorted into 24 ×10 bins for back azimuth (0−360°) and wavenumber (0−3 cycle/km) in the angular and radial directions, respectively.
[ Back ]