This electronic supplement includes a table summarizing the previous study results and figures showing the relationship between peak ground acceleration (PGA) and intensity.
Table S1. Assignment of regional similarities for ShakeMap Atlas PGA data. For each region in this Atlas dataset, we list the number of observations, average residuals, and standard deviation before and after the correction, the region associated, and the corresponding power of the t-test.
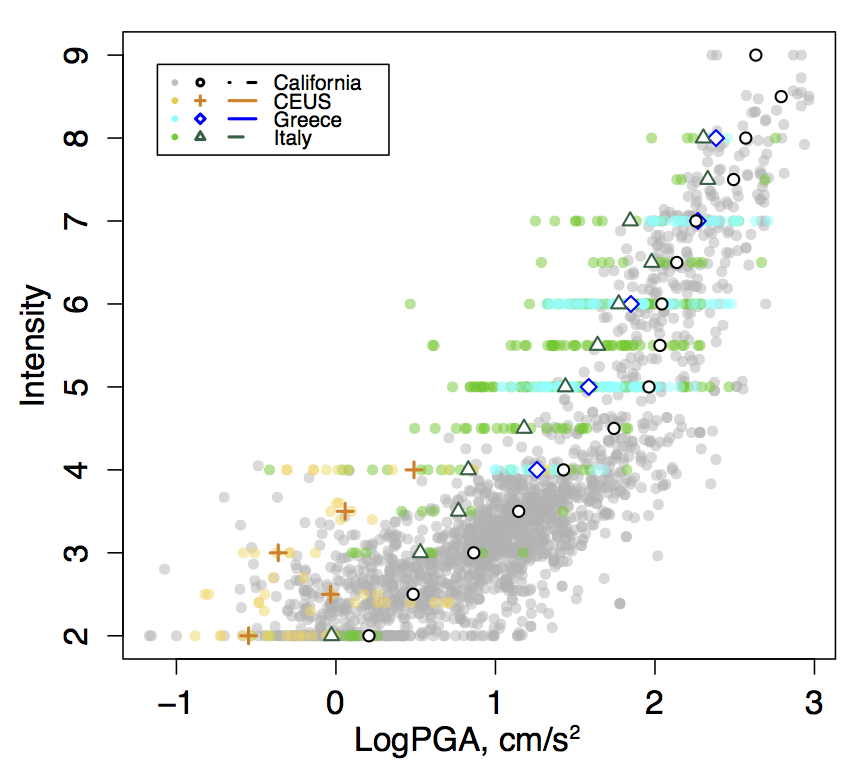
Figure S1. The selected PGA versus intensity databases collected here for the regions of California, central–eastern United States (CEUS), Greece, and Italy.
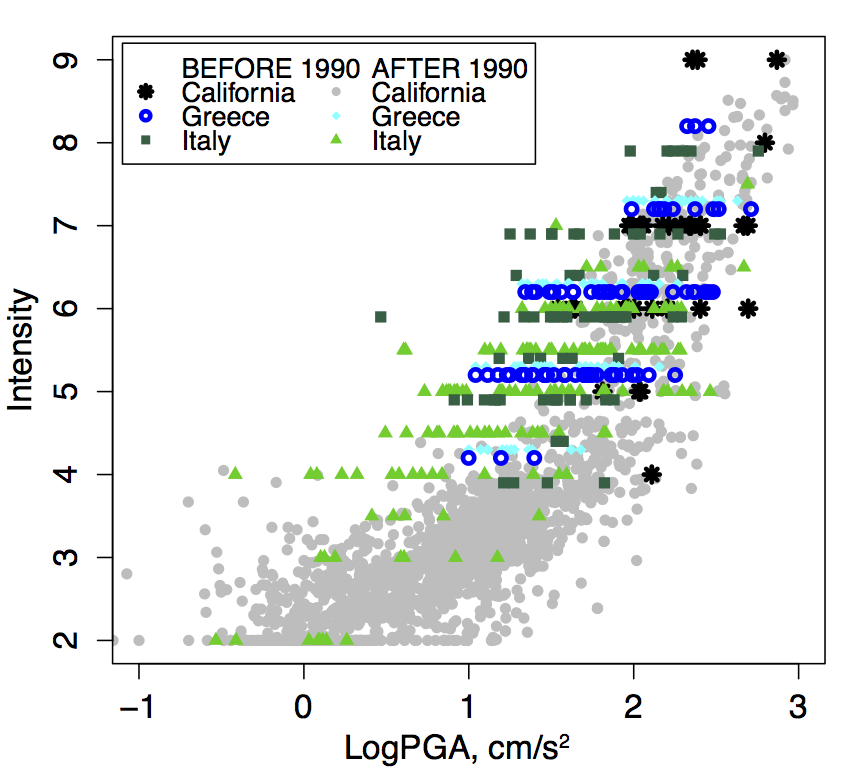
Figure S2. Comparison of PGA–intensity pairs for California, Italy, and Greece before and after 1990 for each region. CEUS data are all more recent than 1990.
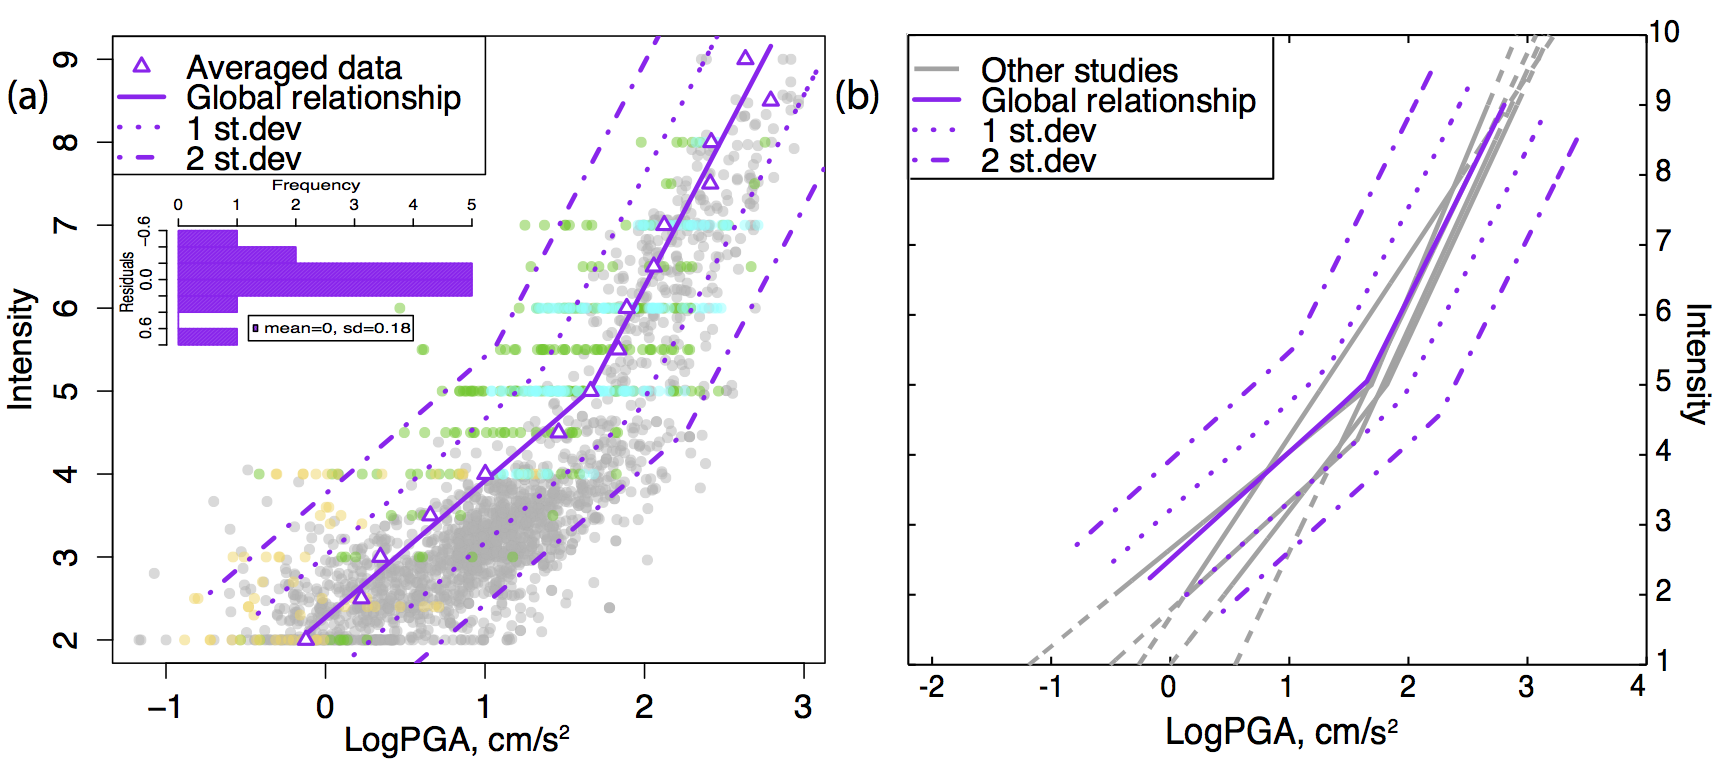
Figure S3. (a) LogPGA versus intensity Deming fit for our global relationship (purple solid line) on the data. The mean picks with one and two standard deviations are also shown. The inset histogram shows the distribution of residuals. (b) Comparison of corrected global relationships (purple) with the other studies shown in Figure 1 of the main article (gray).
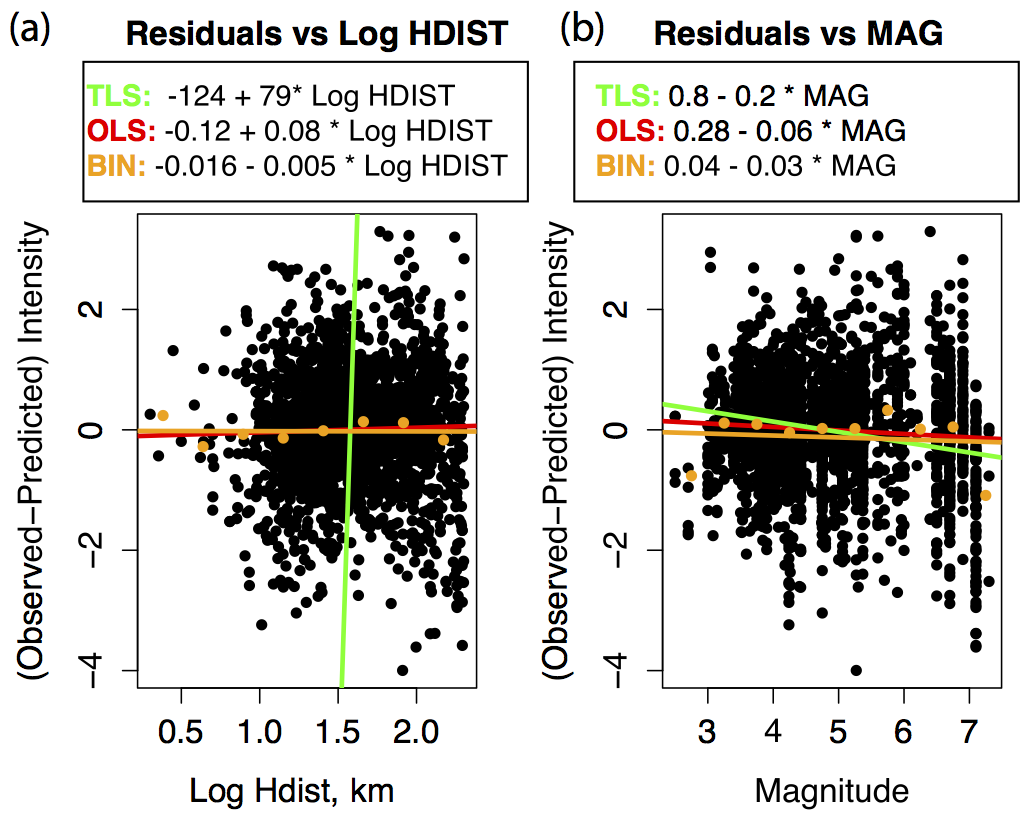
Figure S4. Distribution and regressions of residuals versus (a) logHDIST (hypocentral distance) and (b) magnitude for PGA. The green lines represent the regression obtained with the total least squares regression (TLS), red lines represent the ones obtained using an ordinary least square (OLS) regression, and the orange lines are the binned OLS. In (a), the TLS trend is almost vertical, while the other two are horizontal with zero intercepts, confirming the lack of correlation between intensity and hypocentral distance; and, in (b) we have meaningful and consistent trends that we can use as a correction, following the previous studies’ approach.
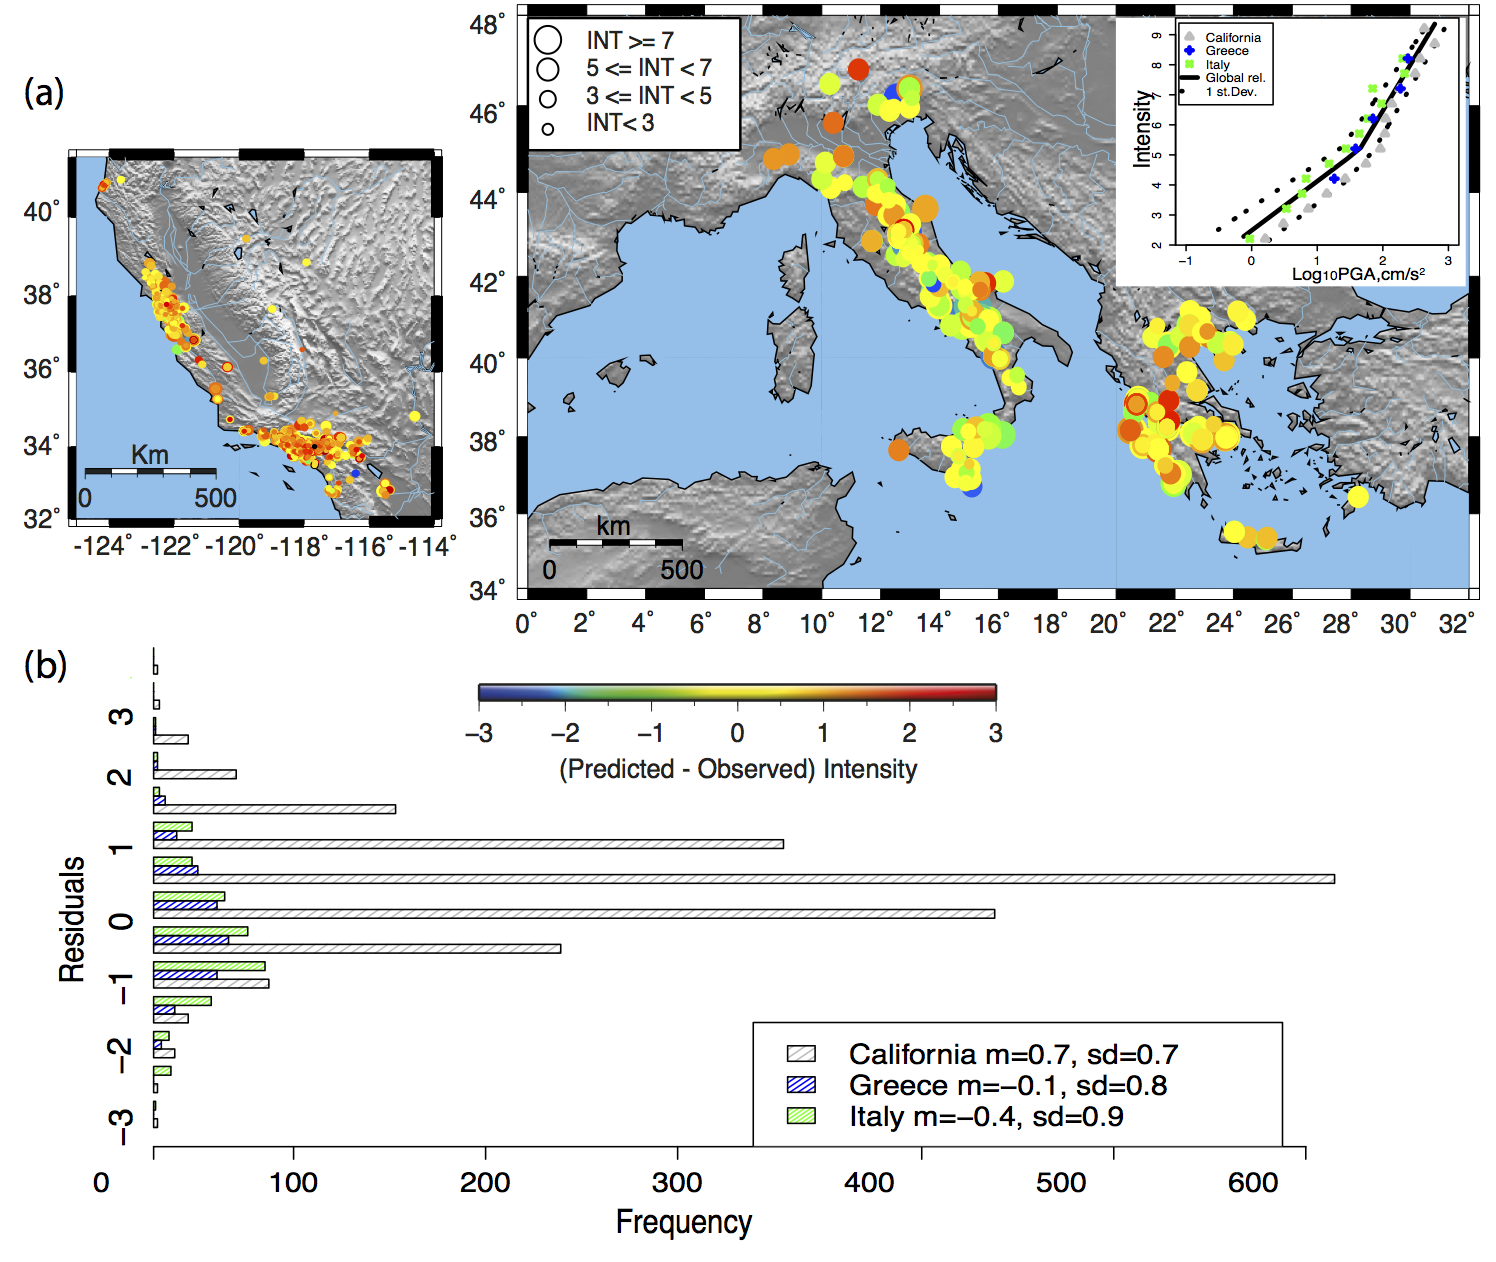
Figure S5. (a) Detail of the three regions with more than 100 records. The upper right inset shows the mean values of logPGA for California, Greece, and Italy at each intensity bin, and the global relationship. (b) The distribution of residuals (predicted − observed).
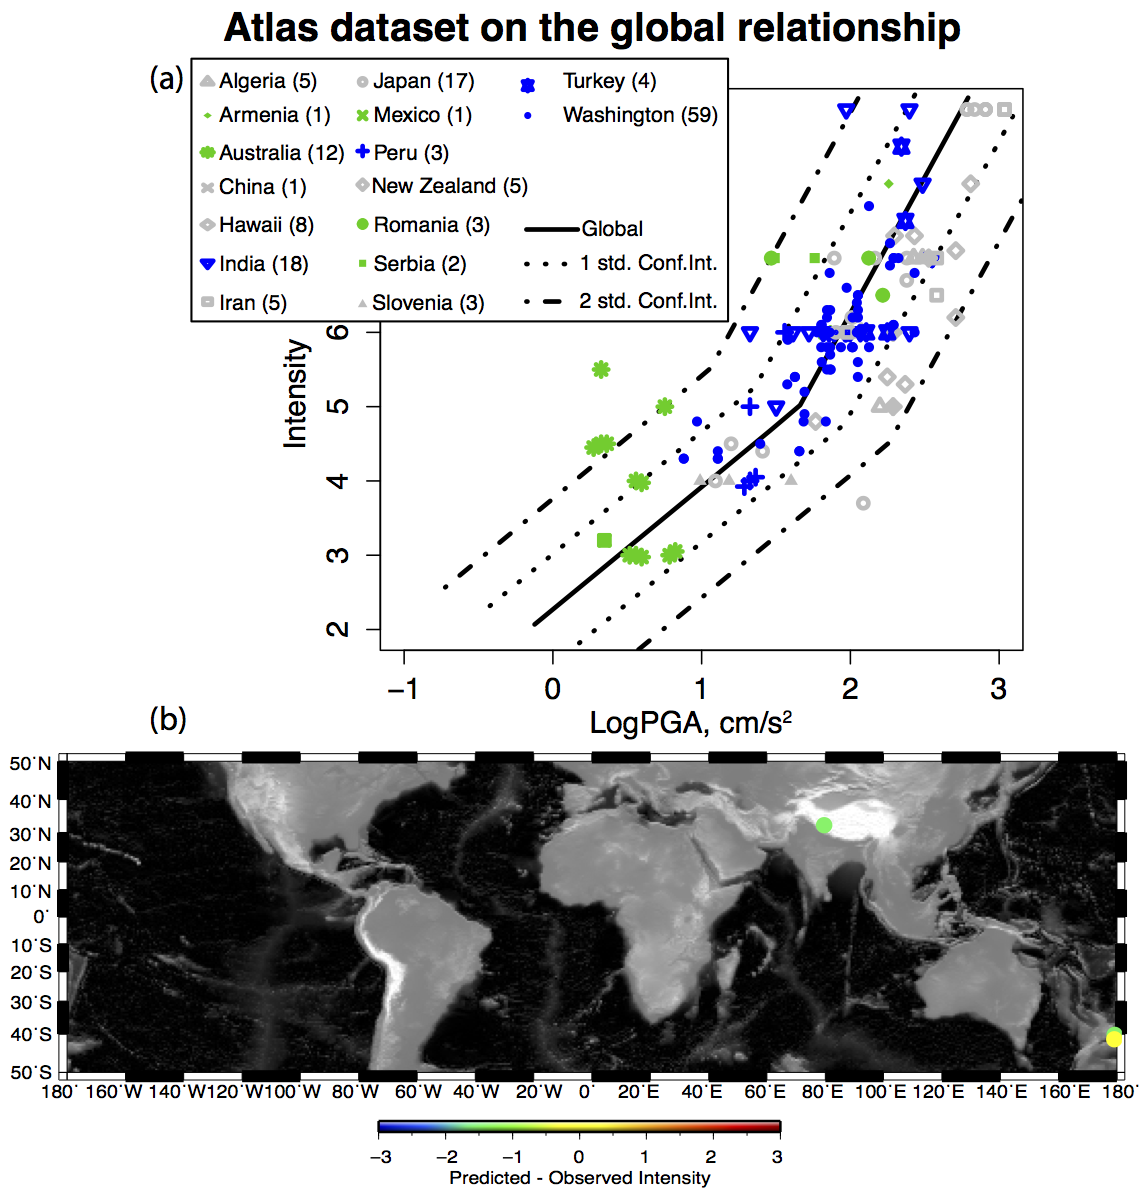
Figure S6. (a) Atlas database with respect to the PGA global relationship. (b) Geographical distribution of residuals (predicted − observed).
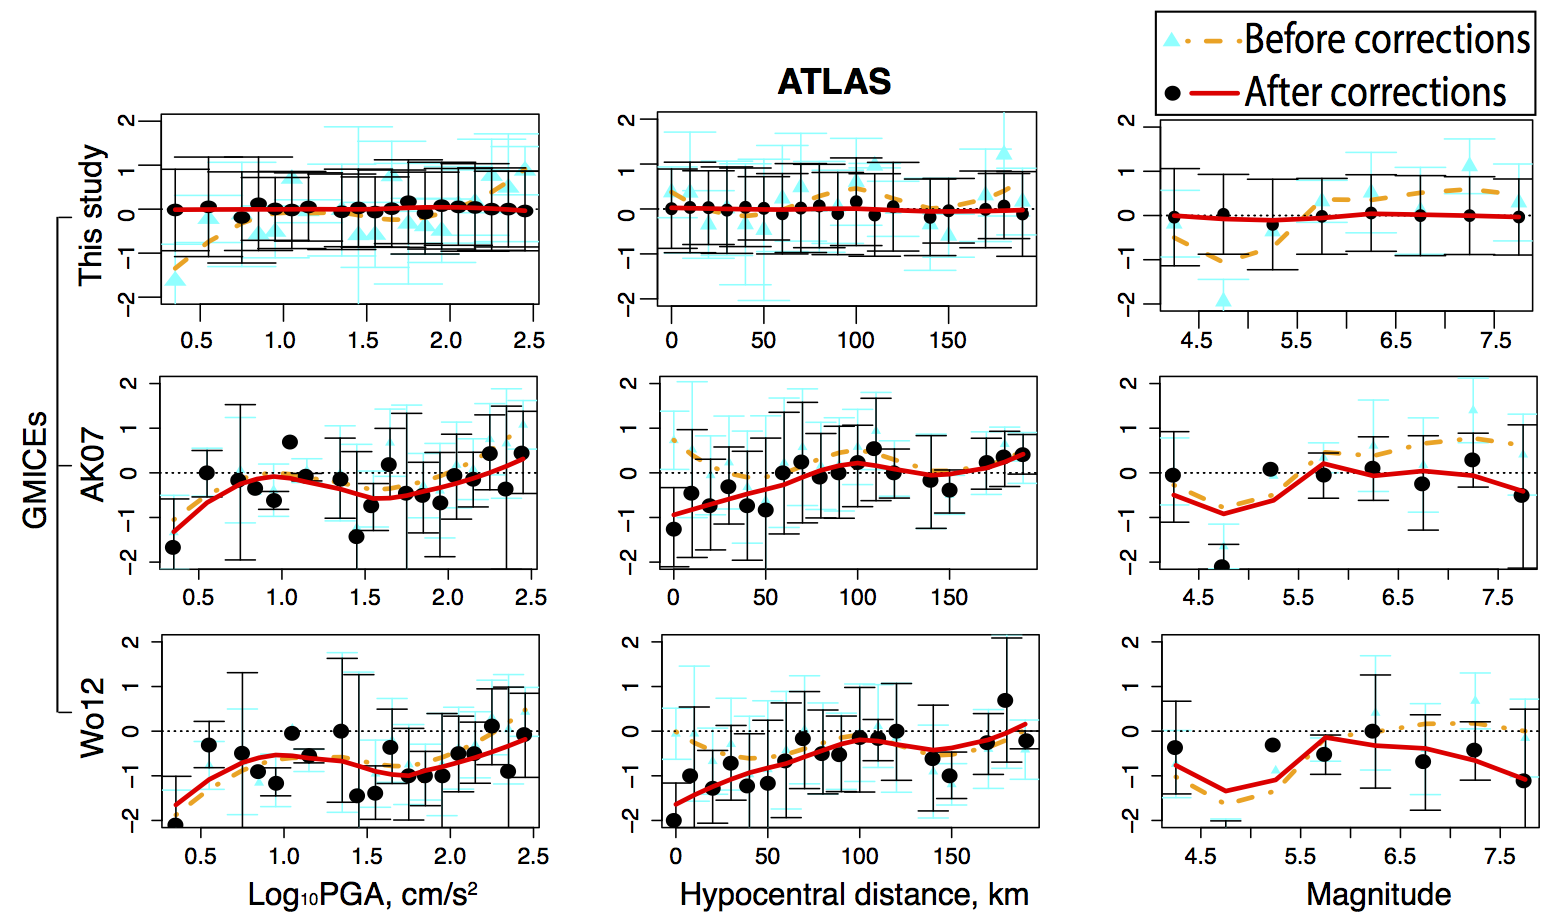
Figure S7. Intensity residuals (predicted − observed) for the GMICE derived in this study, Atkinson and Kaka (2007; AK07), and Worden et al. (2012; Wo12) (for PGA). Triangles show the results before the application of the correction terms defined in each study, while circles include the influence of those corrections. The dashed and the solid lines represent the LOESS fits to the relative plotted points and illustrate the contribution of correction factors in the final estimates.
ShakeMap Atlas data were provided by Georgia Cua (ETH Zürich). Data are available by request.
Atkinson, G. M., and S. I. Kaka (2007). Relationships between felt intensity and instrumental ground motion in the central United States and California, Bull. Seismol. Soc. Am. 97, no. 2, 497–510.
Worden, C. B., M. C. Gerstenberger, D. A. Rhoades, and D. J. Wald (2012). probabilistic relationships between ground-motion parameters and modified Mercalli Intensity in California, Bull. Seismol. Soc. Am. 102, no. 1, 204–221.
[ Back ]