Source-Model-Generation Algorithm Validation: 2004 Mw 6.05 Parkfield-Like Earthquake on Southern San Andreas Fault
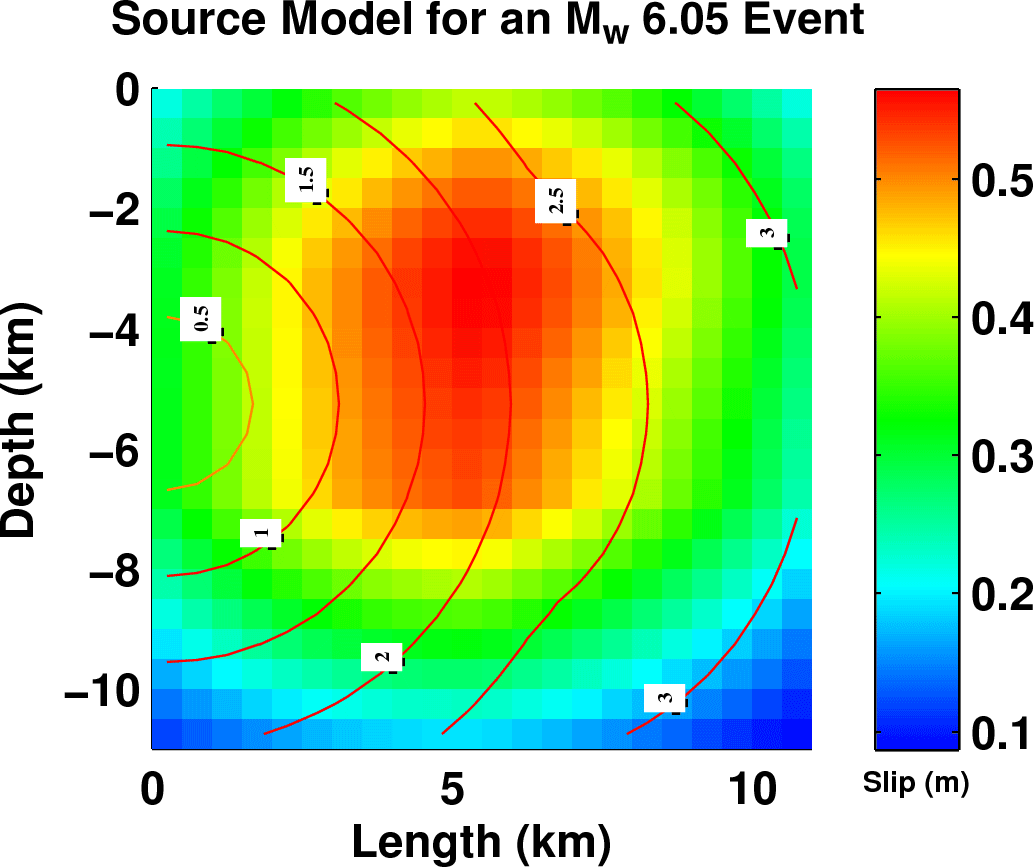
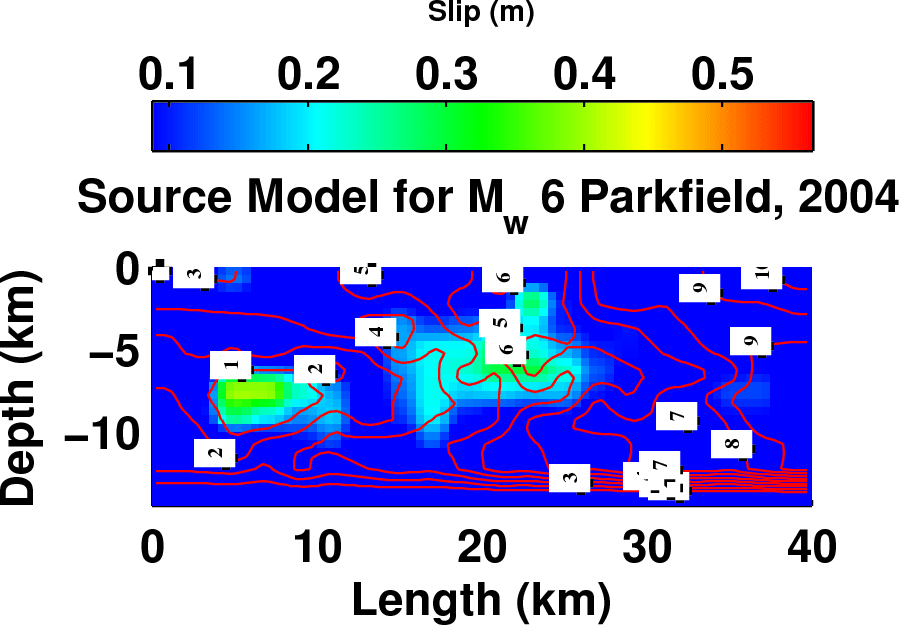
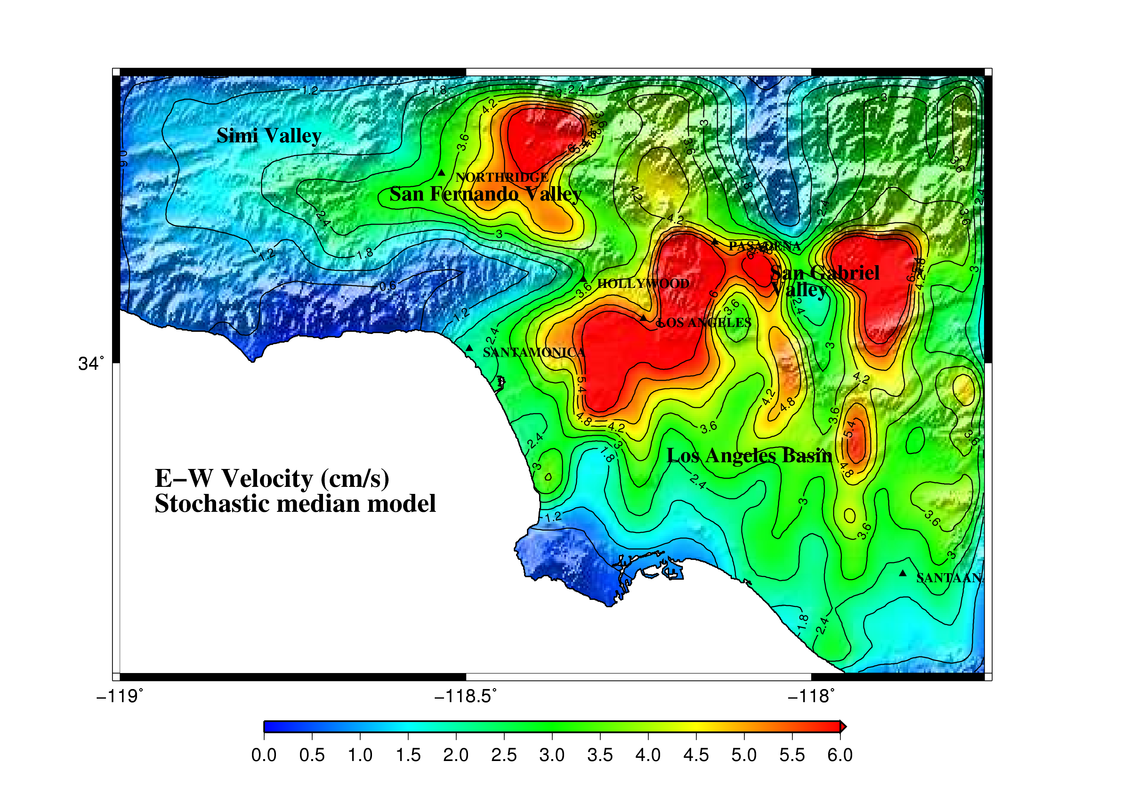
The validation exercise to ensure that the ground motions produced by the stochastic source models are similar to those produced by finite-source inversion models is repeated for an Mw 6.05 earthquake. As was done for the Mw 7.9 earthquake in the main article, five stochastic source realizations are generated. Each is placed at five locations along the southern San Andreas fault, and ground motions are generated for north-to-south and south-to-north propagating ruptures. The median source model that is determined using the method outlined in the main article is shown in Figure S1a. Figure S1b shows a finite-source inversion model for the 2004 Mw 6.0 Parkfield earthquake (Ji, 2004). The median ground motion produced by the median model is shown in Figure S2. The peak ground velocity and displacement maps generated by the stochastic median and the Parkfield finite-source inversion models rupturing location 3 of the southern San Andreas fault are shown in Figures S3 and S4, respectively. The stronger asperity in the stochastic model leads to more intense ground motions than in the Parkfield model. For a north-to-south propagation of the stochastic median model, the location of intense ground motions moves gradually southeast of the San Fernando Valley as the rupture location shifts south from Parkfield. For south-to-north propagating ruptures, the location of intense ground motions moves gradually northwest of the San Gabriel Valley as the rupture location shifts north from Bombay Beach. This is similar to the Mw = 7.9 earthquake simulations.
The statistical comparison of peak ground velocity (see Figs. S5 and S6) and the displacement resulting from the two source models indicates significant differences. This can be attributed primarily to the strength of the slip asperity in the stochastic source compared to that in the finite-source inversion. The reason for this may be the magnitude–area relation that suggests a rupture area of just 10 km × 10 km for an Mw 6.0 earthquake, whereas the finite-source inversion for the Parkfield earthquake points to a significantly larger area and smaller slips as a result. The comparison of attenuation of ground motion (median peak average horizontal velocity) with distance from source between stochastic and Parkfield models is shown in Figure S7. The median peak horizontal velocity and displacement (and median ± 1 standard deviation) and the spectral acceleration (at 3 s) as a function of distance from the source simulated at sites in the greater Los Angeles region that are within 100 km of the median stochastic source model (Mw 6.05) for the 10 rupture scenarios (rupture locations 1–5, and rupture directions north-to-south and south-to-north) are shown in Figures S8 and S9, respectively.
Figure S1. (a) Stochastic median source model with slip (in meters) for an Mw 6.05 earthquake on the San Andreas fault. (b) Finite-source inversion model for the Mw 6.0 Parkfield earthquake of 2004 (Ji, 2004). Rupture time contours (in seconds) are overlaid on the slip distribution. The maximum slip rates for the stochastic and inversion models are 1.99 m/s and 1.09 m/s respectively.
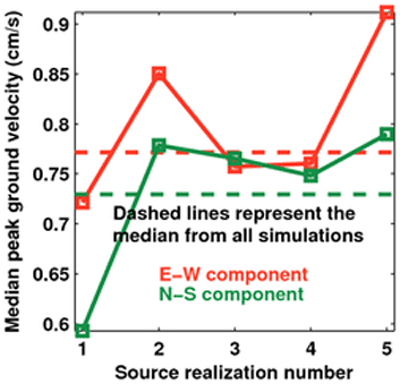
Figure S2. Rupture scenarios: (solid lines) median peak ground velocity (PGV) computed at 636 sites in southern California from 10 rupture scenarios (5 rupture locations along the southern San Andreas fault × 2 rupture directions) using each of five stochastic source realizations and (dashed lines) the corresponding median PGV from all fifty scenario earthquakes. All earthquakes are of magnitude Mw 6.05.
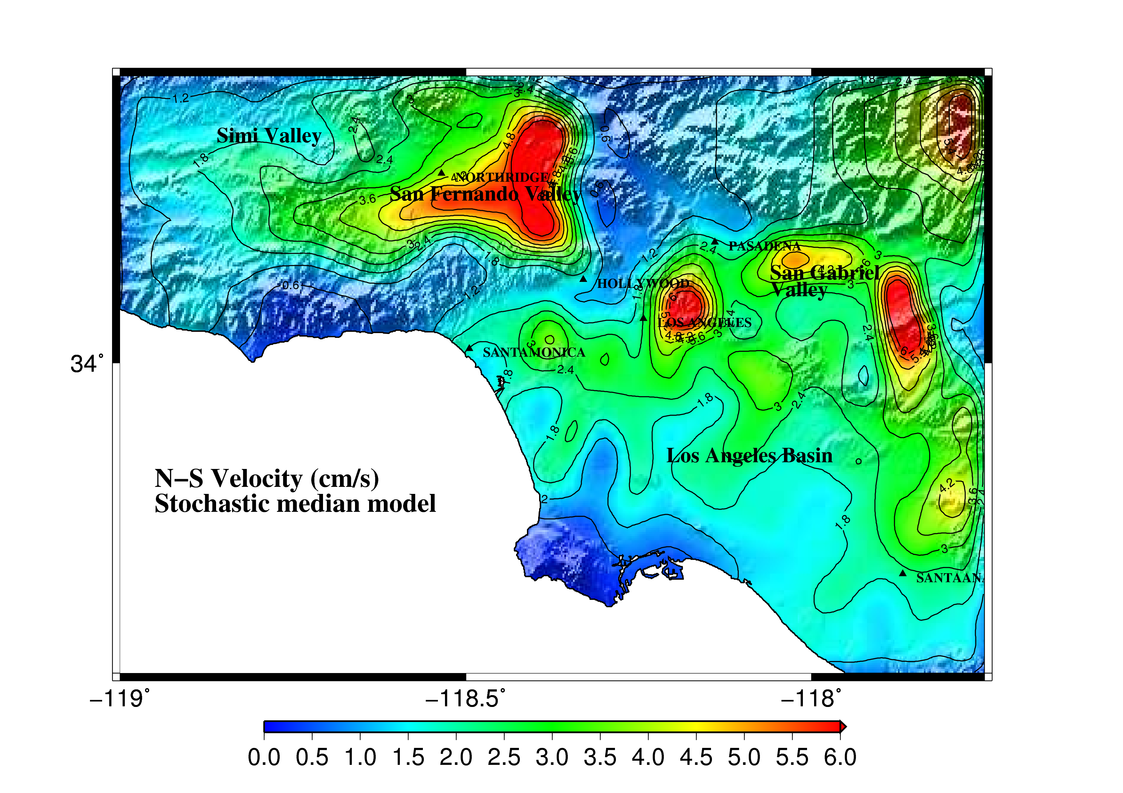
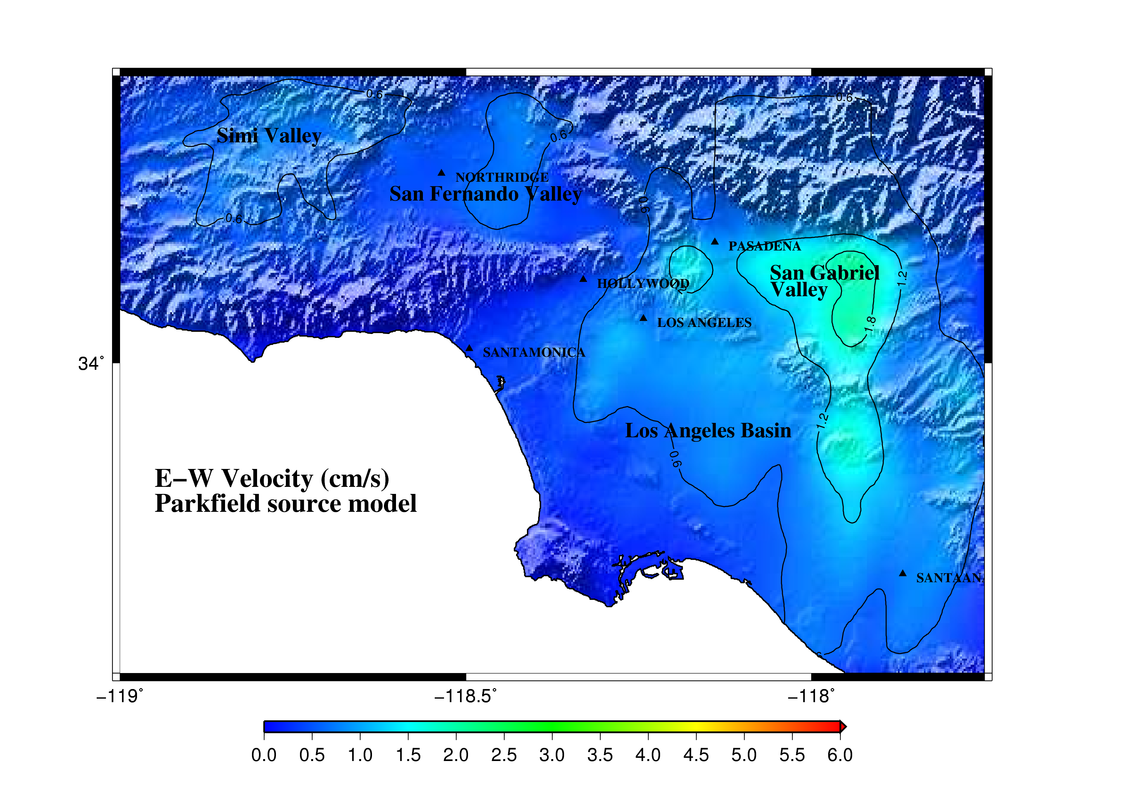
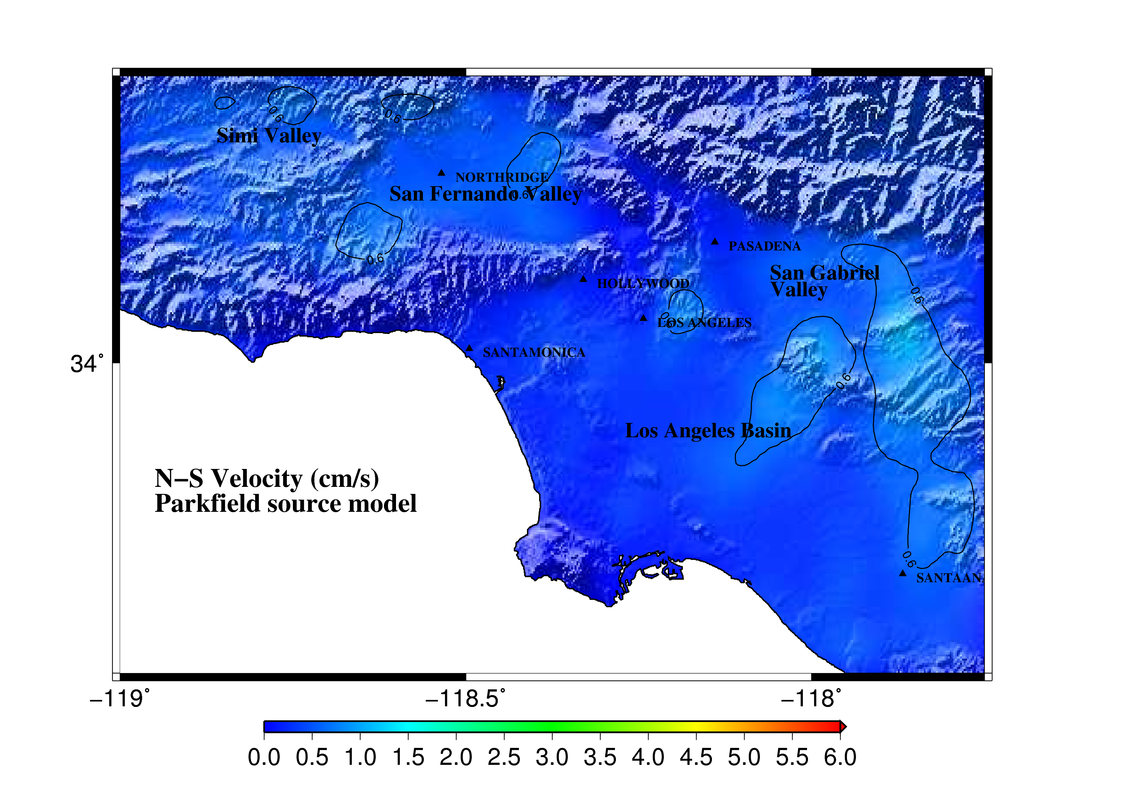
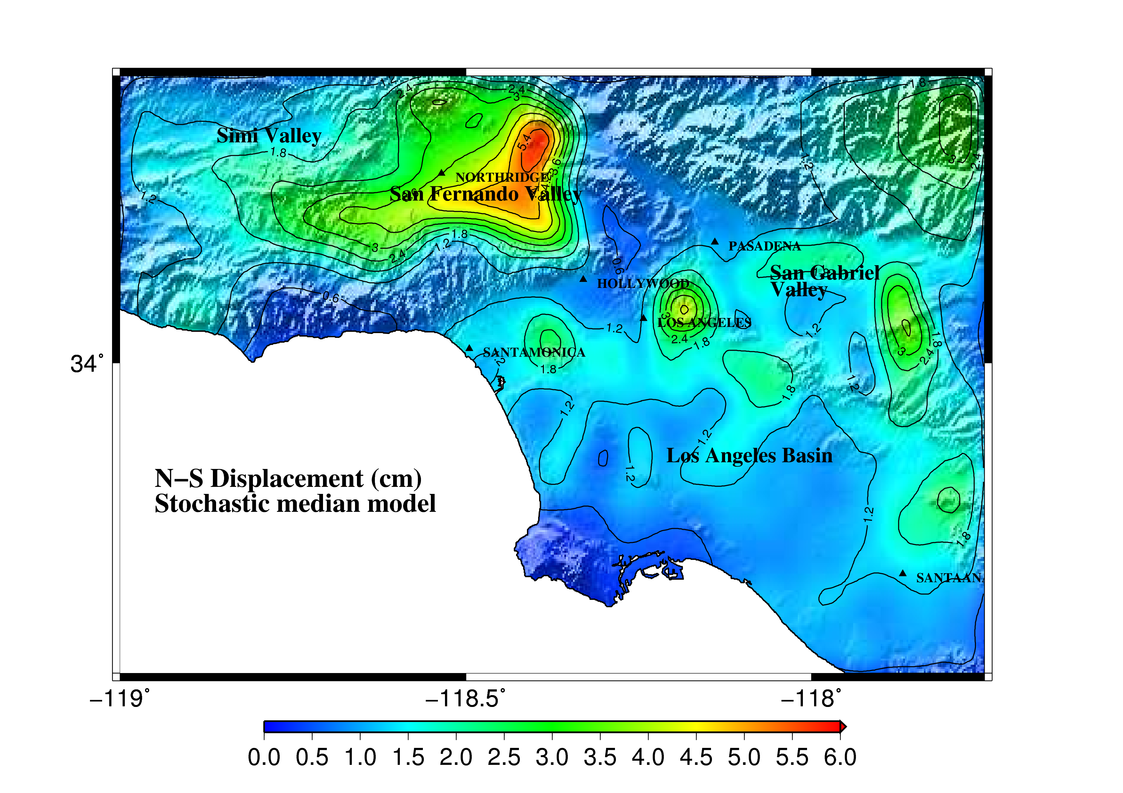
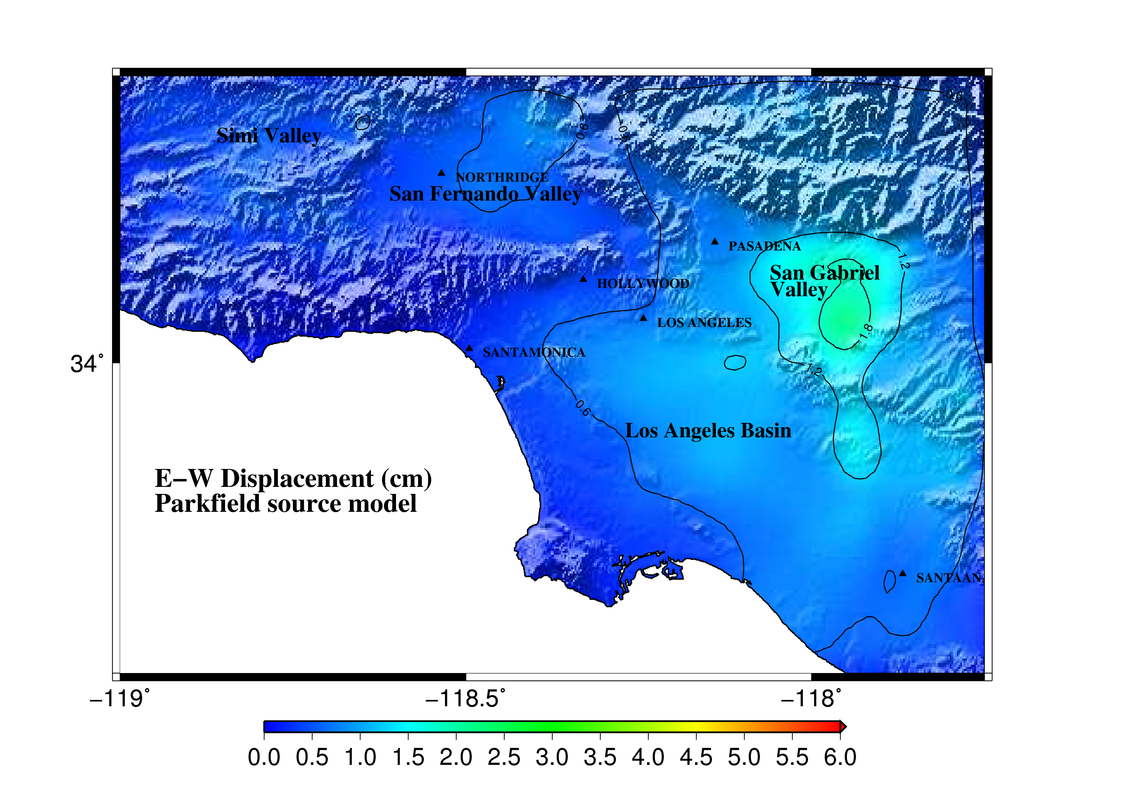
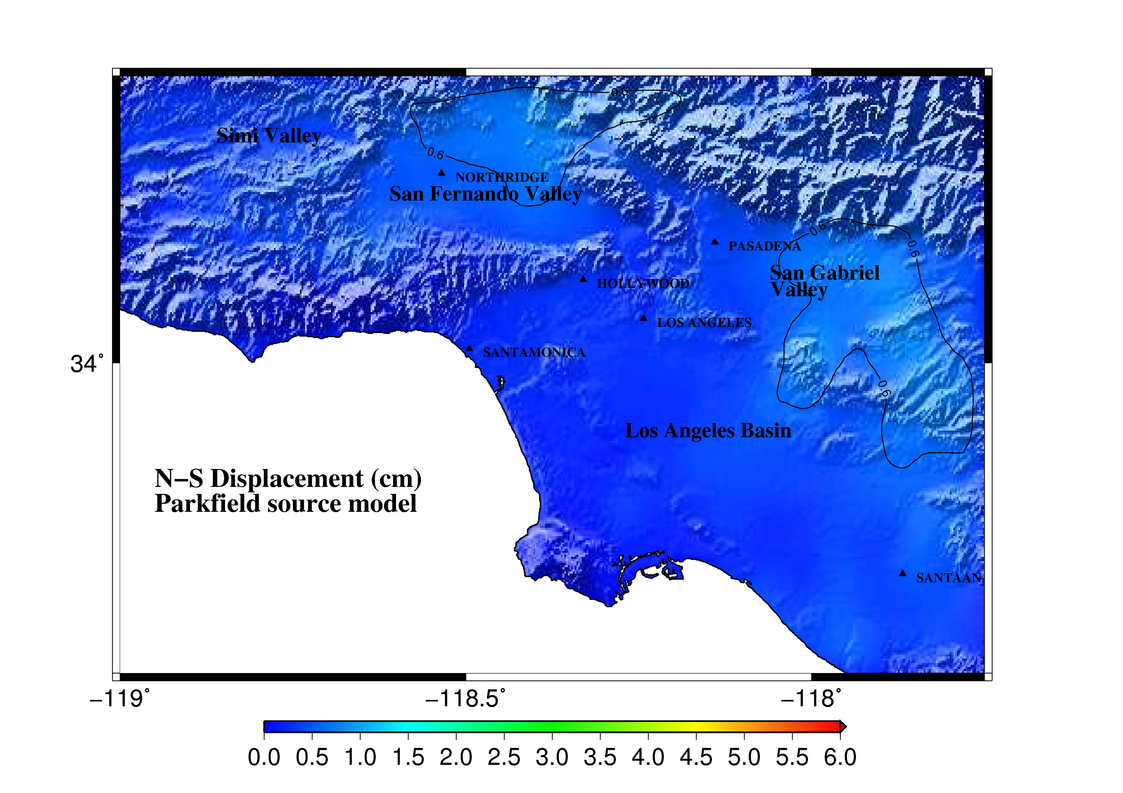
Figure S3. East–west (EW) and north–south (NS) components of PGV (cm/s) from a north-to-south propagating rupture at location 3 on the southern San Andreas fault: (a) and (b) Mw 6.05 stochastic median source model and (c) and (d) Mw 6.0 Parkfield earthquake finite-source inversion model (Ji, 2004).
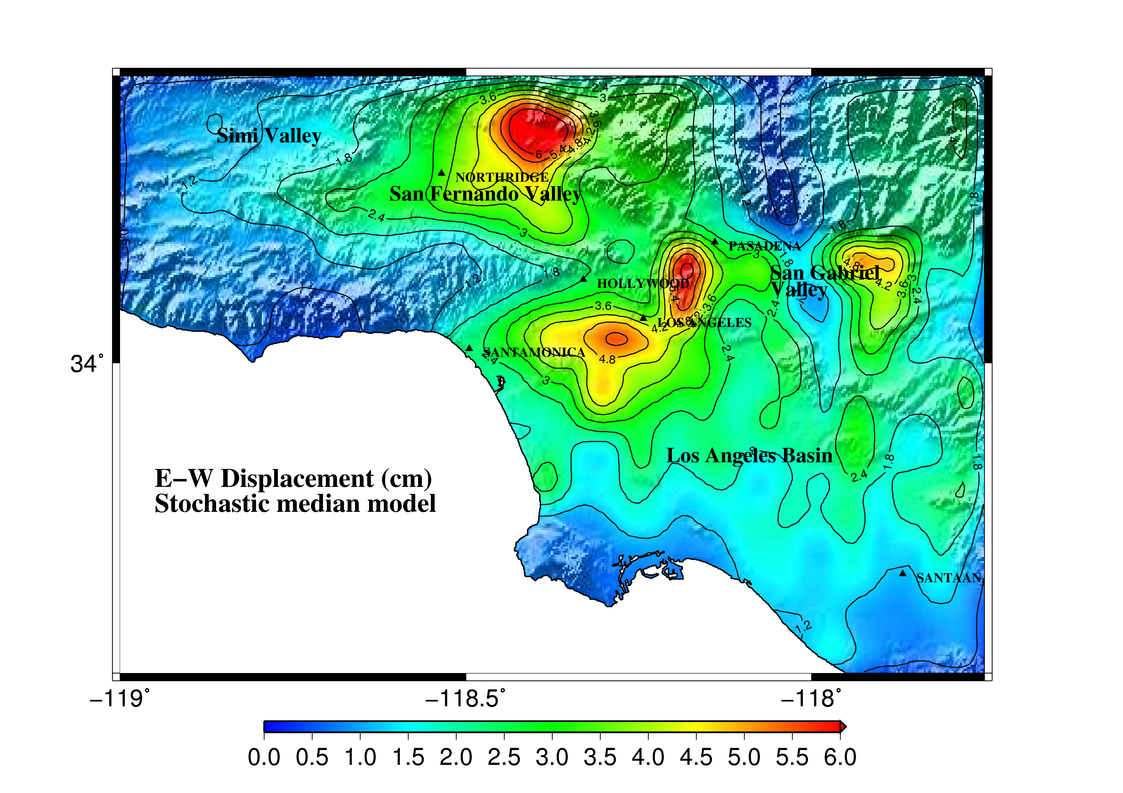
Figure S4. EW and NS components of peak ground displacement (PGD; cm) from a north-to-south propagating rupture at location 3 on the southern San Andreas fault: (a) and (b) Mw 6.05 stochastic median source model; (c) and (d) Mw 6.0 Parkfield earthquake finite-source inversion model (Ji, 2004).
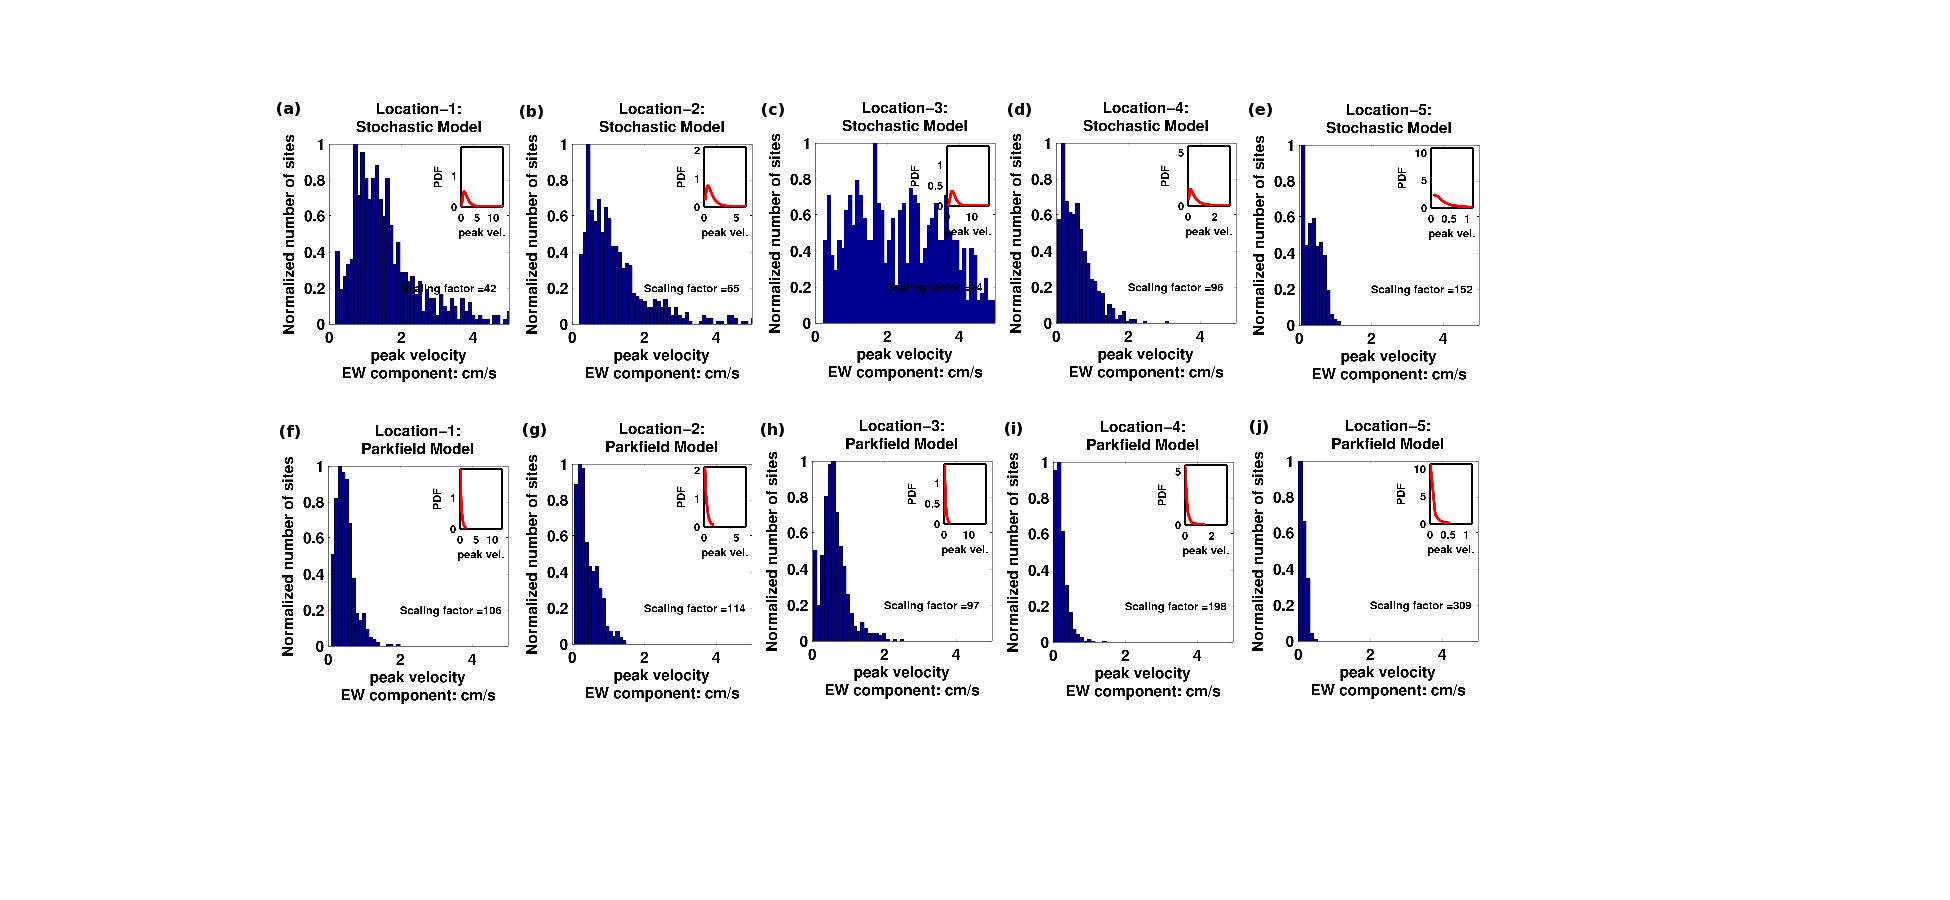
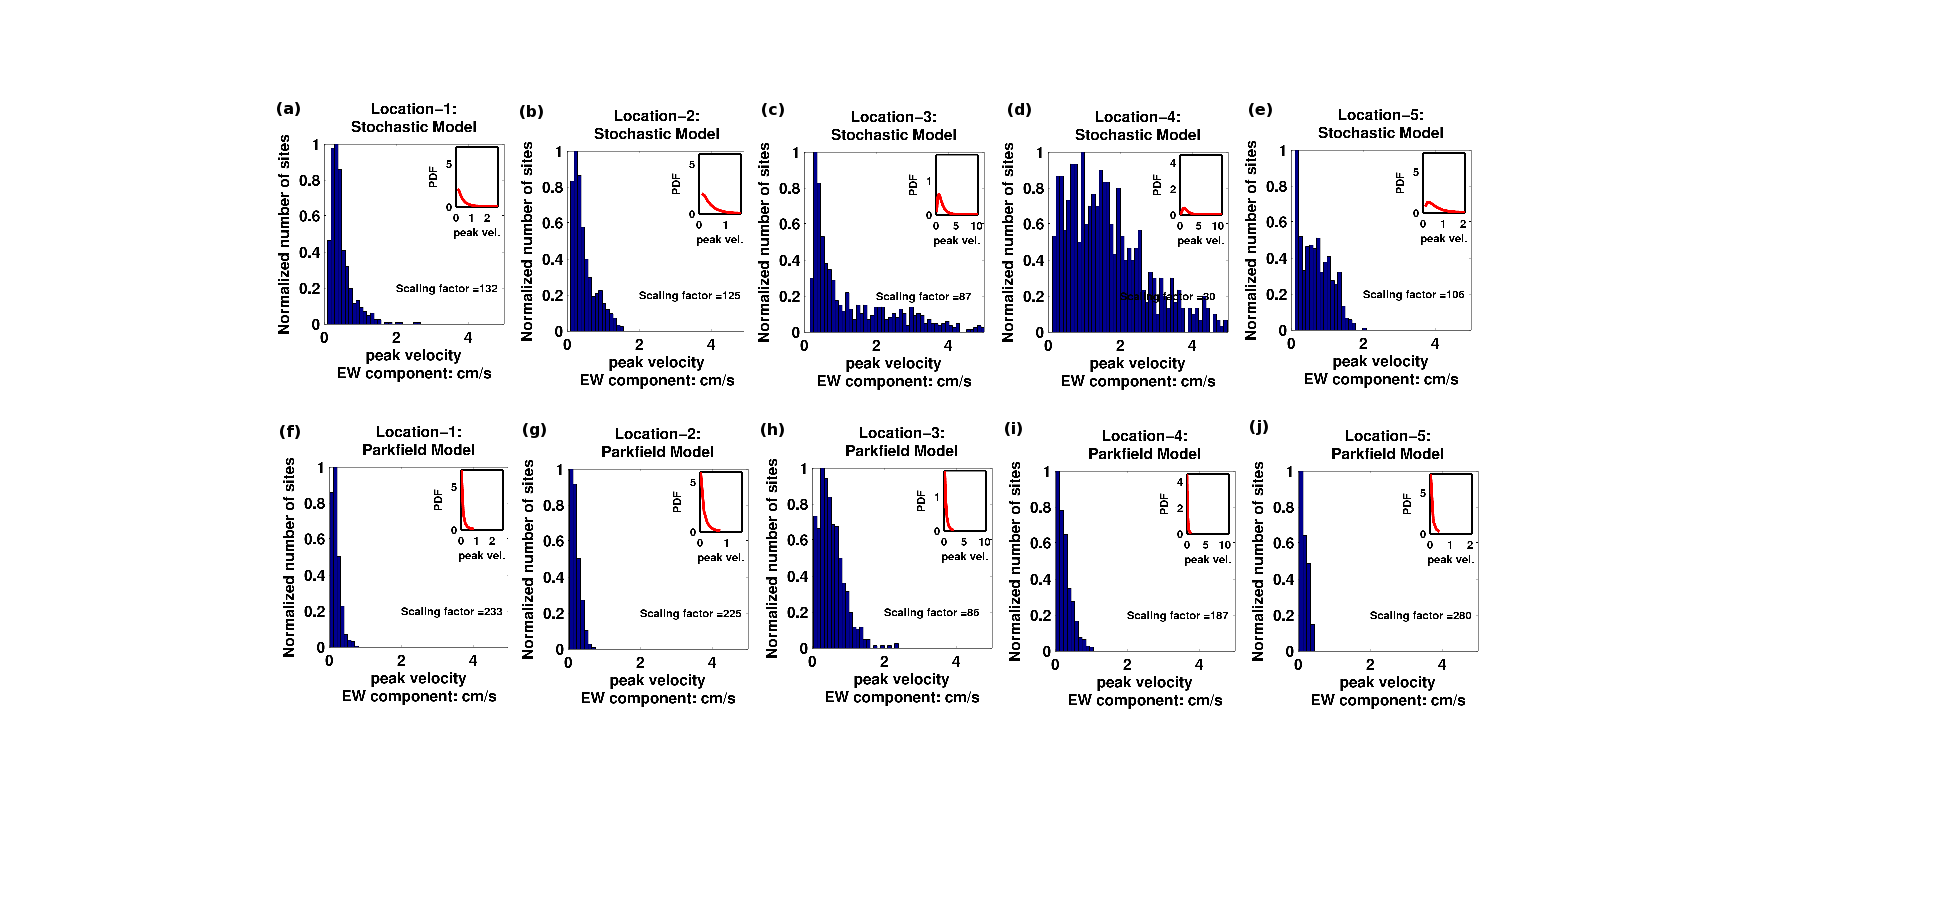
Figure S5. Five Mw 6.05 north-to-south rupture scenarios (at locations 1–5) on the San Andreas fault using (a)–(e) the stochastic median model and (f)–(j) the Mw 6.0 Parkfield earthquake finite-source inversion model: histograms and best-fit lognormal probability density function (PDFs; insets) of PGV at 636 stations in southern California. The product of the listed scaling factor and the normalized histogram ordinate at a specific peak velocity gives the total number of stations for that velocity.
Figure S6. Five Mw 6.05 south-to-north rupture scenarios (at locations 1–5) on the San Andreas fault using (a)–(e) the stochastic median model and (f)–(j) the Mw 6.0 Parkfield earthquake finite-source inversion model: histograms and best-fit lognormal PDFs (insets) of PGV at 636 stations in southern California. The product of the listed scaling factor and the normalized histogram ordinate at a specific peak velocity gives the total number of stations for that velocity.
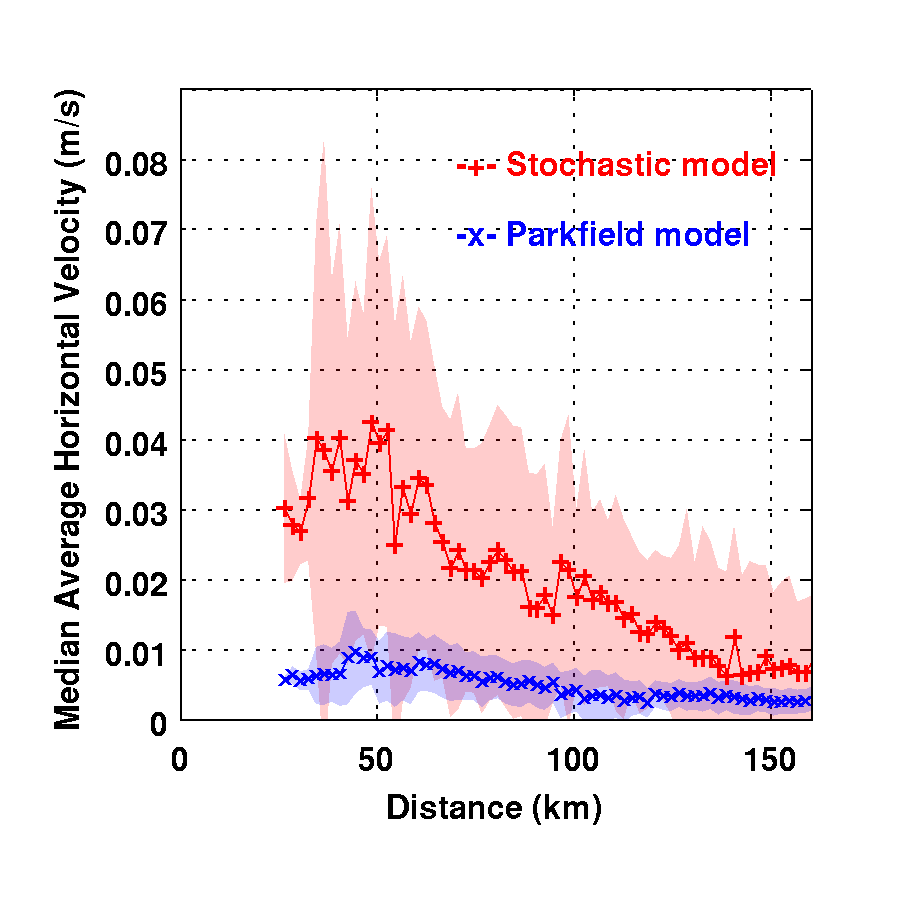
Figure S7. Median peak average horizontal velocity (m/s) (+, stochastic model; x, Parkfield model) as a function of source-to-site distance in southern California due to an Mw 6.05 earthquake occurring along the southern San Andreas fault. The shaded region corresponds to median ± 1 standard deviation. A total of 10 rupture scenarios (5 rupture locations × 2 propagation directions) are considered.
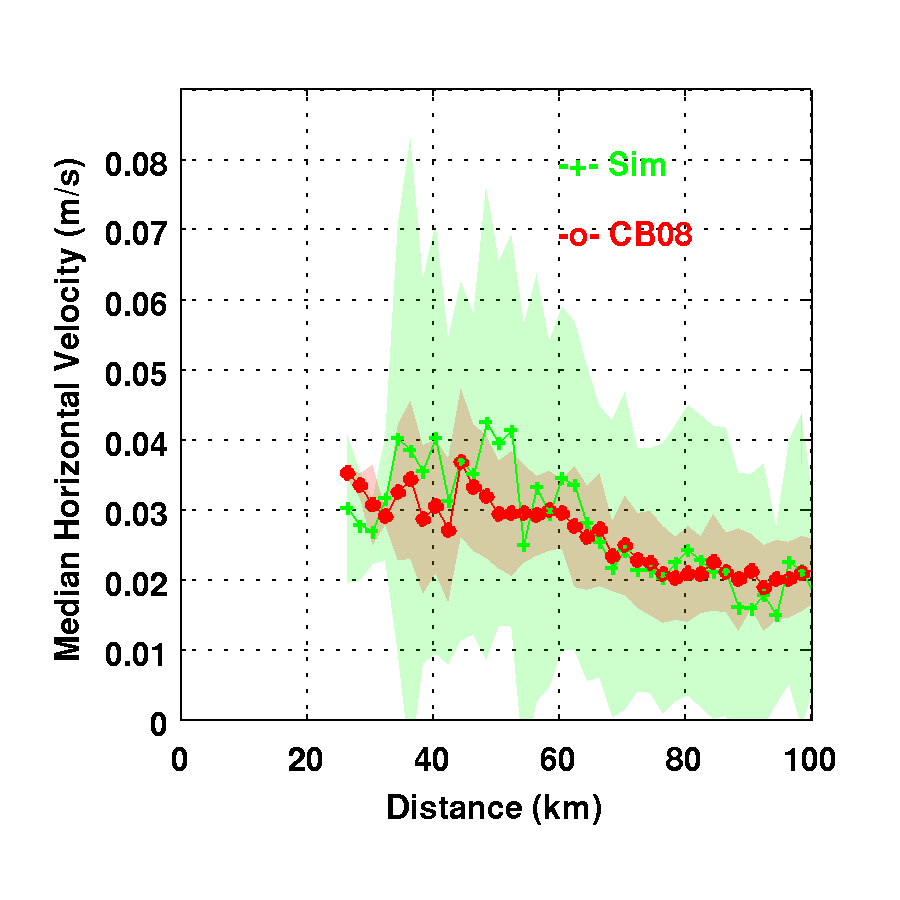
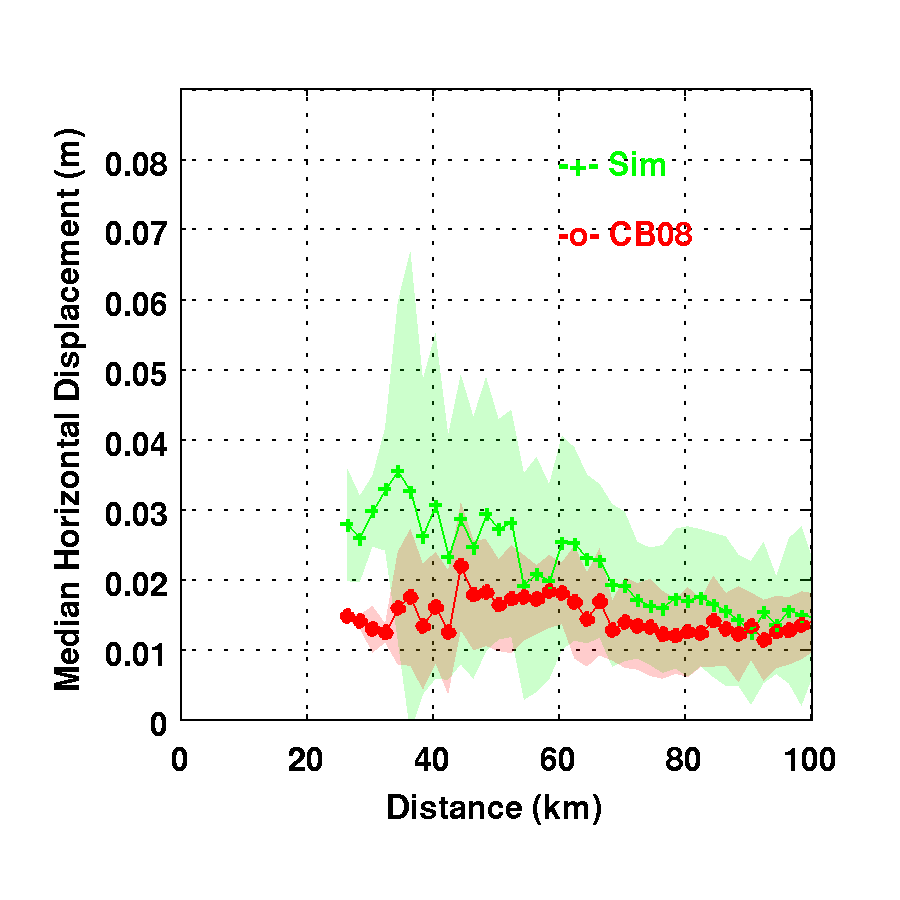
Figure S8. (a) Median peak horizontal velocity (m/s) and (b) median peak horizontal displacement (m) as a function of source-to-site distance for 10 Mw 6.05 earthquake scenarios on the southern San Andreas fault (5 rupture locations × 2 rupture directions) using the median stochastic source model (+, simulations; CB08, predictions by the Campbell–Bozorgnia Next Generation Attenuation [NGA] relation). The shaded region corresponds to median ± 1 standard deviation.
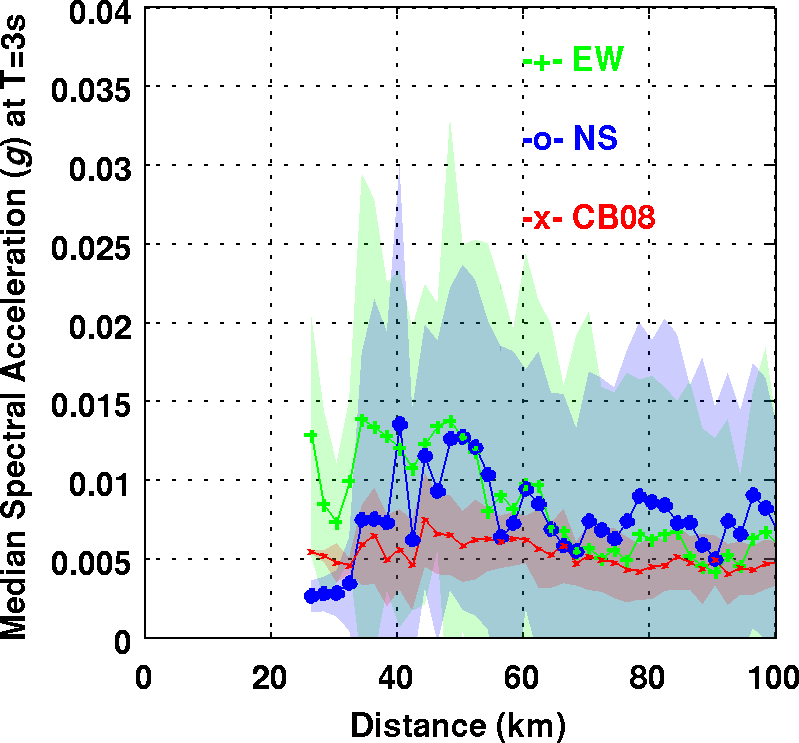
Figure S9. Spectral acceleration (g) at T = 3 s (SA3s) as a function of source-to-site distance for 10 Mw 6.05 earthquake scenarios on the southern San Andreas fault (5 rupture locations × 2 rupture directions): + and o are the simulated east–west and the north–south SA3s components at the greater Los Angeles sites using the median stochastic source model, respectively, and x shows the predictions by the Campbell–Bozorgnia NGA relation. The shaded region corresponds to median ± 1 standard deviation.
Ji, C. (2004). Slip history of the 2004 (Mw 5.9) Parkfield earthquake (single-plane model), available at http://www.tectonics.caltech.edu/slip_history/2004_ca/parkfield2.html (last accessed December 2014).
[ Back ]