This electronic supplement contains additional maps of station density for southern Vancouver Island, epicenter locations for northern Washington, and additional time–distance plots for southern Vancouver Island.
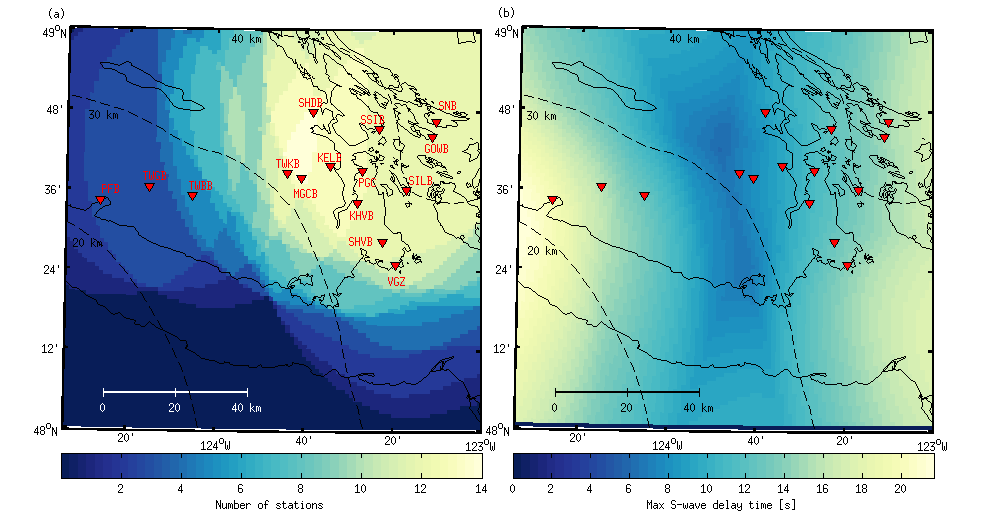
To illustrate the effect of station geometry on low-frequency earthquake (LFE) detection sensitivity between different episodic tremor and slow-slip (ETS) years, we include the station density and maximum delay time maps for 2003, 2005, and 2013 (Figs. S1–S3). Station geometry for 2003 shows decreased coverage near the west coast of Vancouver Island, consistent with epicenter density observations.
Figure S1. (a) Map of the number of stations (inverted triangles) with precritical arrivals for hypocenters located on the plate interface model of Audet et al. (2010) under southern Vancouver Island for the stations available during the 2003 ETS episode. The dashed lines indicate the 20-, 30-, and 40-km-depth contours of the plate interface. LFE detections are more likely in regions of high station density, satisfying the precritical arrival criterion. (b) Same as (a) but for the maximum delay between S-wave arrival times among all pairs of stations.
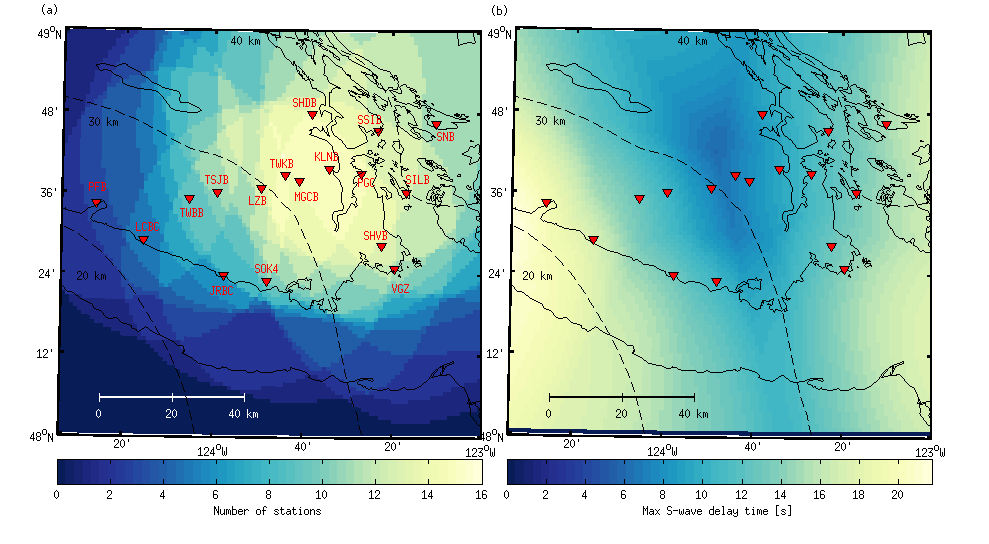
Figure S2. Same as for Figure S1 but for the 2005 ETS episode.
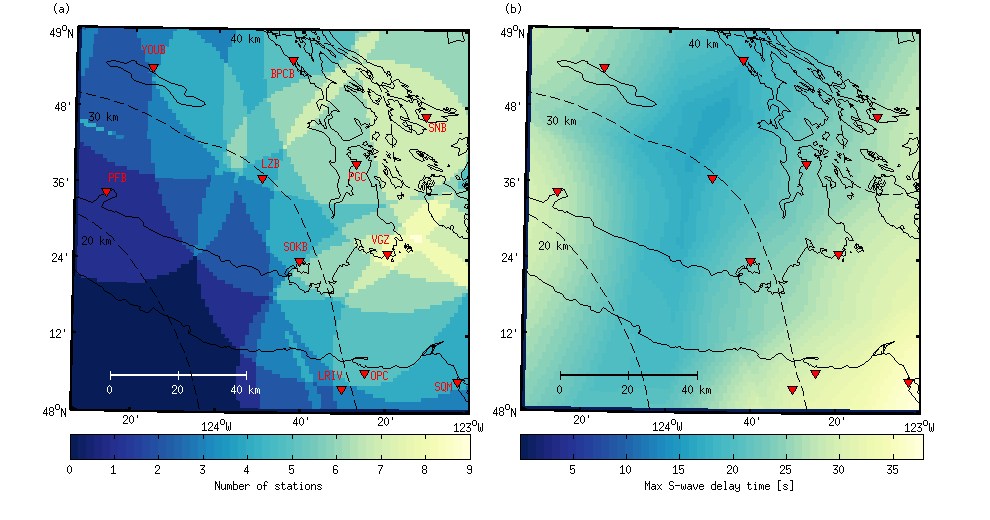
Figure S3. Same as for Figure S1 but for the 2013 ETS episode.
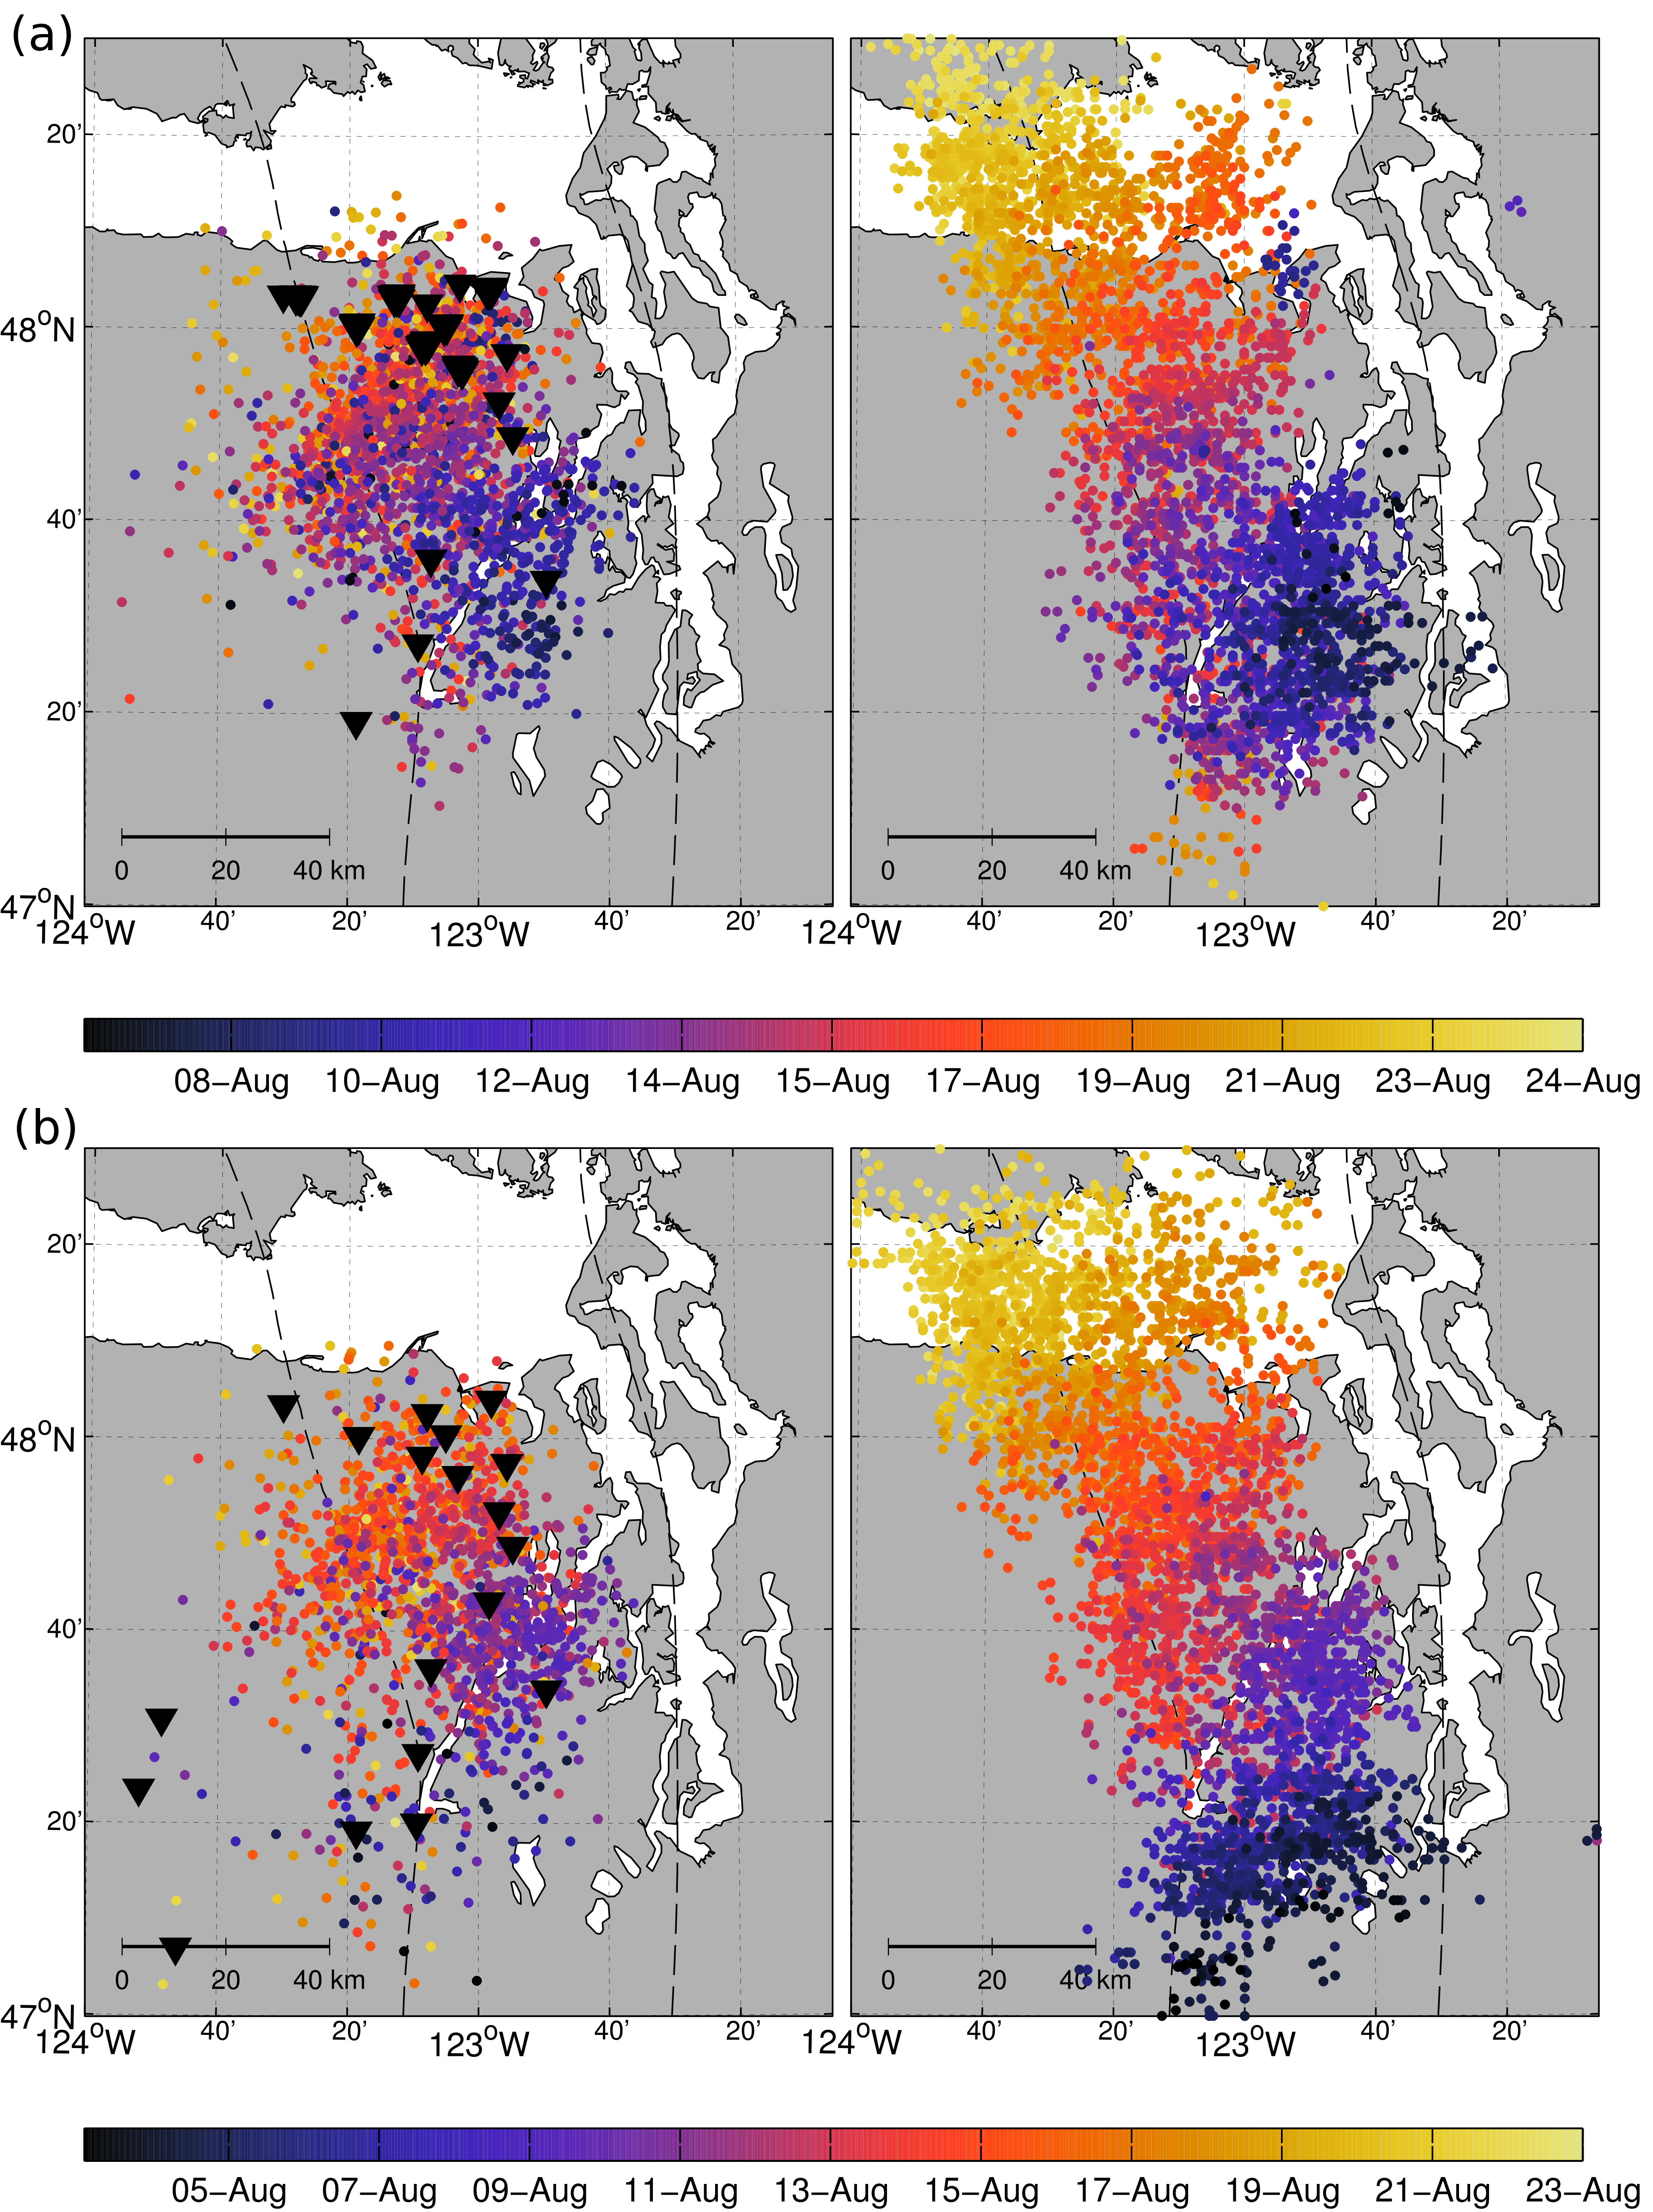
We analyzed data from the Washington state Cascadia Array for Earthscope (CAFE) and Array of Arrays (Ghosh et al., 2012) experiments from ETS episodes in 2010 and 2011. Episodes at these stations lasted approximately 18 and 20 days and resulted in 2176 and 1568 detections, respectively. LFEs from Washington state exhibit lower signal-to-noise ratio and waveform similarity than those in southern Vancouver Island, with higher noise levels between 1 and 2 Hz in particular. To mitigate this shortcoming, we experimented with different bandpass filters, but such filters often reduce the impulsiveness of the waveforms for a lower corner frequency that is greater than about 1.5 Hz. In addition, LFE waveforms in Washington state appear to have longer coda, suggesting a stronger structural imprint that reduces waveform similarity at nearby stations. This factor decreases the performance of our approach, because correlation coefficients are smaller and timing uncertainties are larger. LFE epicenters for both the 2010 and 2011 episodes are shown in Figure S4 and compared with the tremor locations of Wech and Creager (2008). The main propagation front is clearly evident for both episodes, though we obtain far fewer detections into the Strait of Juan de Fuca.
Figure S4. LFE epicenters for (a) the 2010 and (b) the 2011 ETS episodes in northern Washington. The left panels are from the present study, and the right panels show the tremor detections of Wech and Creager (2008).
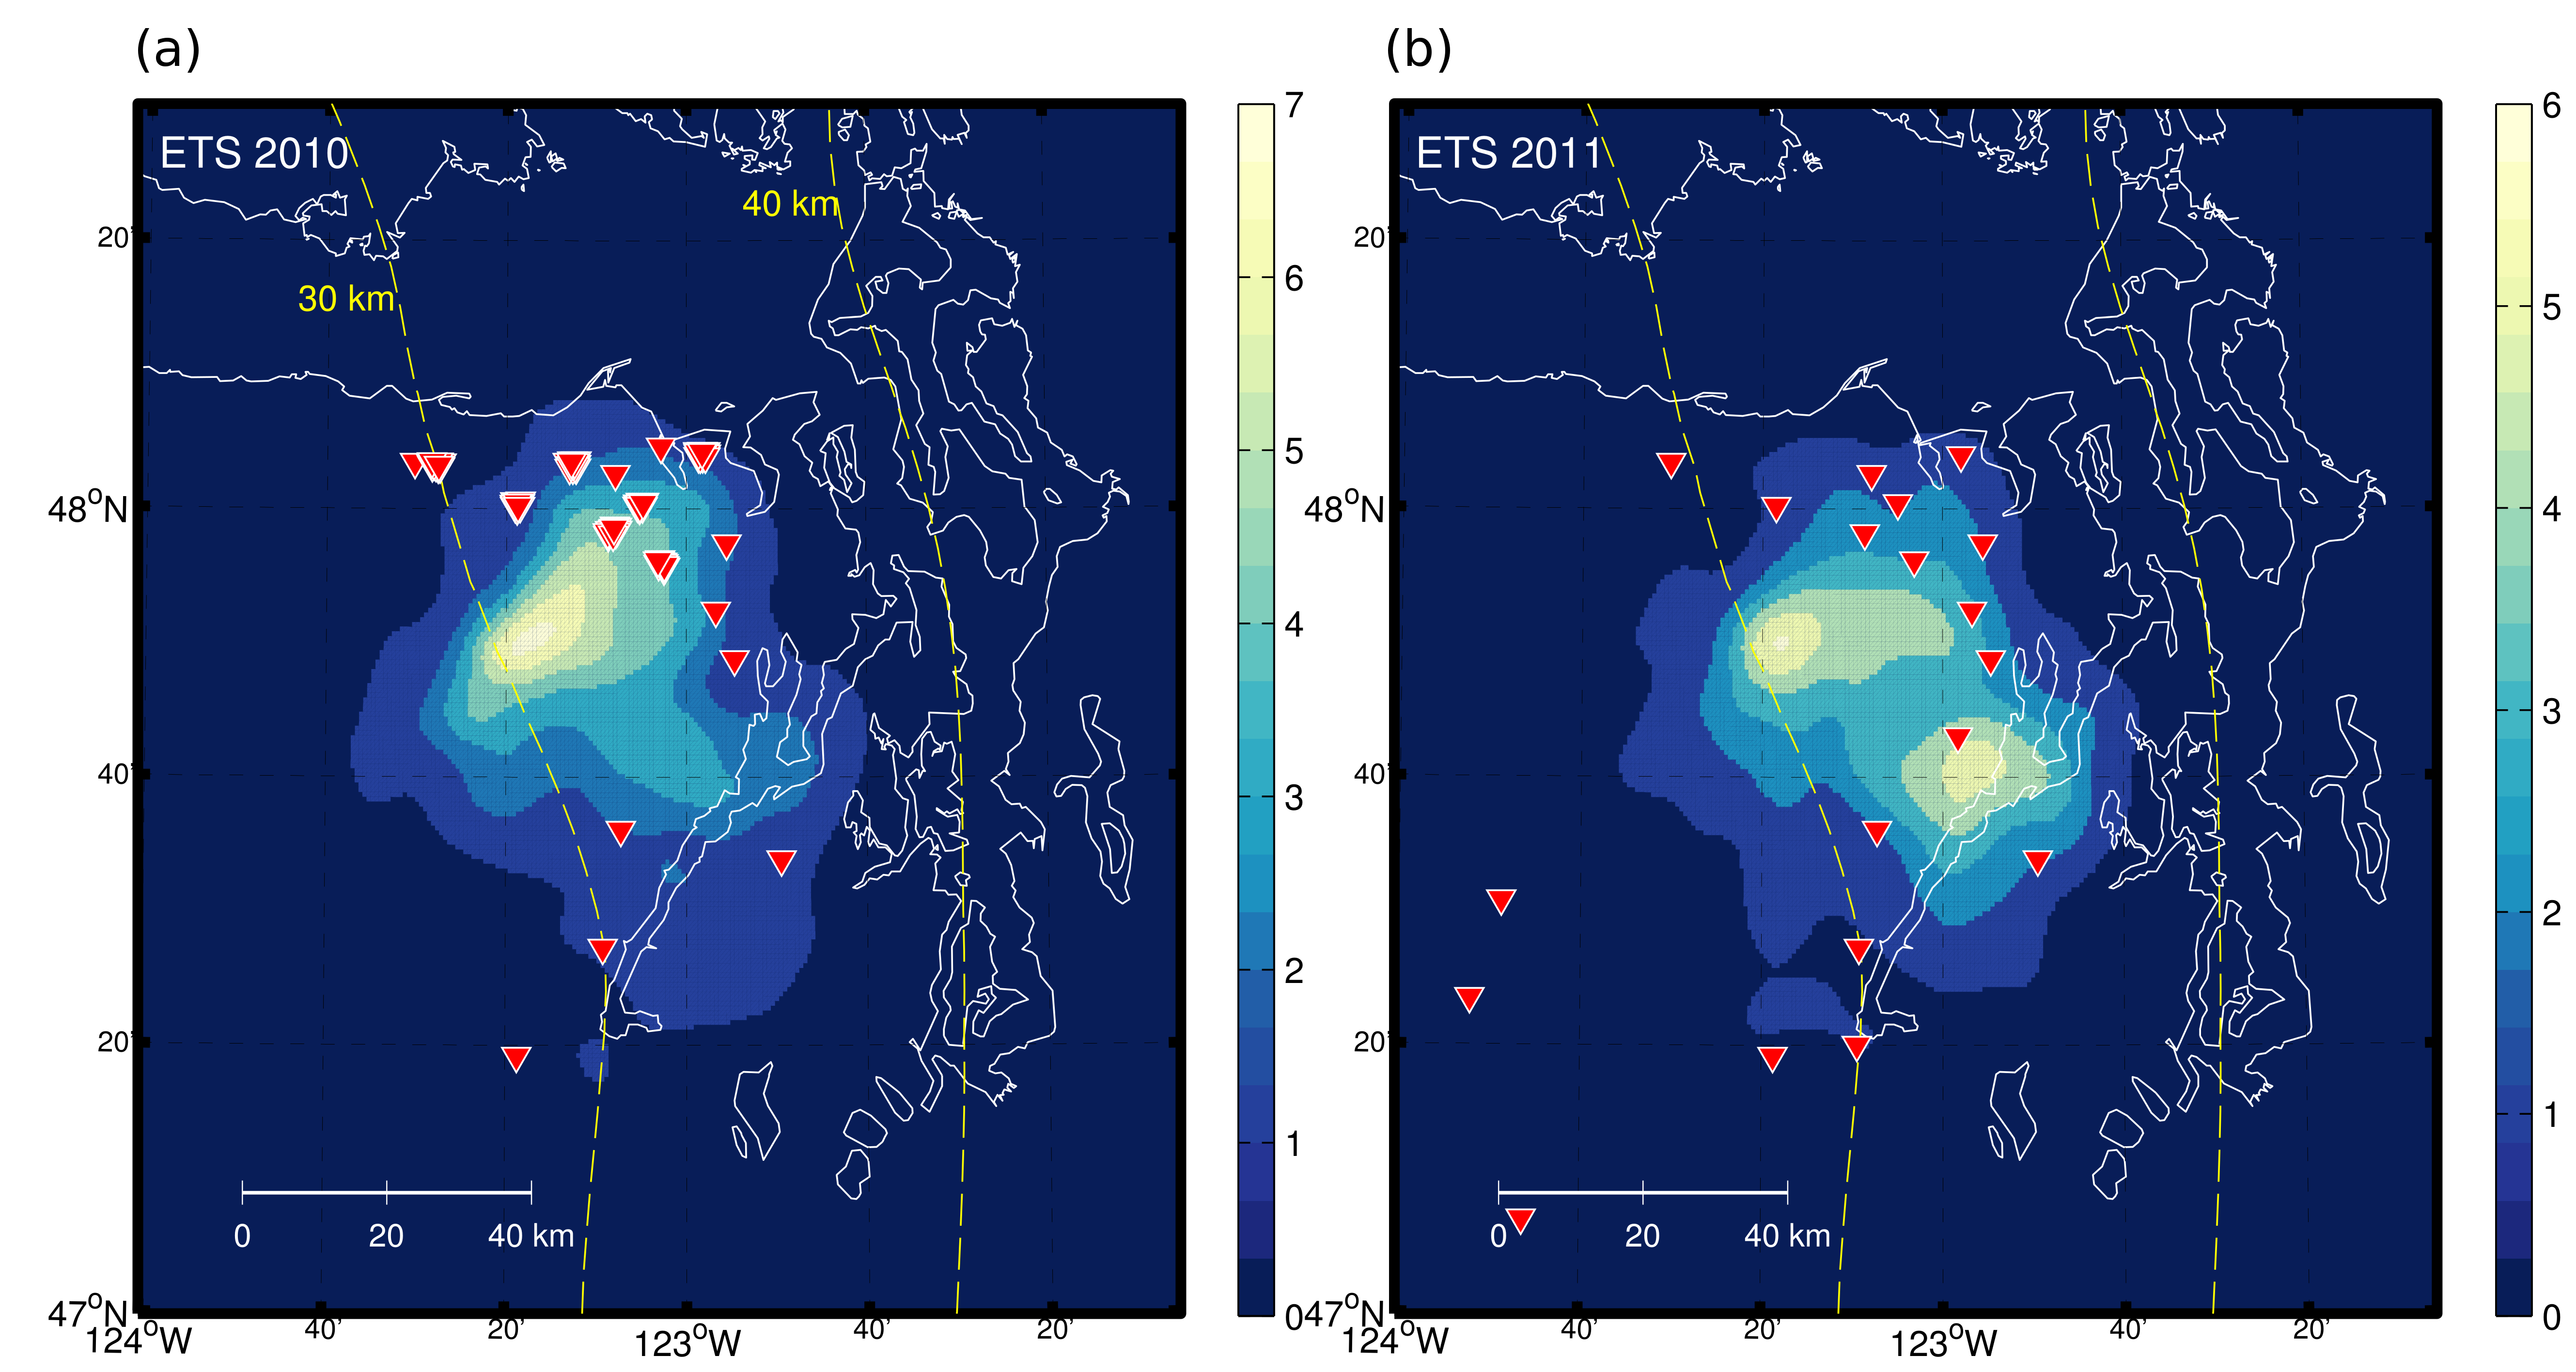
For northern Washington, the calculated density of epicenters for the ETS episodes of 2010 and 2011 is displayed in Figure S5. The two observed asperities correspond geographically to tremor patches in the Wech (2010) catalog. Ghosh et al. (2009) also reported asperities in the same areas for the 2008 ETS episode.
Figure S5. Epicenter density maps of northern Washington state computed using the kernel density estimator of Botev et al. (2010) for (a) the 2010 and (b)2011 ETS episodes. Inverted triangles are the stations used to locate the events for each respective period.
It must be noted that because of station separation constraints and computational efficiency, we separated the stations in southern Vancouver Island and northern Washington into two different sets for which we run the algorithm separately, such that we cannot monitor LFEs continuously across a broad region, including the Juan de Fuca strait, as in the Wech tremor catalog.
For completeness, we include below the time–distance plots with comparison to the template detections, as in Figure 8 of the main article for the 2003 and 2005 ETS episodes.
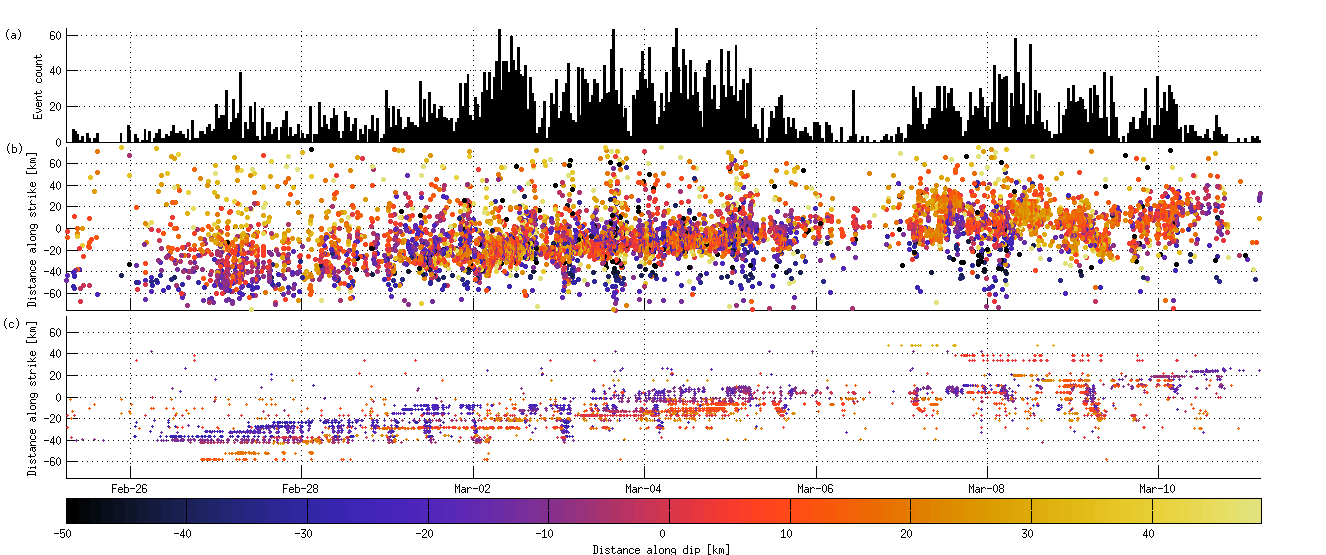
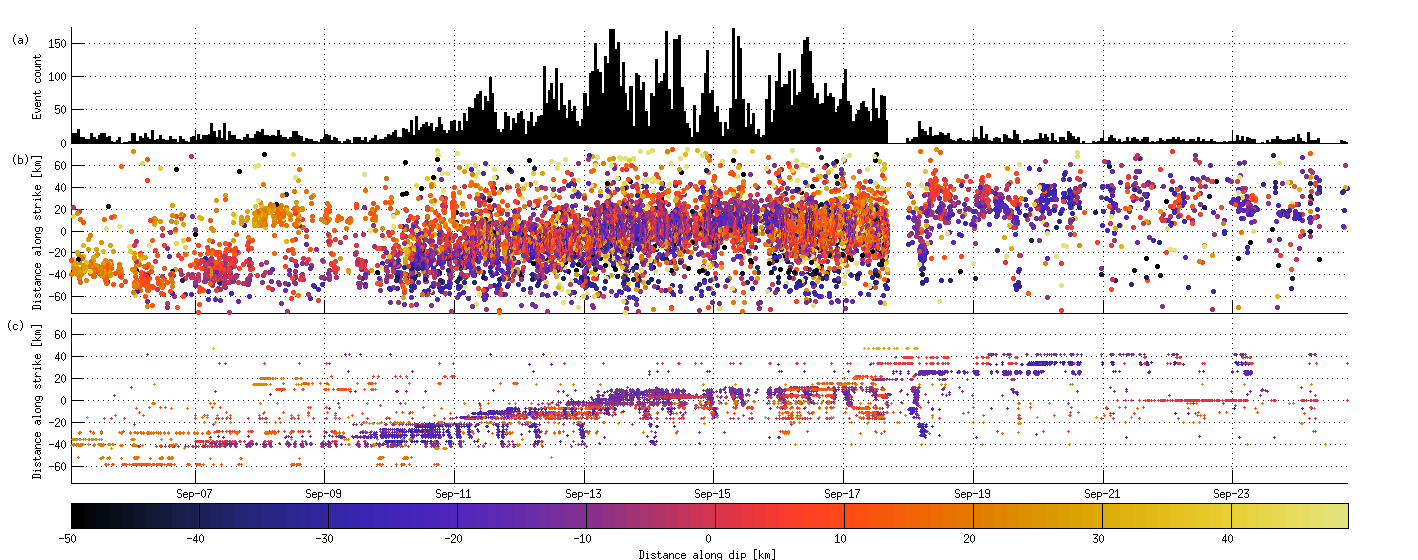
Figure S6. Cross-station detections compared with template detections for the 2003 ETS episode. (a) Number of cross-station detections with respect to time. (b) Distance along-strike is plotted against time for our cross-station detections, and data points are color-coded for the distance along dip. The profiles used to compute along-strike and along-dip distances are shown in Figure 10 of the main article (dark colors are updip, clear colors are downdip). (c) Same as (b) but for template detections.
Figure S7. Same as Figure S6 but for the 2005 ETS episode.
Audet, P., M. G. Bostock, D. C. Boyarko, M. R. Brudzinski, and R. M. Allen (2010). Slab morphology in the Cascadia forearc and its relation to episodic tremor and slip, J. Geophys. Res. 115, no. B00A16, doi: 10.1029/2008JB006053.
Botev, Z. I., J. F. Grotowski, and D. P. Kroese (2010). Kernel density estimation via diffusion, Ann. Stat. 38, no. 5, 2916–2957.
Ghosh, A., J. E. Vidale, and K. C. Creager (2012). Tremor asperities in the transition zone control evolution of slow earthquakes, J. Geophys. Res. 117, no. B10, B10301, doi: 10.1029/2012JB009249.
Ghosh, A., J. E. Vidale, J. Sweet, K. C. Creager, and A. Wech (2009). Tremor patches in Cascadia revealed by seismic array analysis, Geophys. Res. Lett. 36, L17316, doi: 10.1029/2009GL039080.
Wech, A. G. and K. C. Creager (2008). Automated detection and location of Cascadia tremor, Geophys. Res. Lett. 35, L20302, doi: 10.1029/2008GL035458.
Wech, A. G. (2010). Interactive tremor monitoring, Seismol. Res. Lett. 81, no. 4, 664–669.
[ Back ]