The main article provides in-depth discussion on four rupture scenarios out of a total of sixteen. This supplementary section contains additional details of ground motions from these four models, including low-frequency intensity plots, synthetic seismograms, and comparisons with ground-motion prediction equations (GMPEs). It also includes plots of total slip for the twelve source models that were not used for ground-motion calculations.
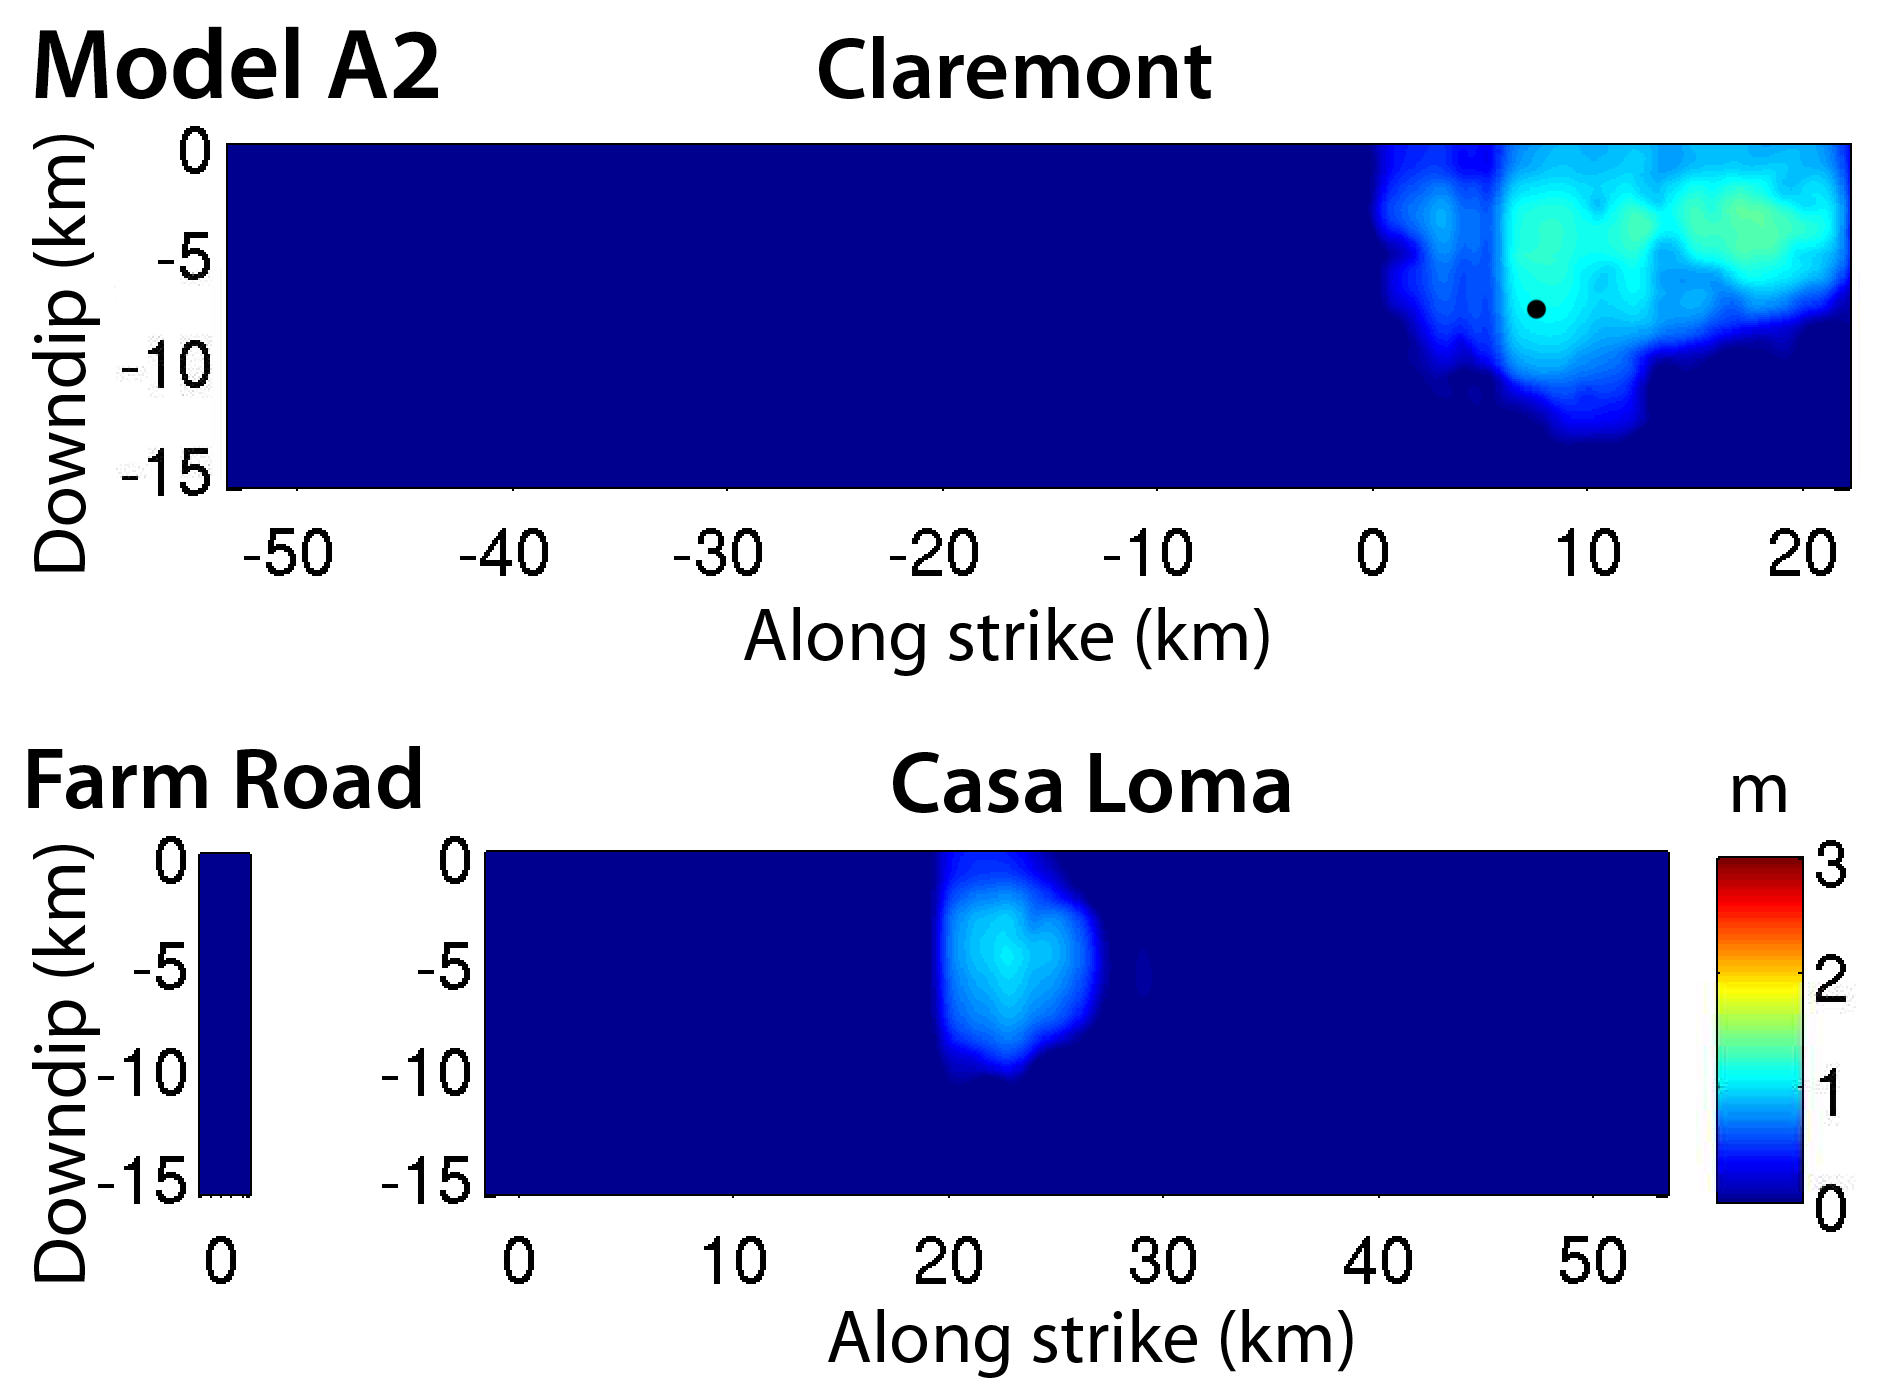
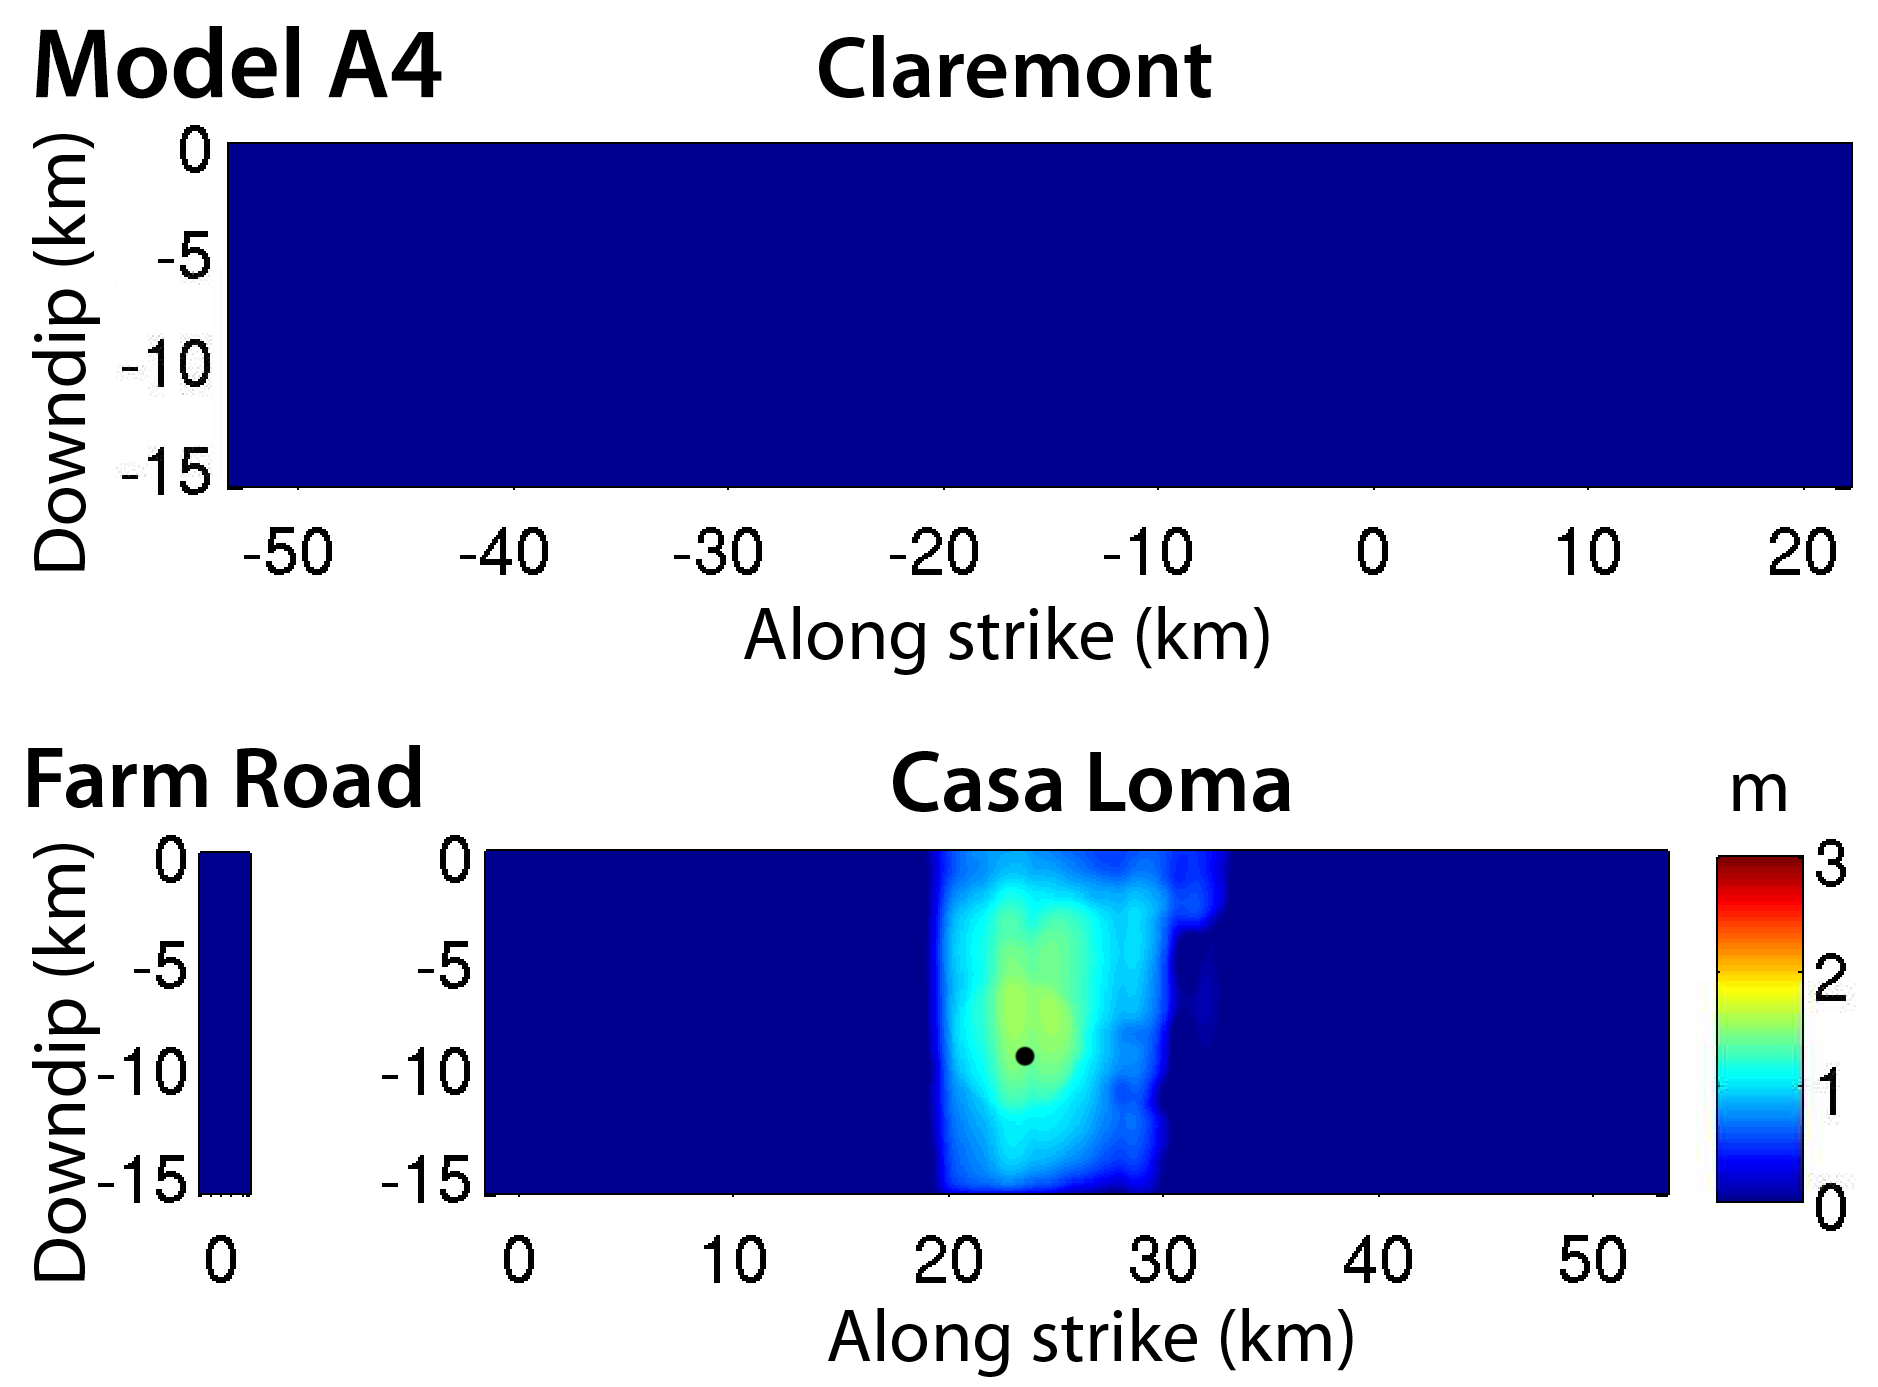
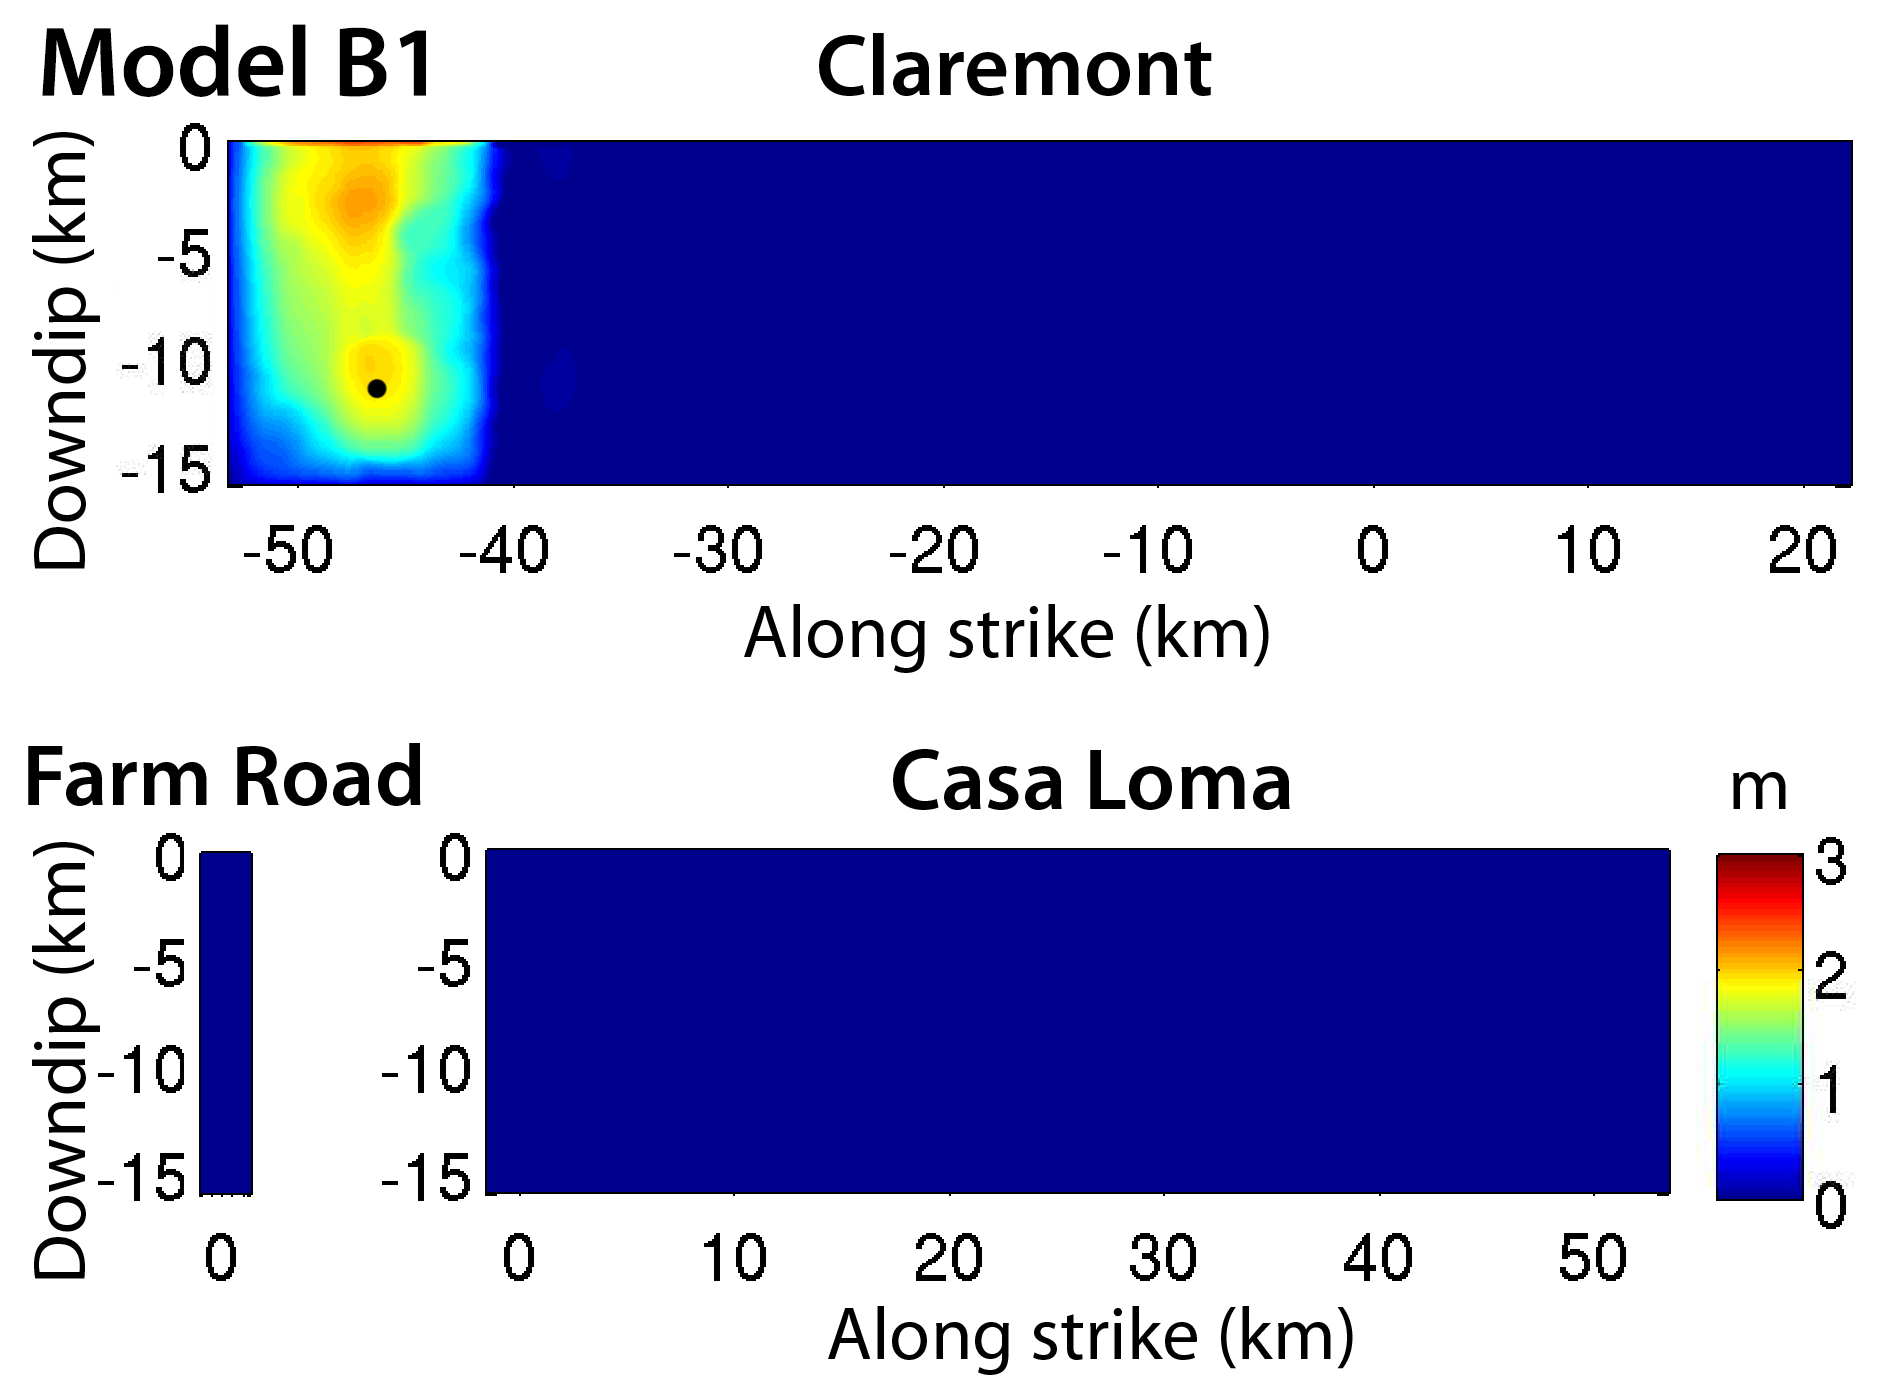
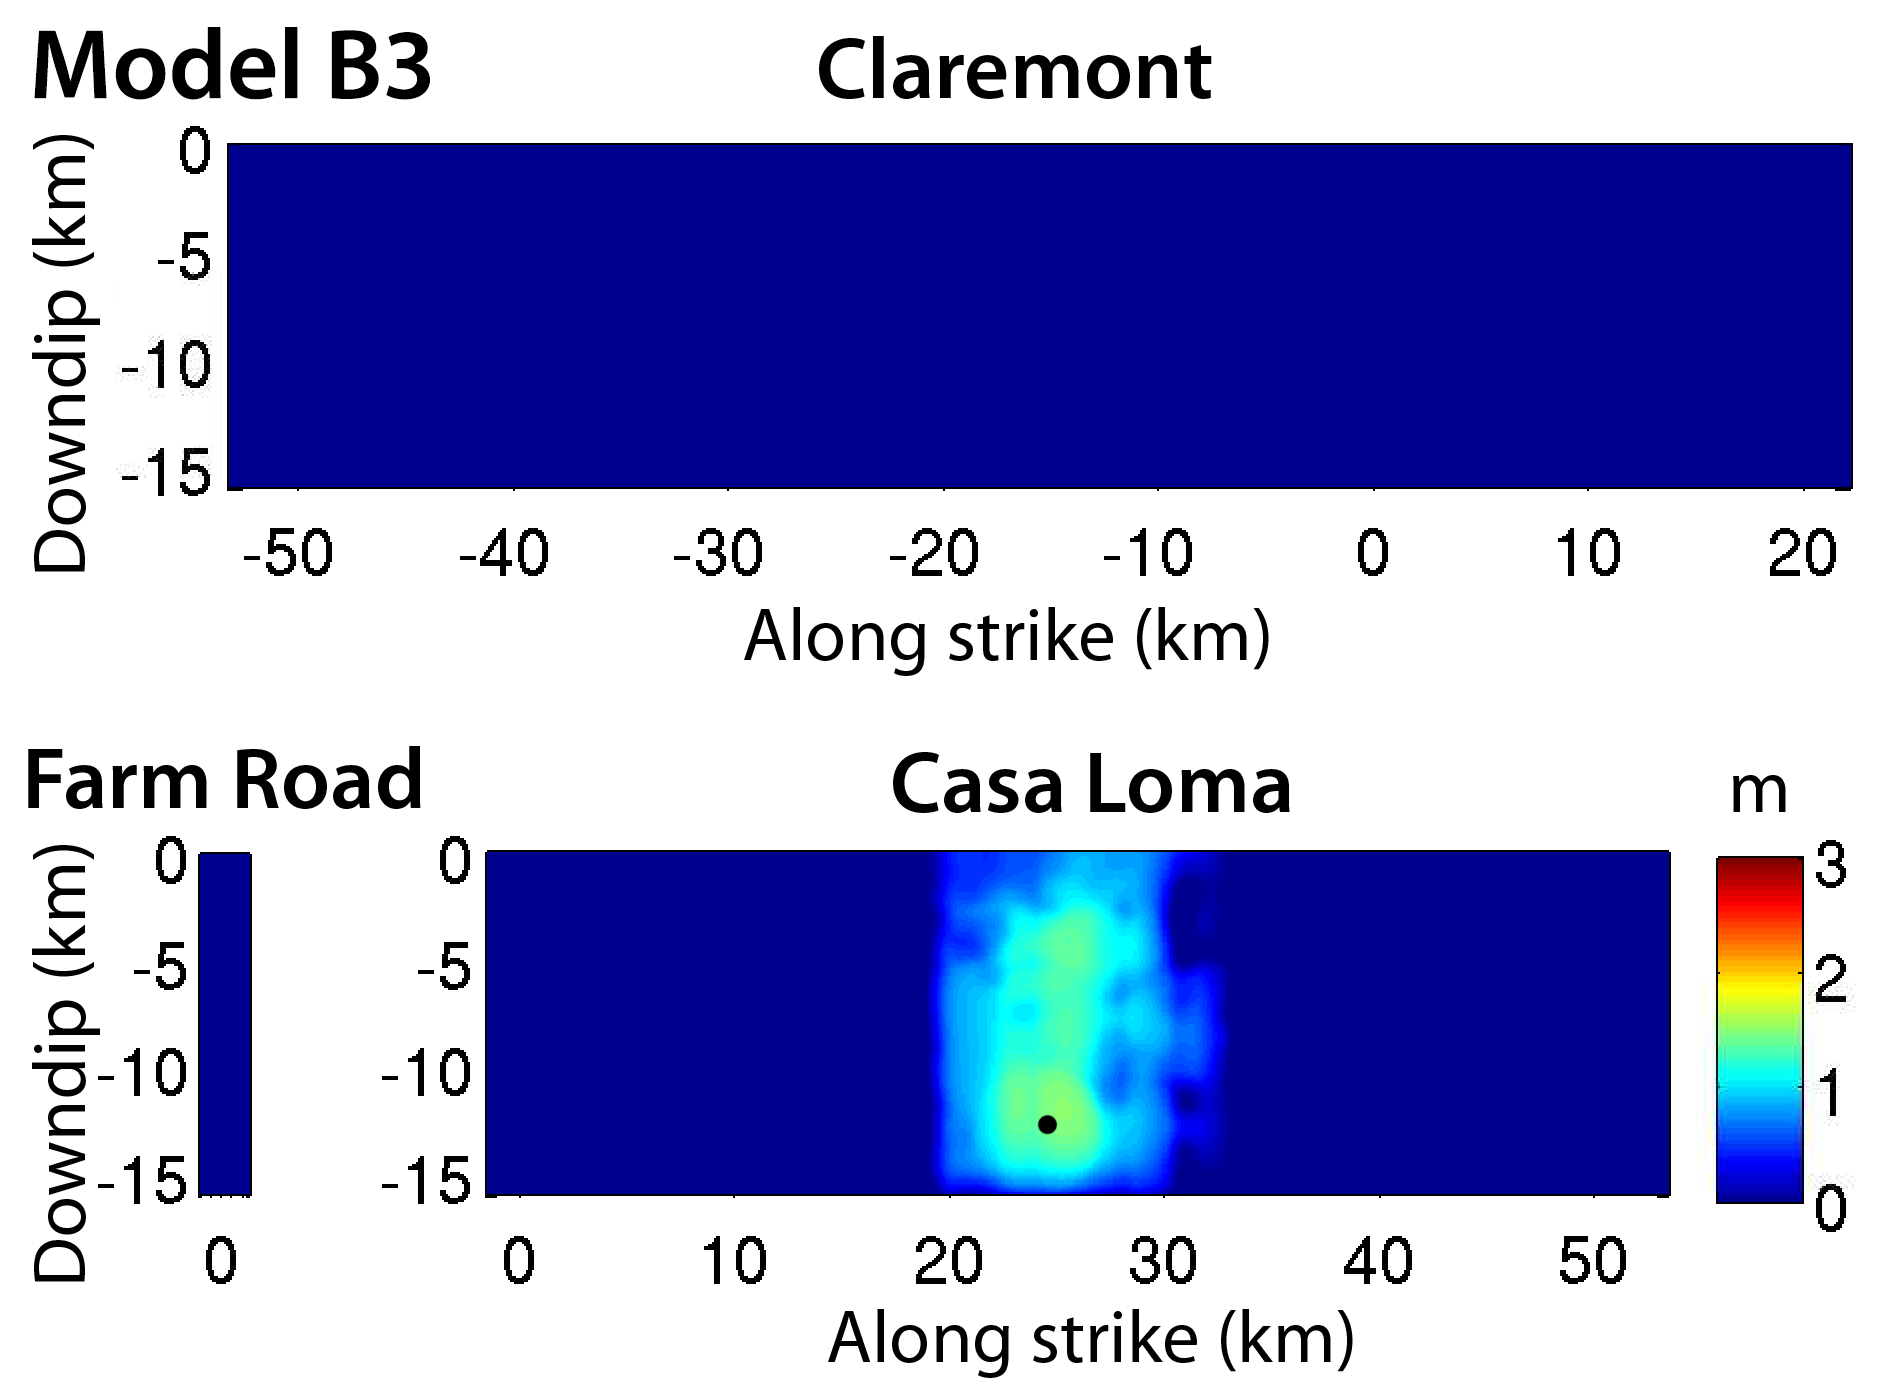
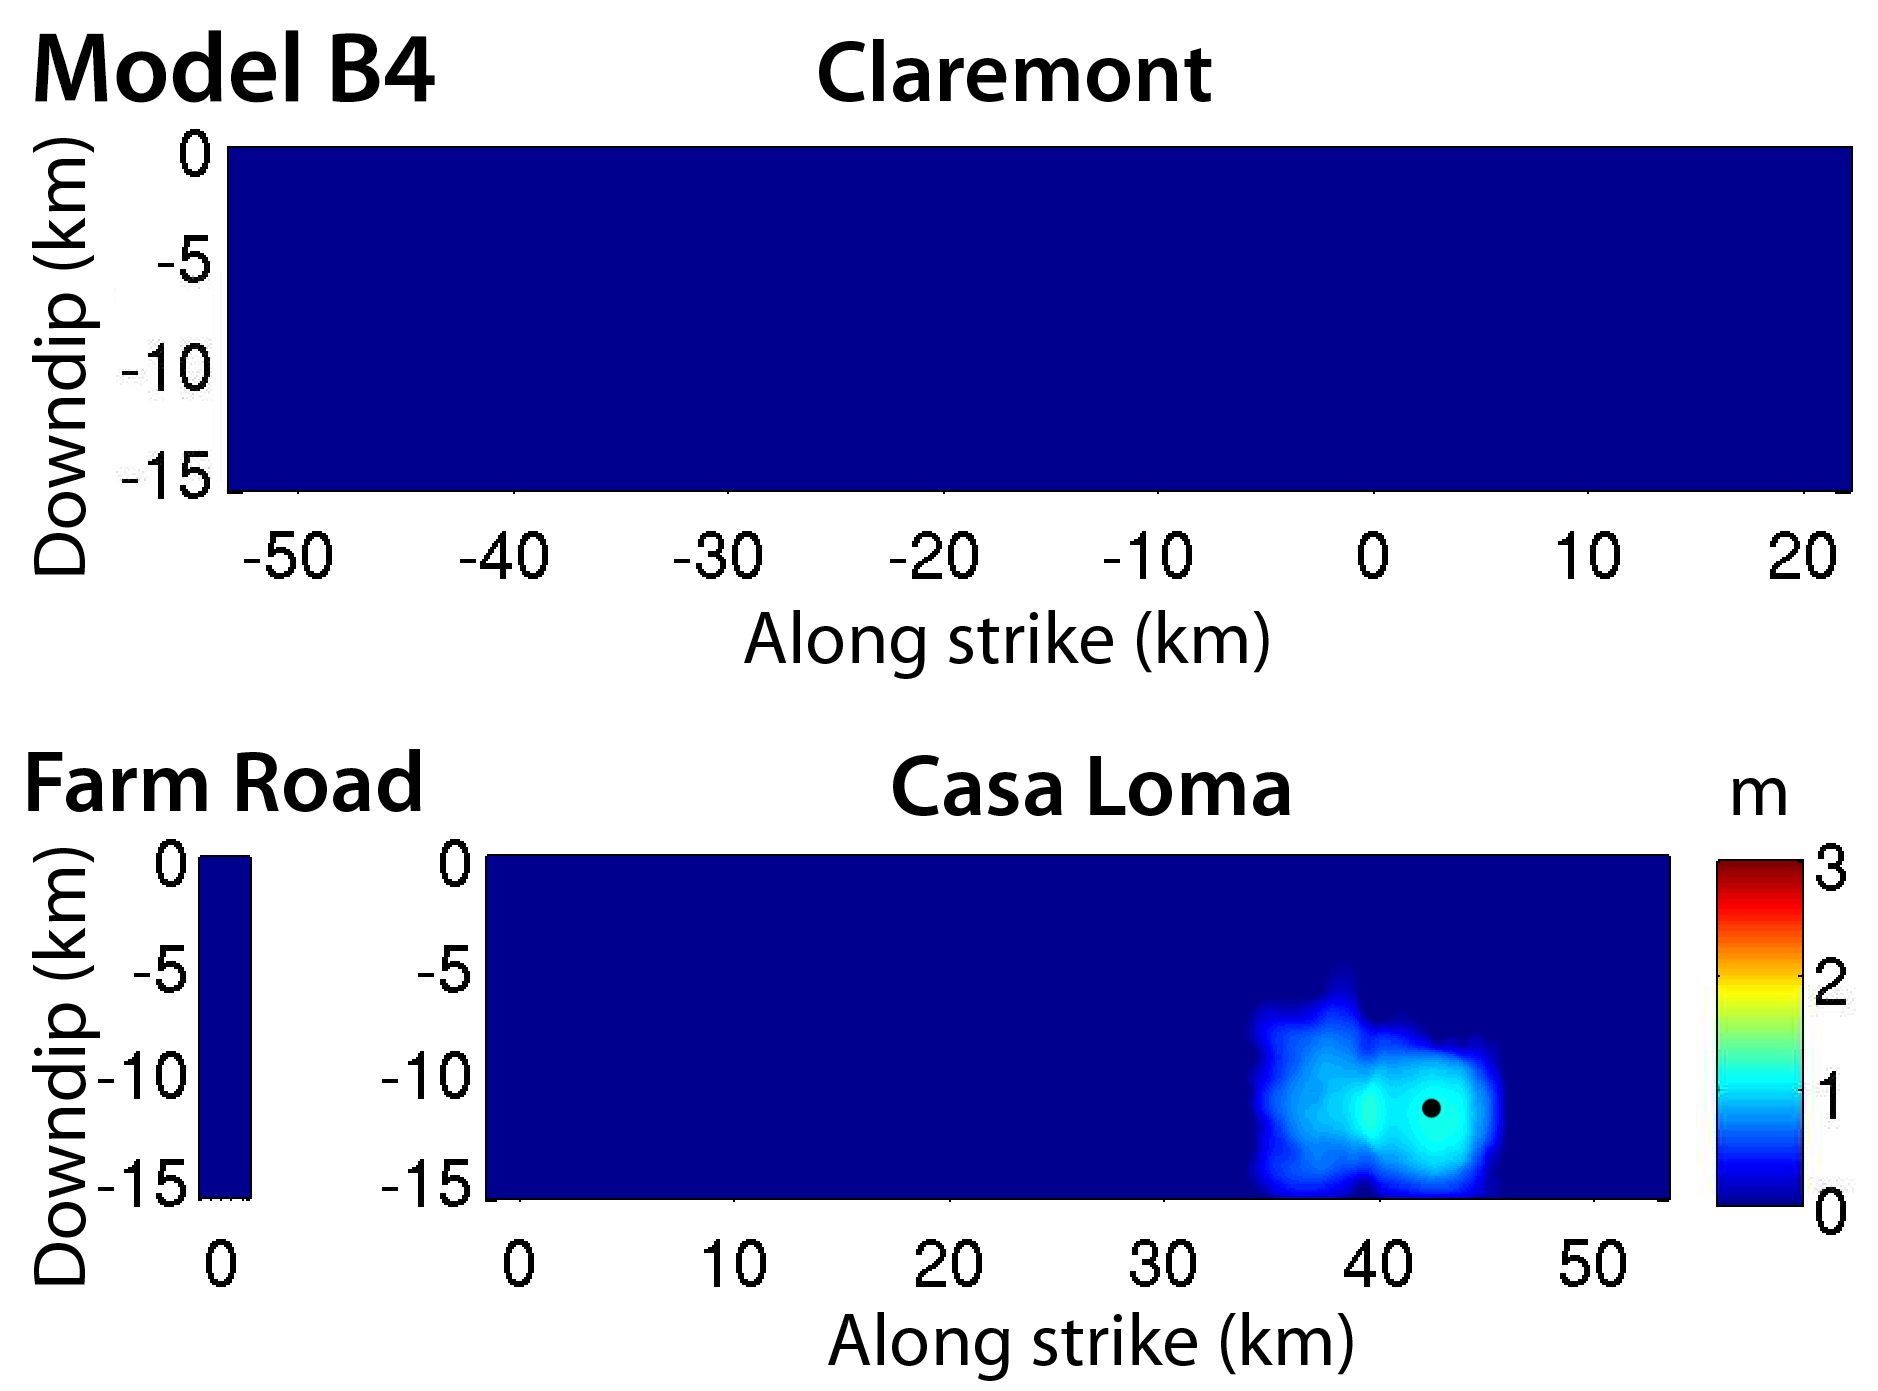
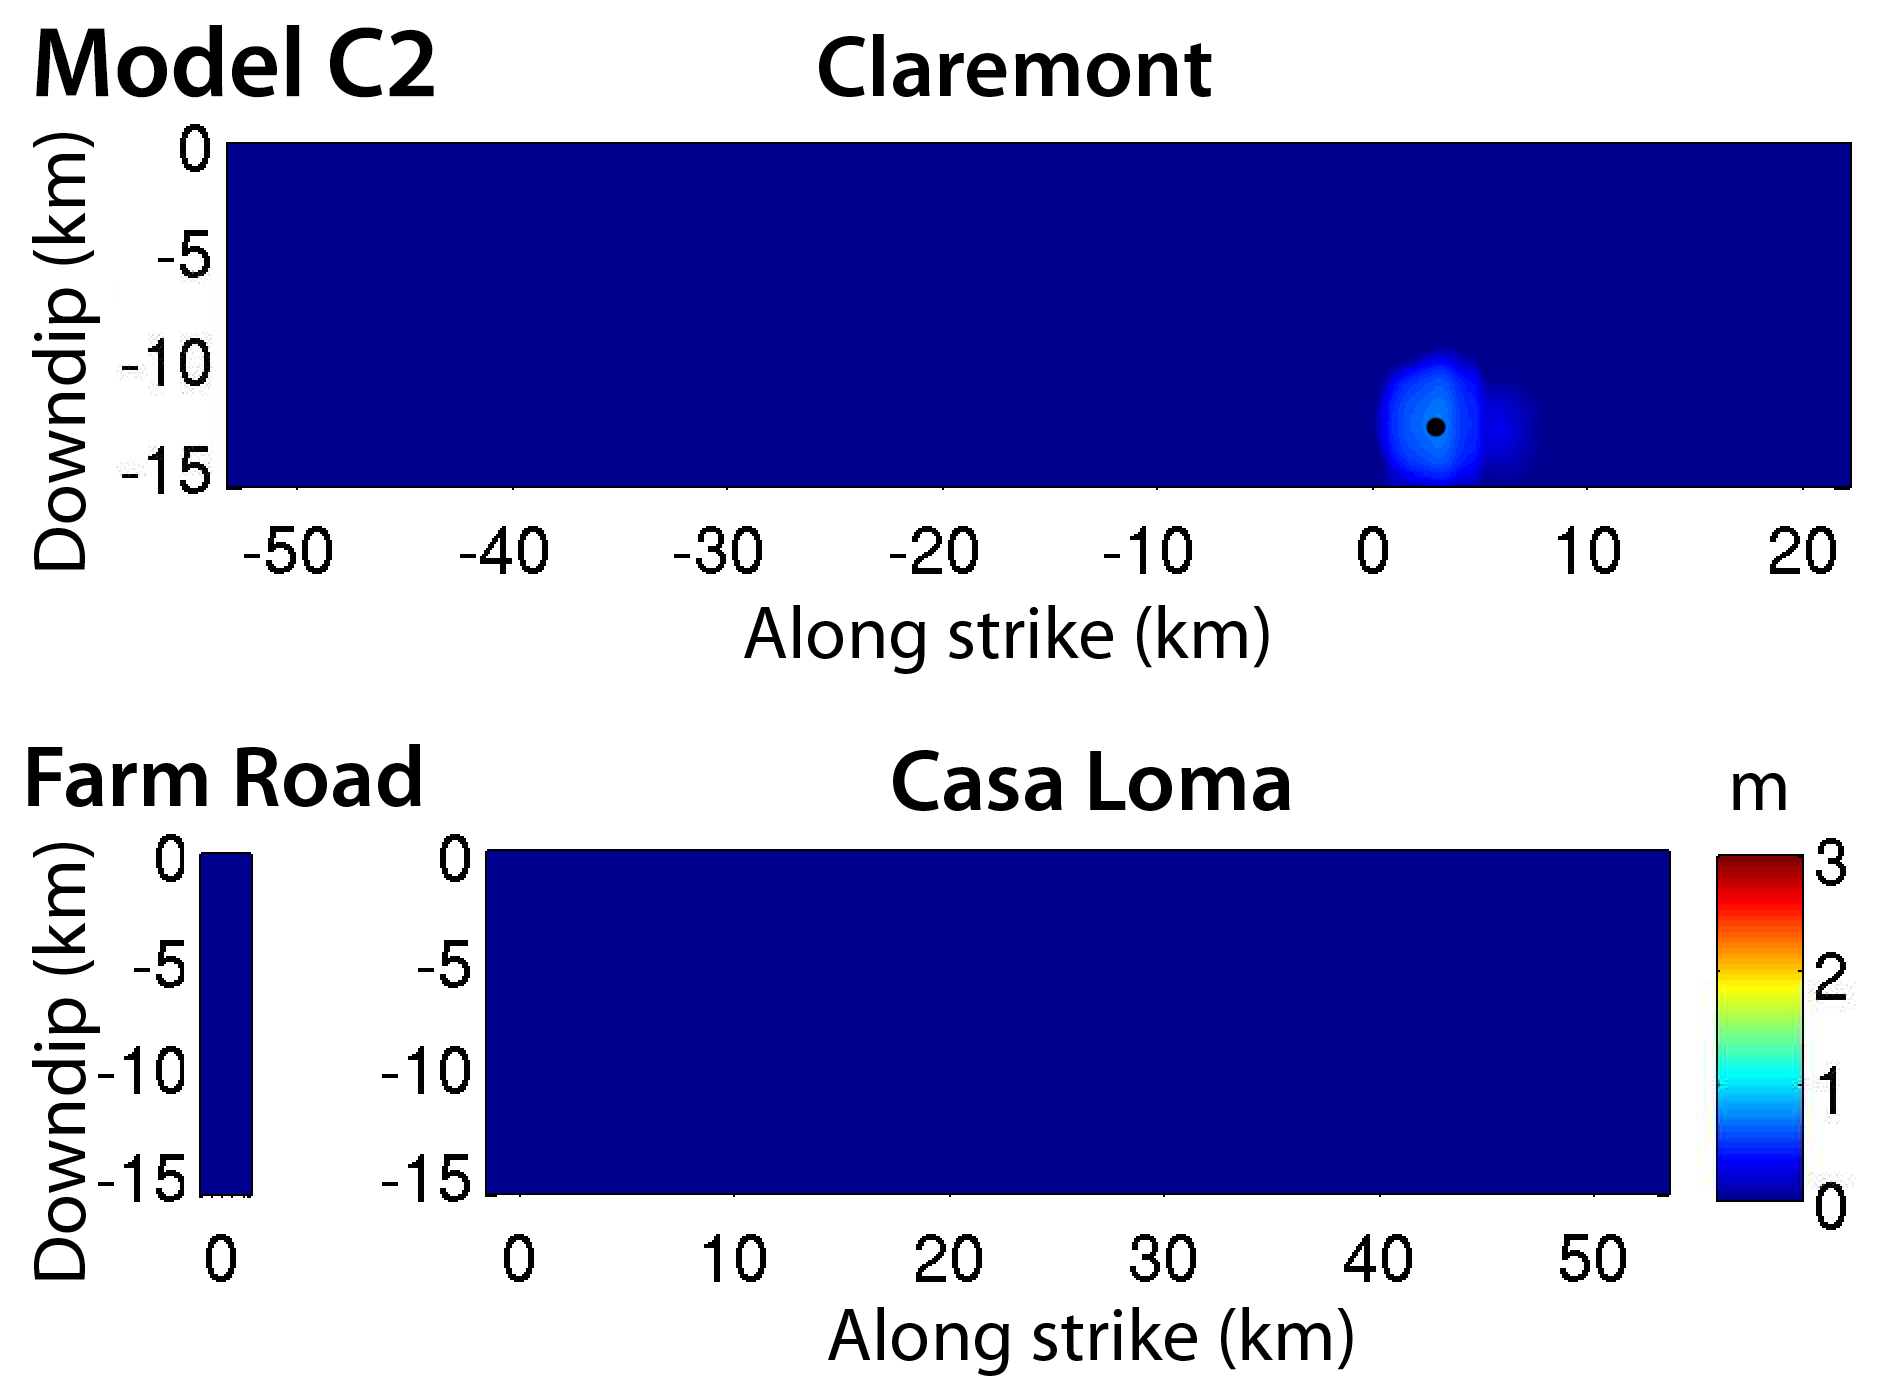
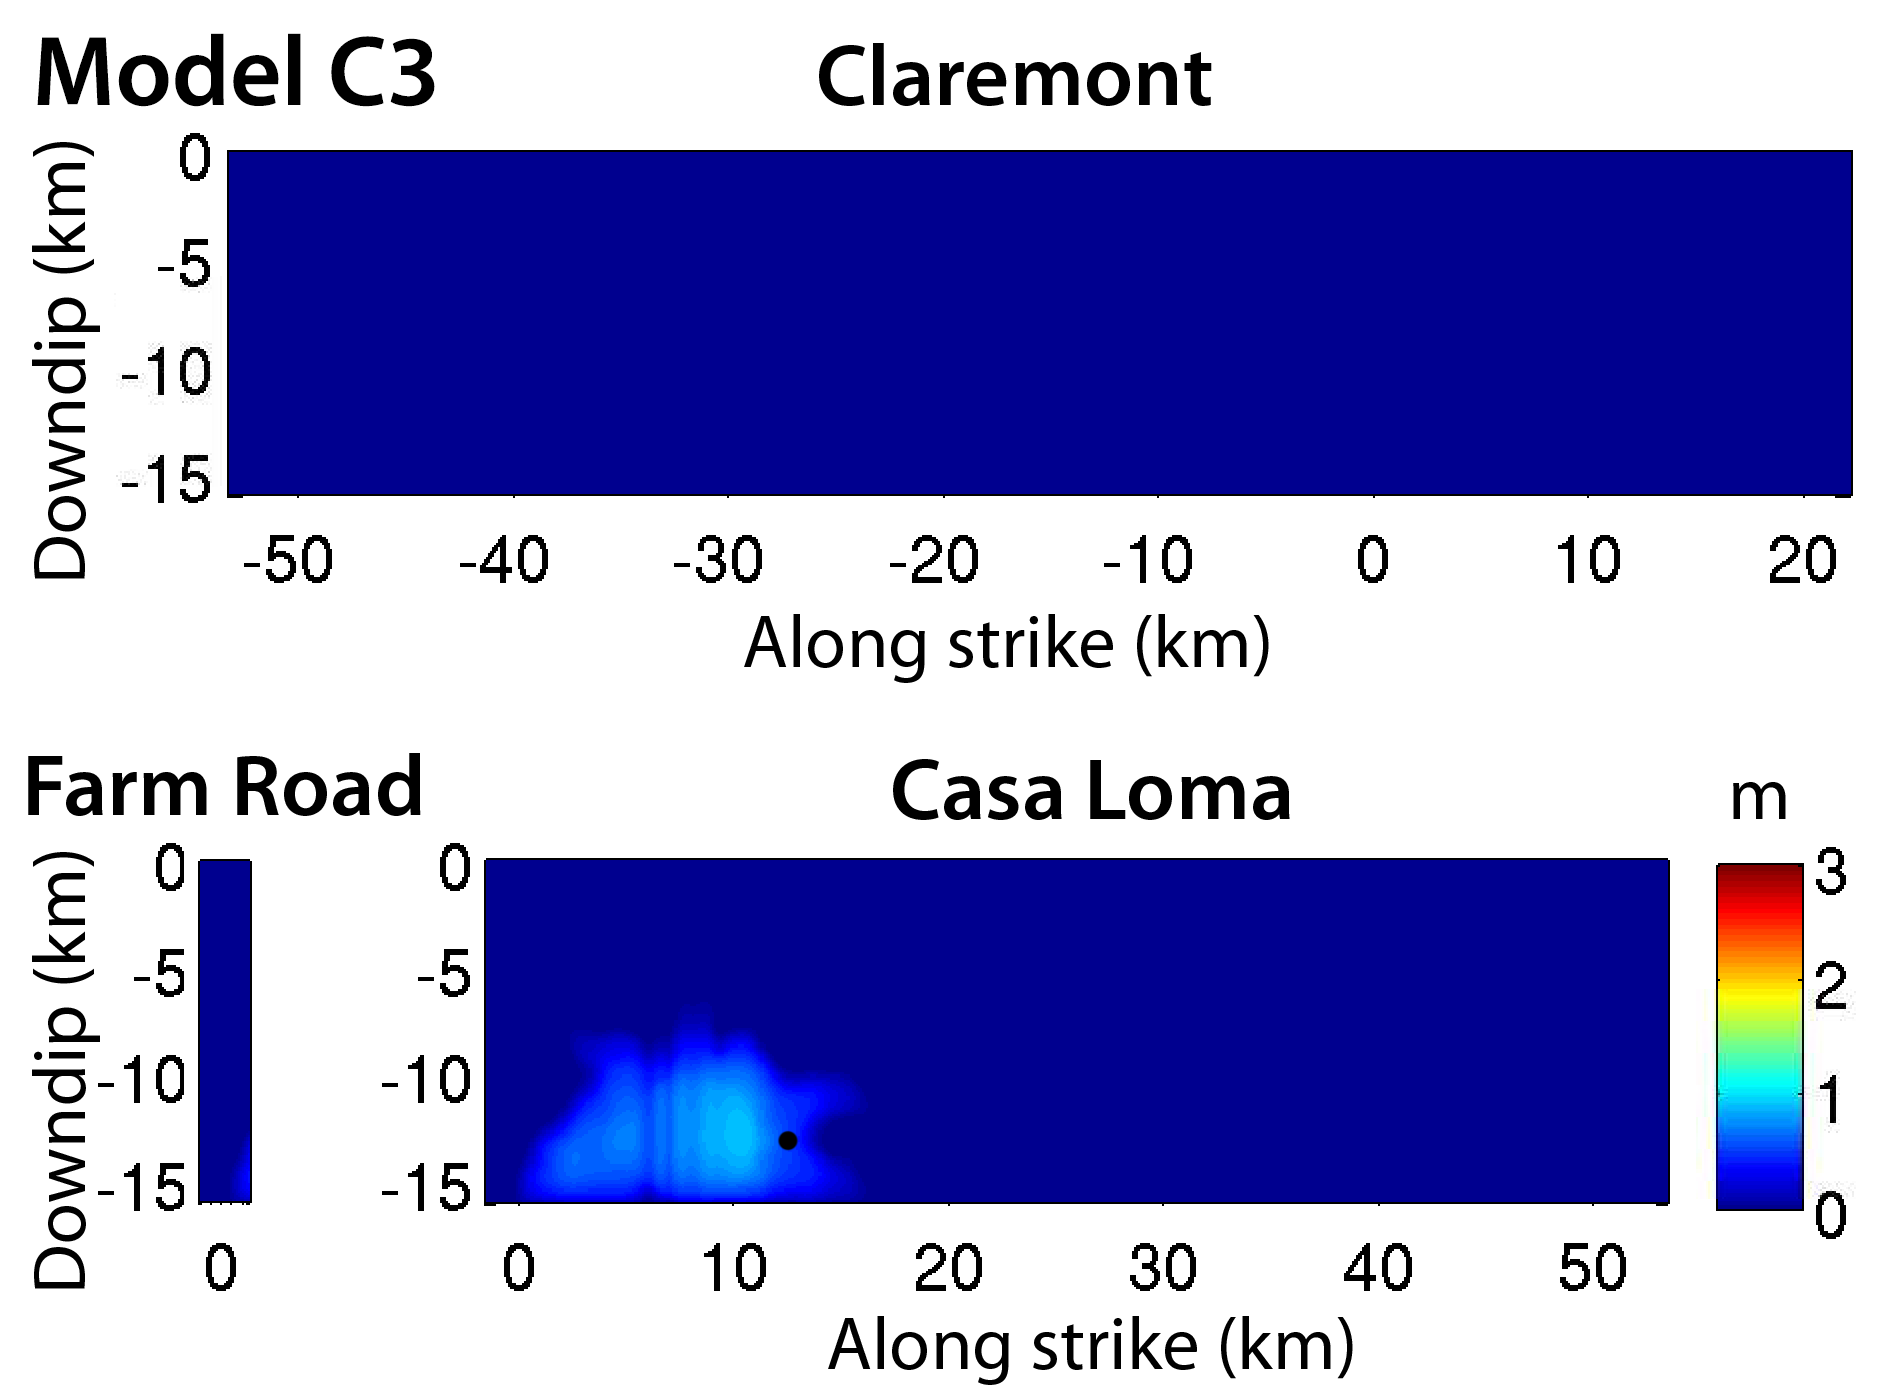
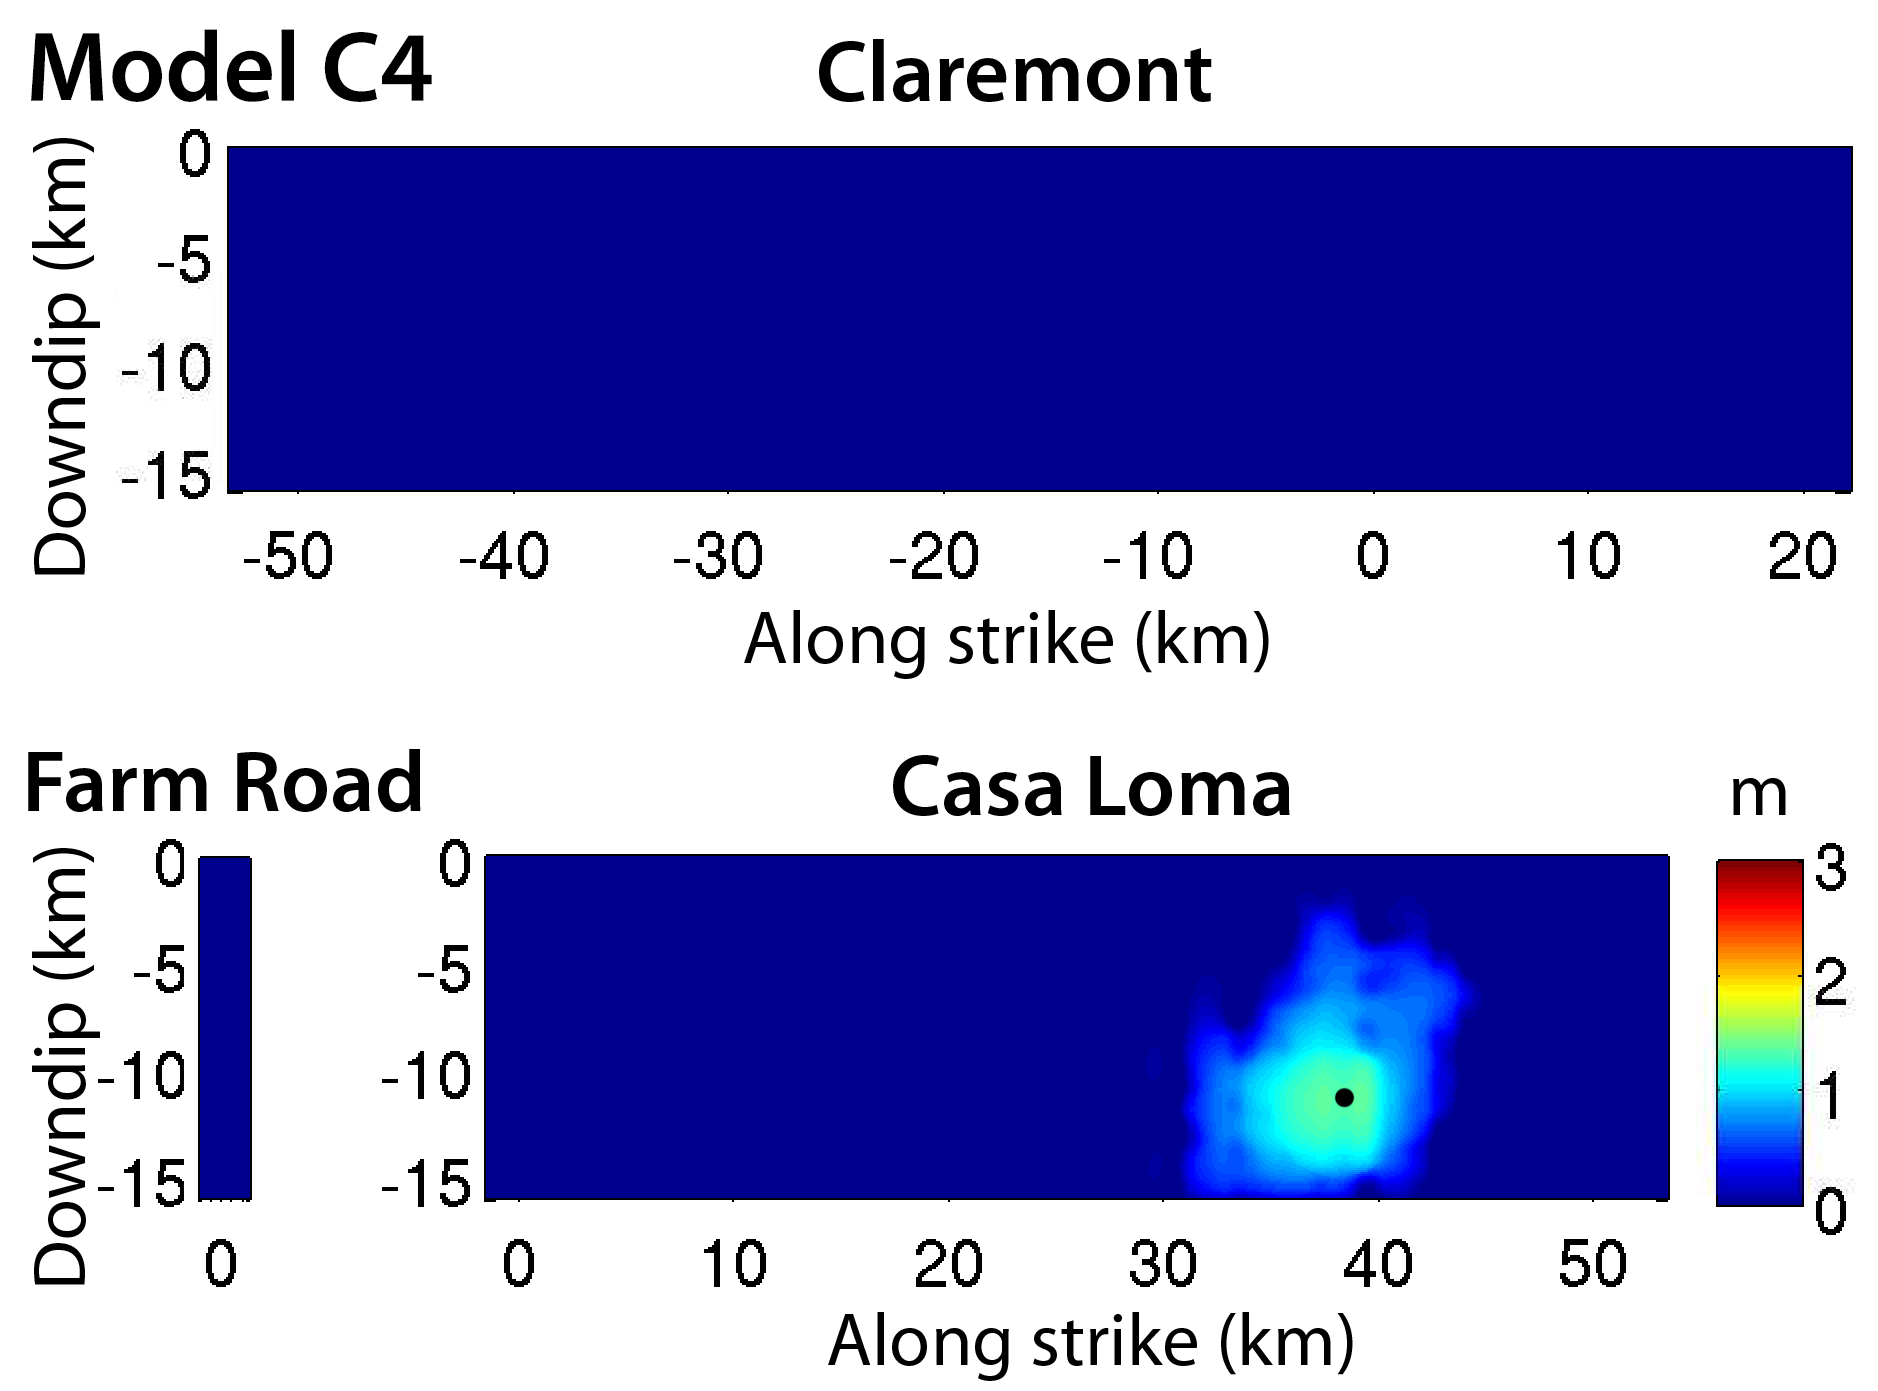
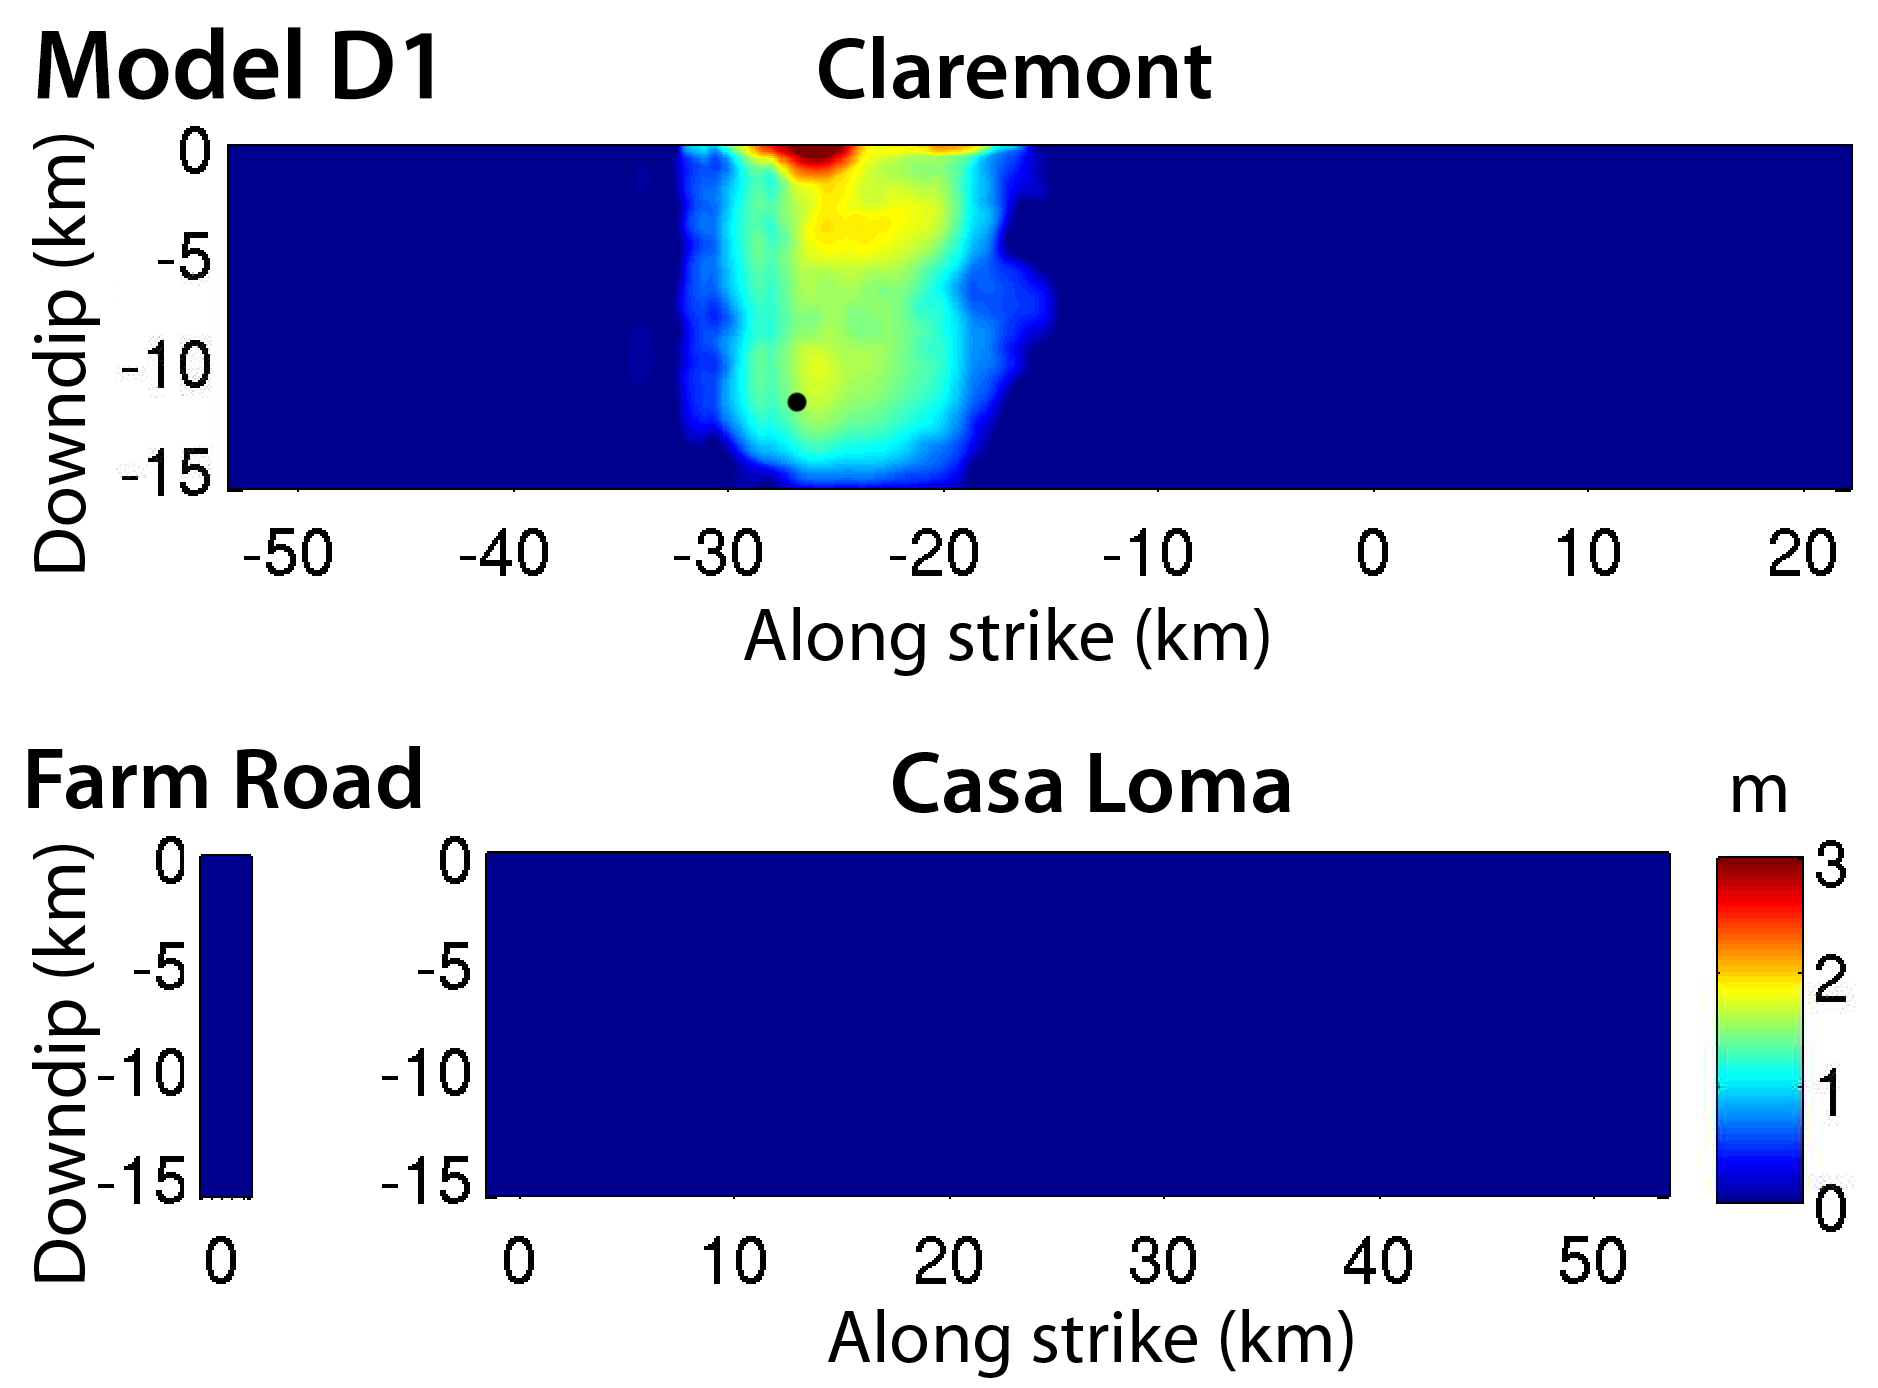
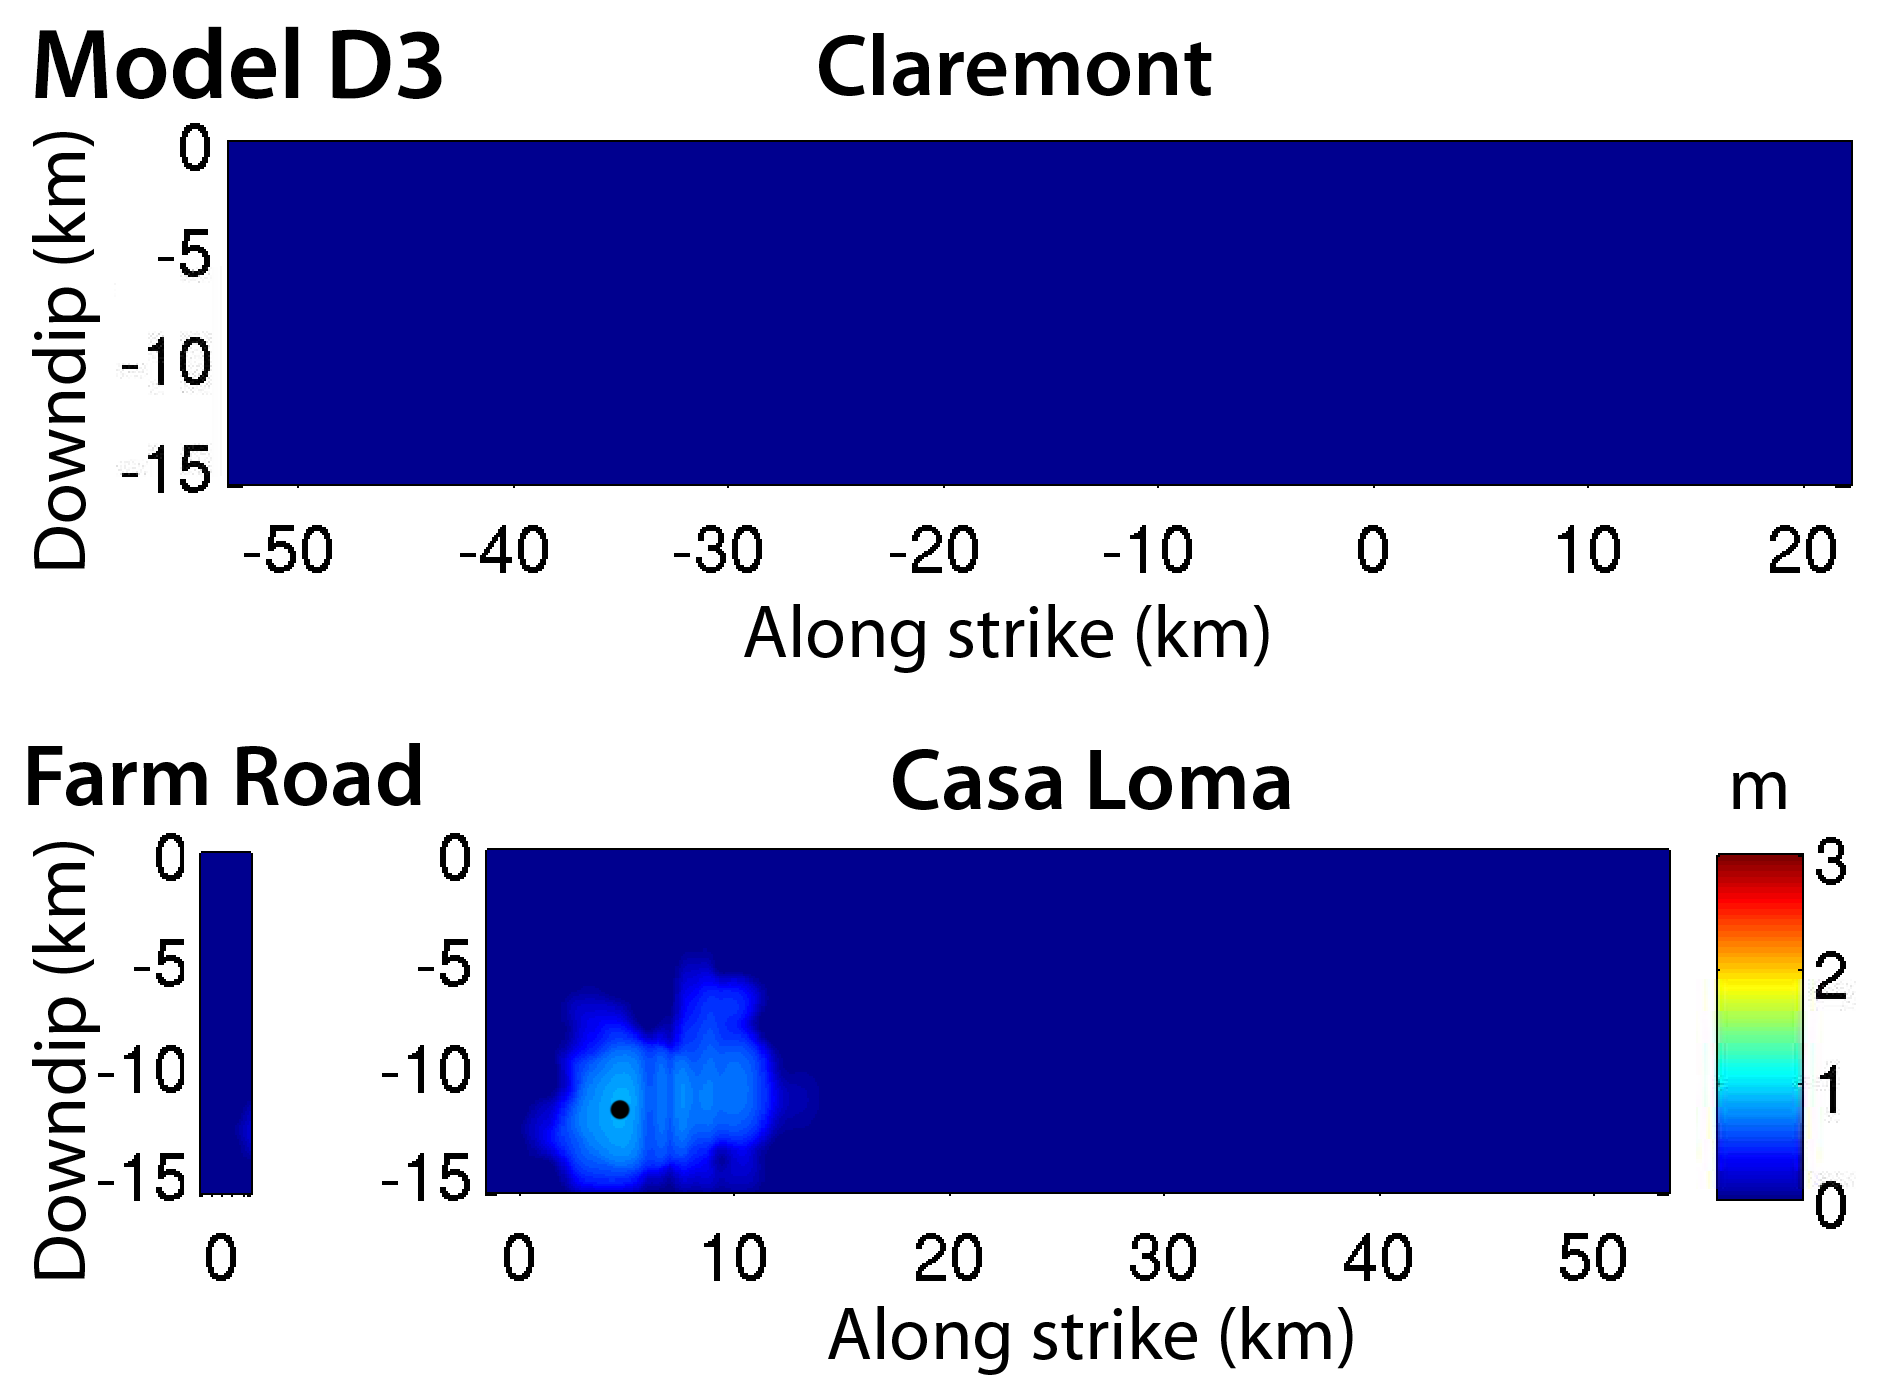
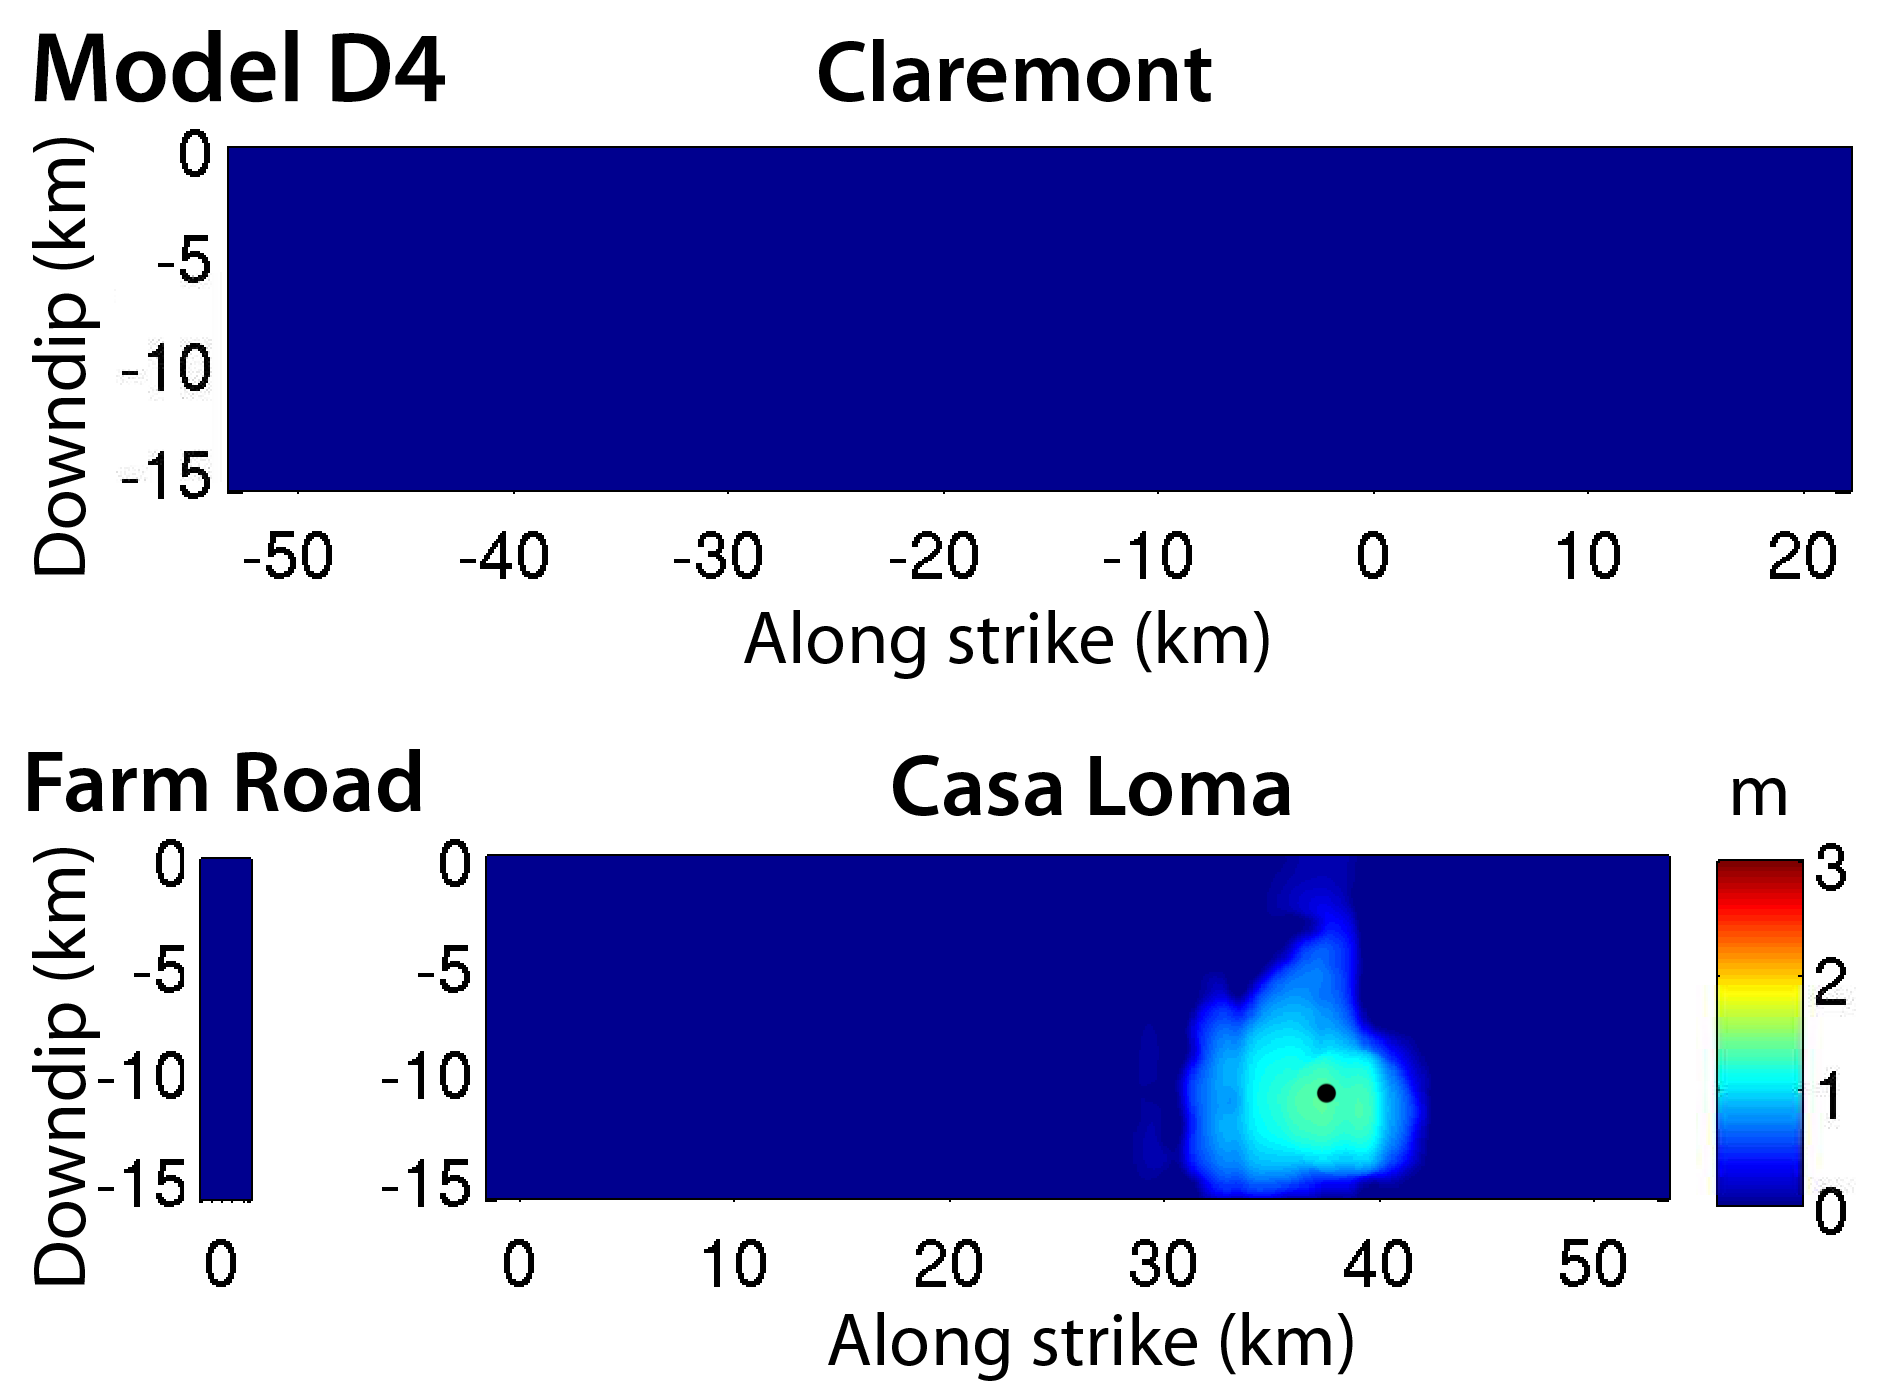
Figure S1a, b, c, d, e, f, g, h, i, j, k, and l. Plots of total horizontal slip for the twelve dynamic rupture models that were not used to generate broadband synthetic seismograms. The black dot in each plot represents the initial nucleation point, corresponding to Figure 4 of the main article.
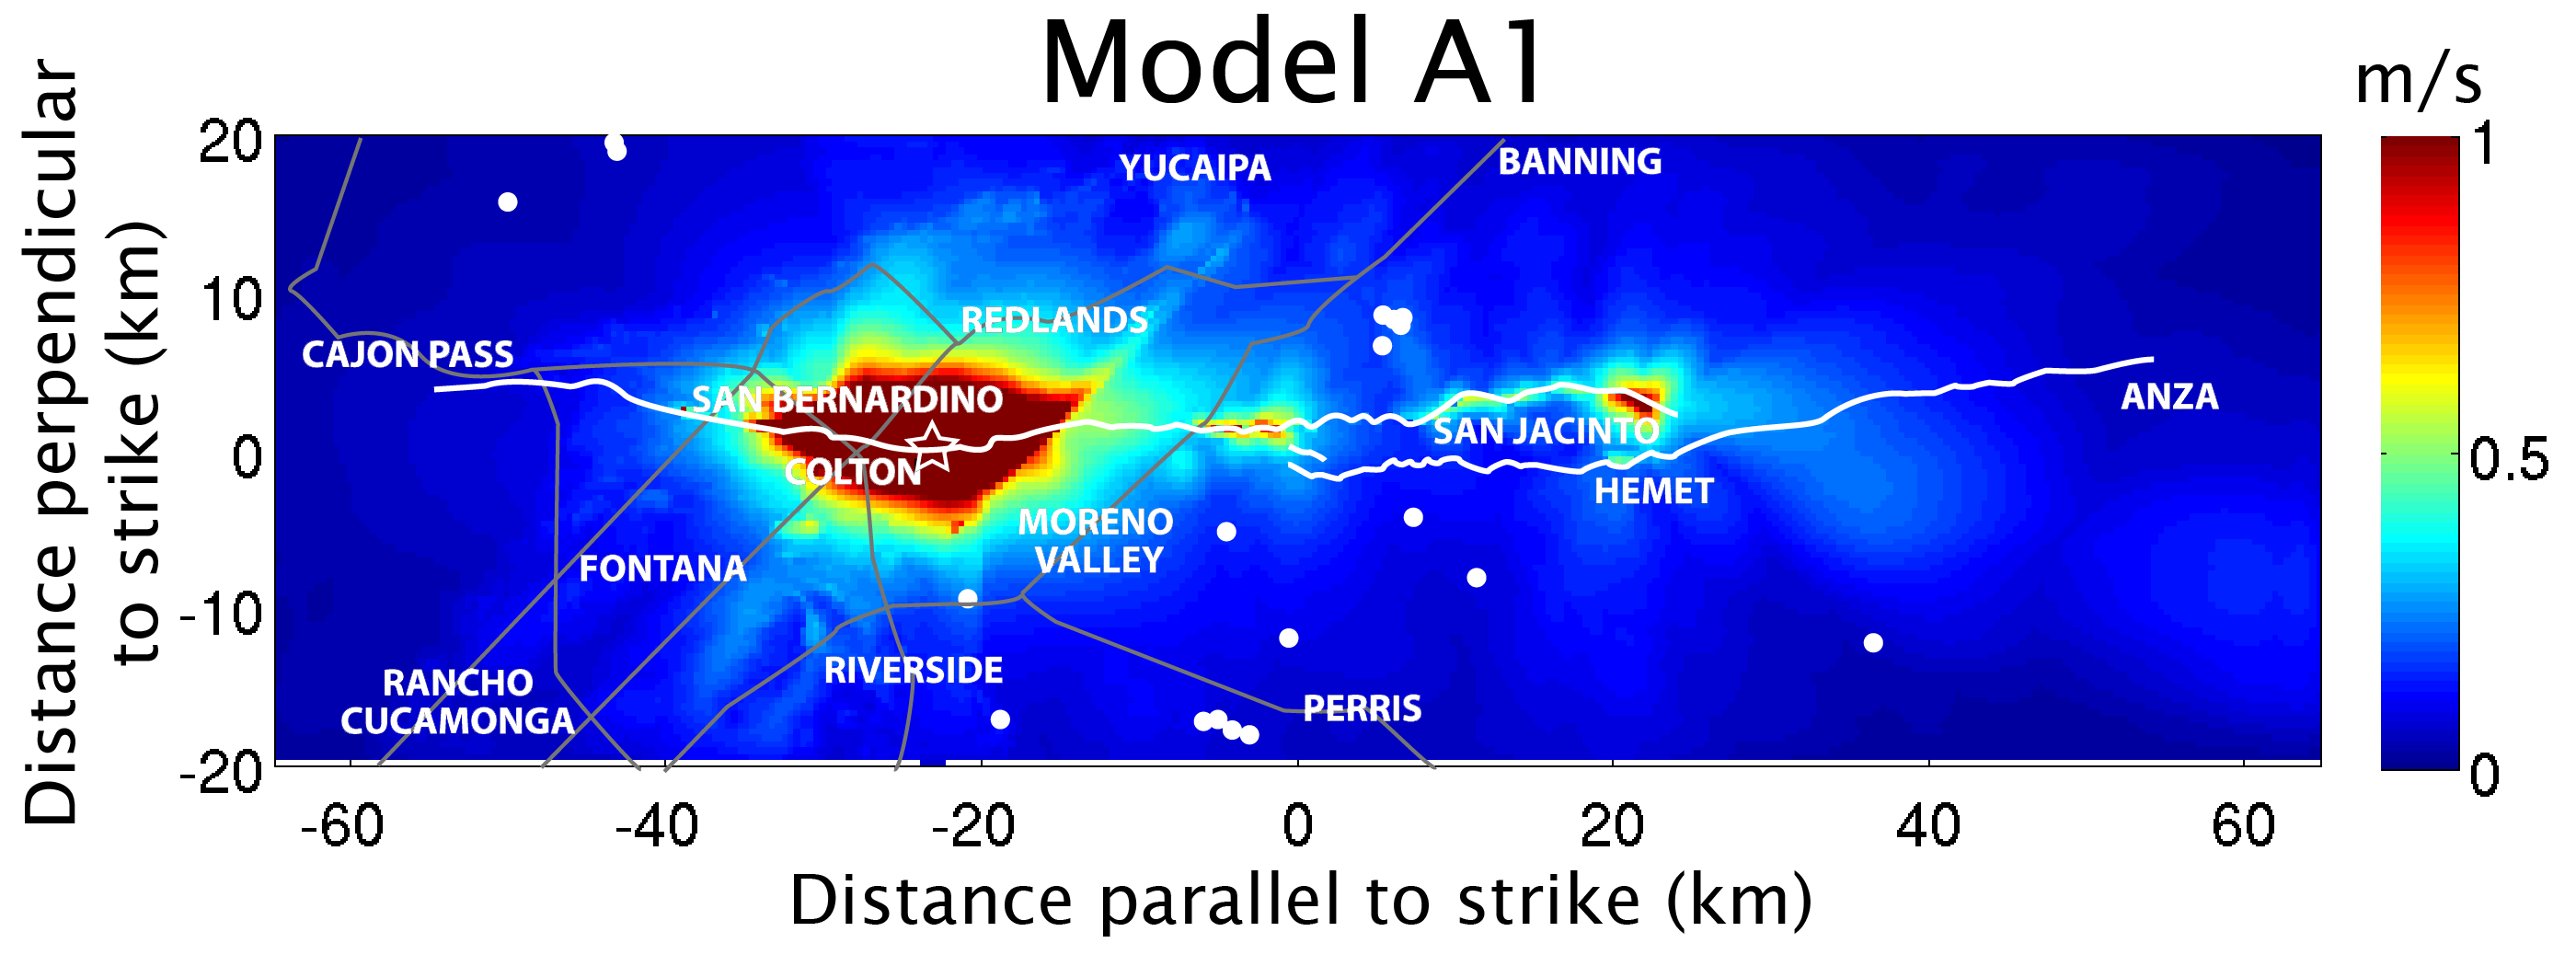
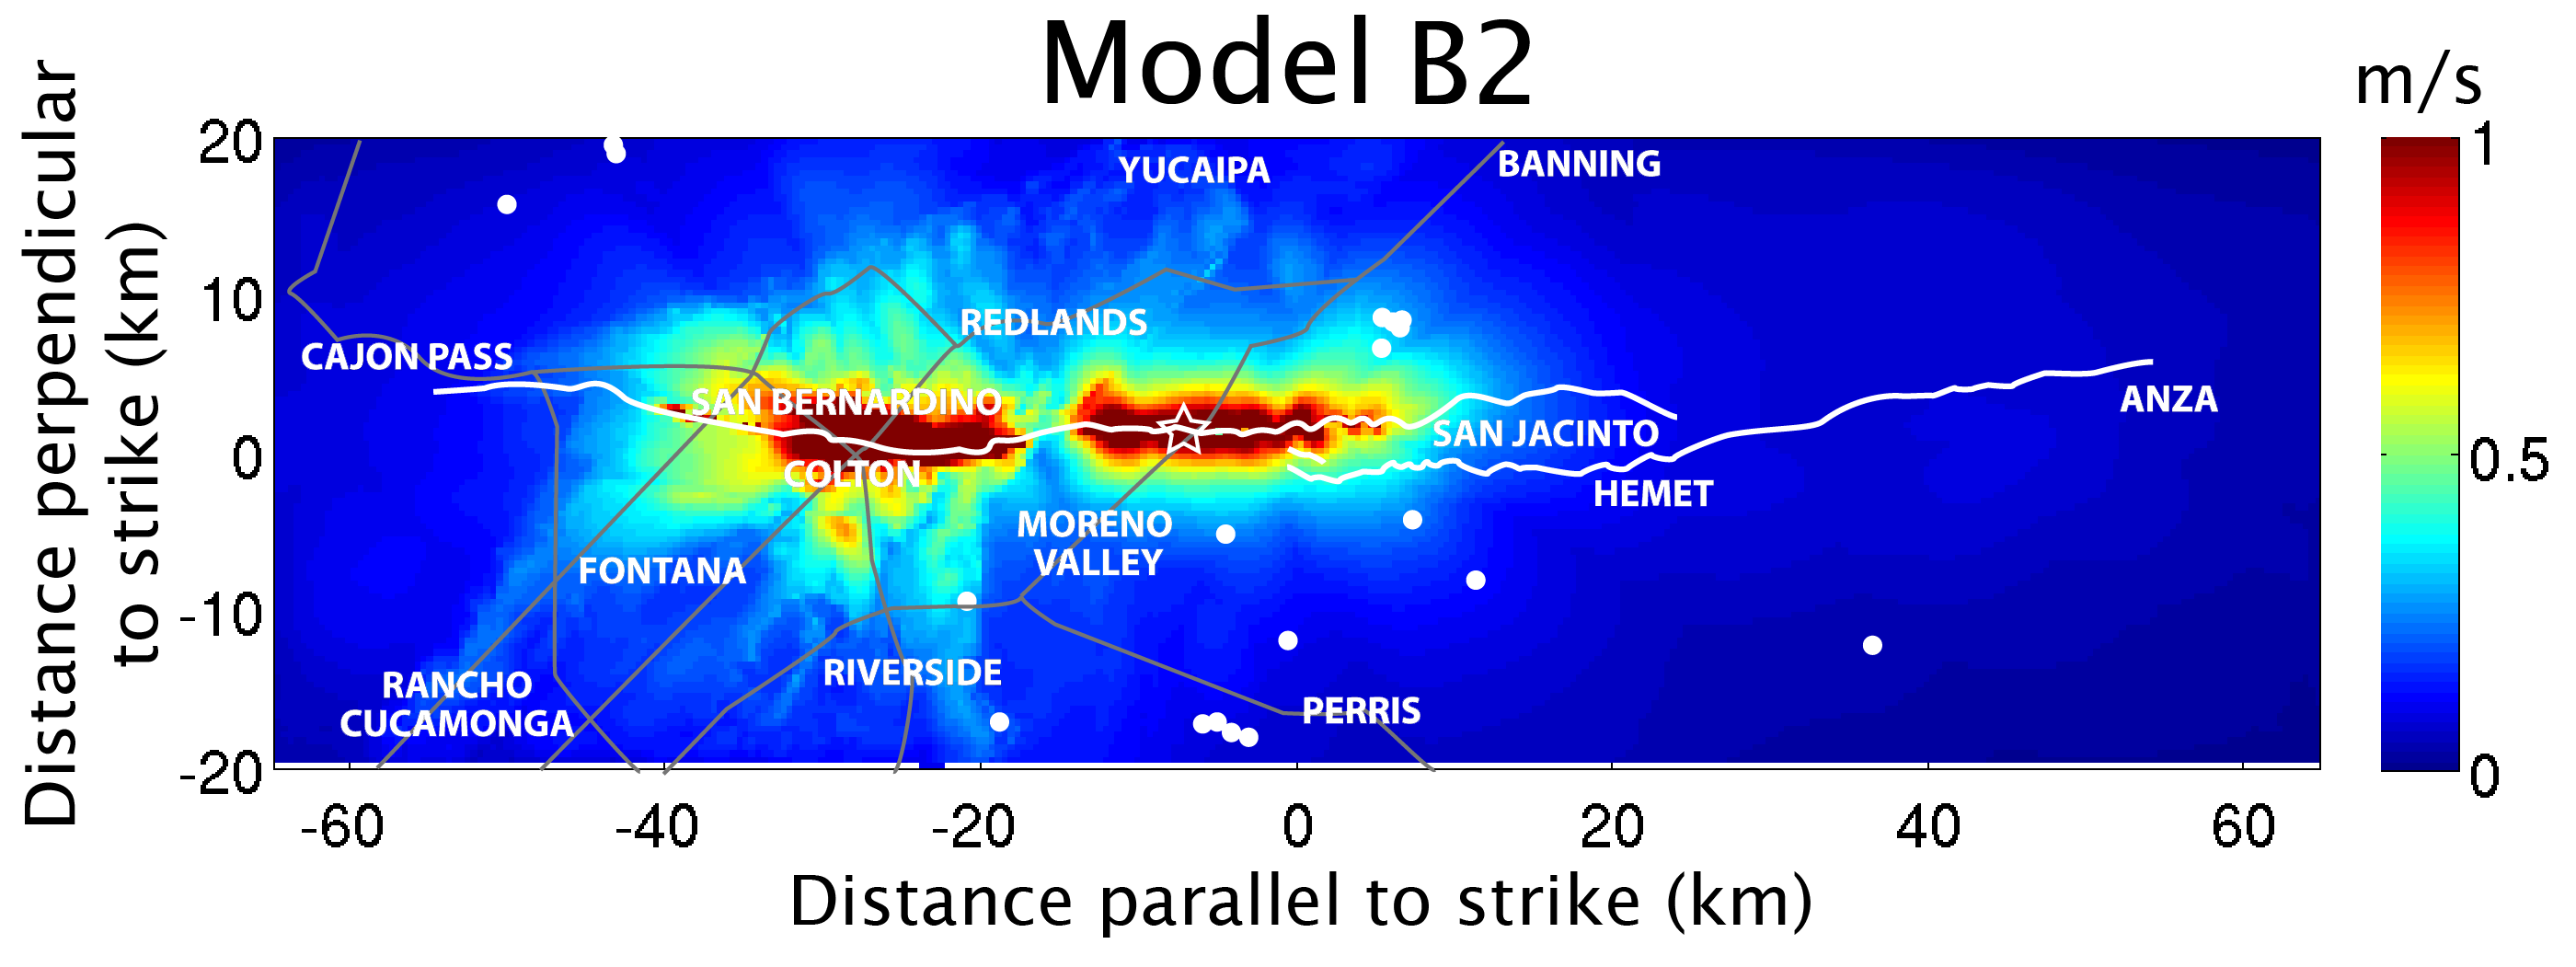
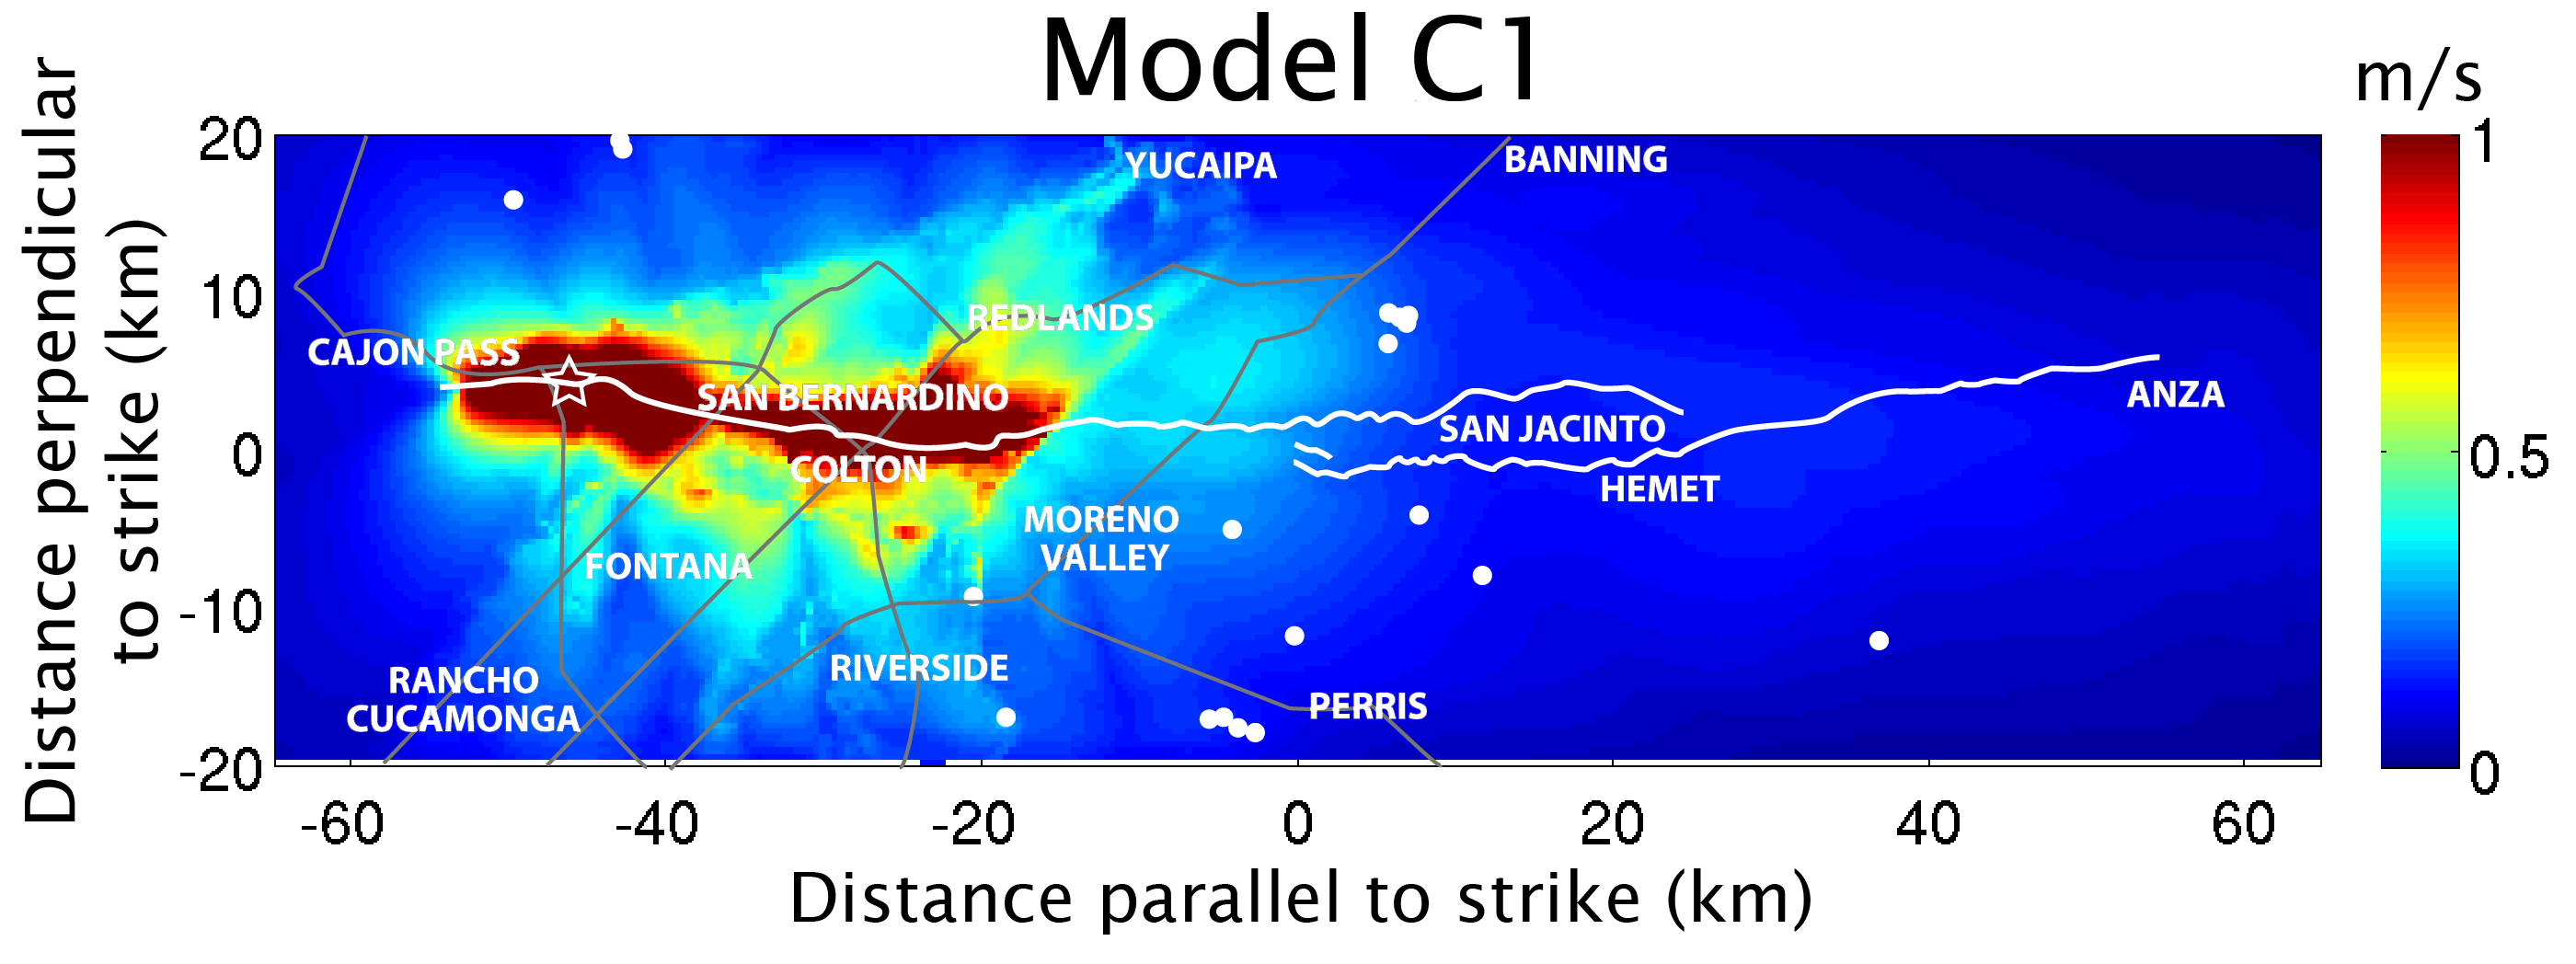
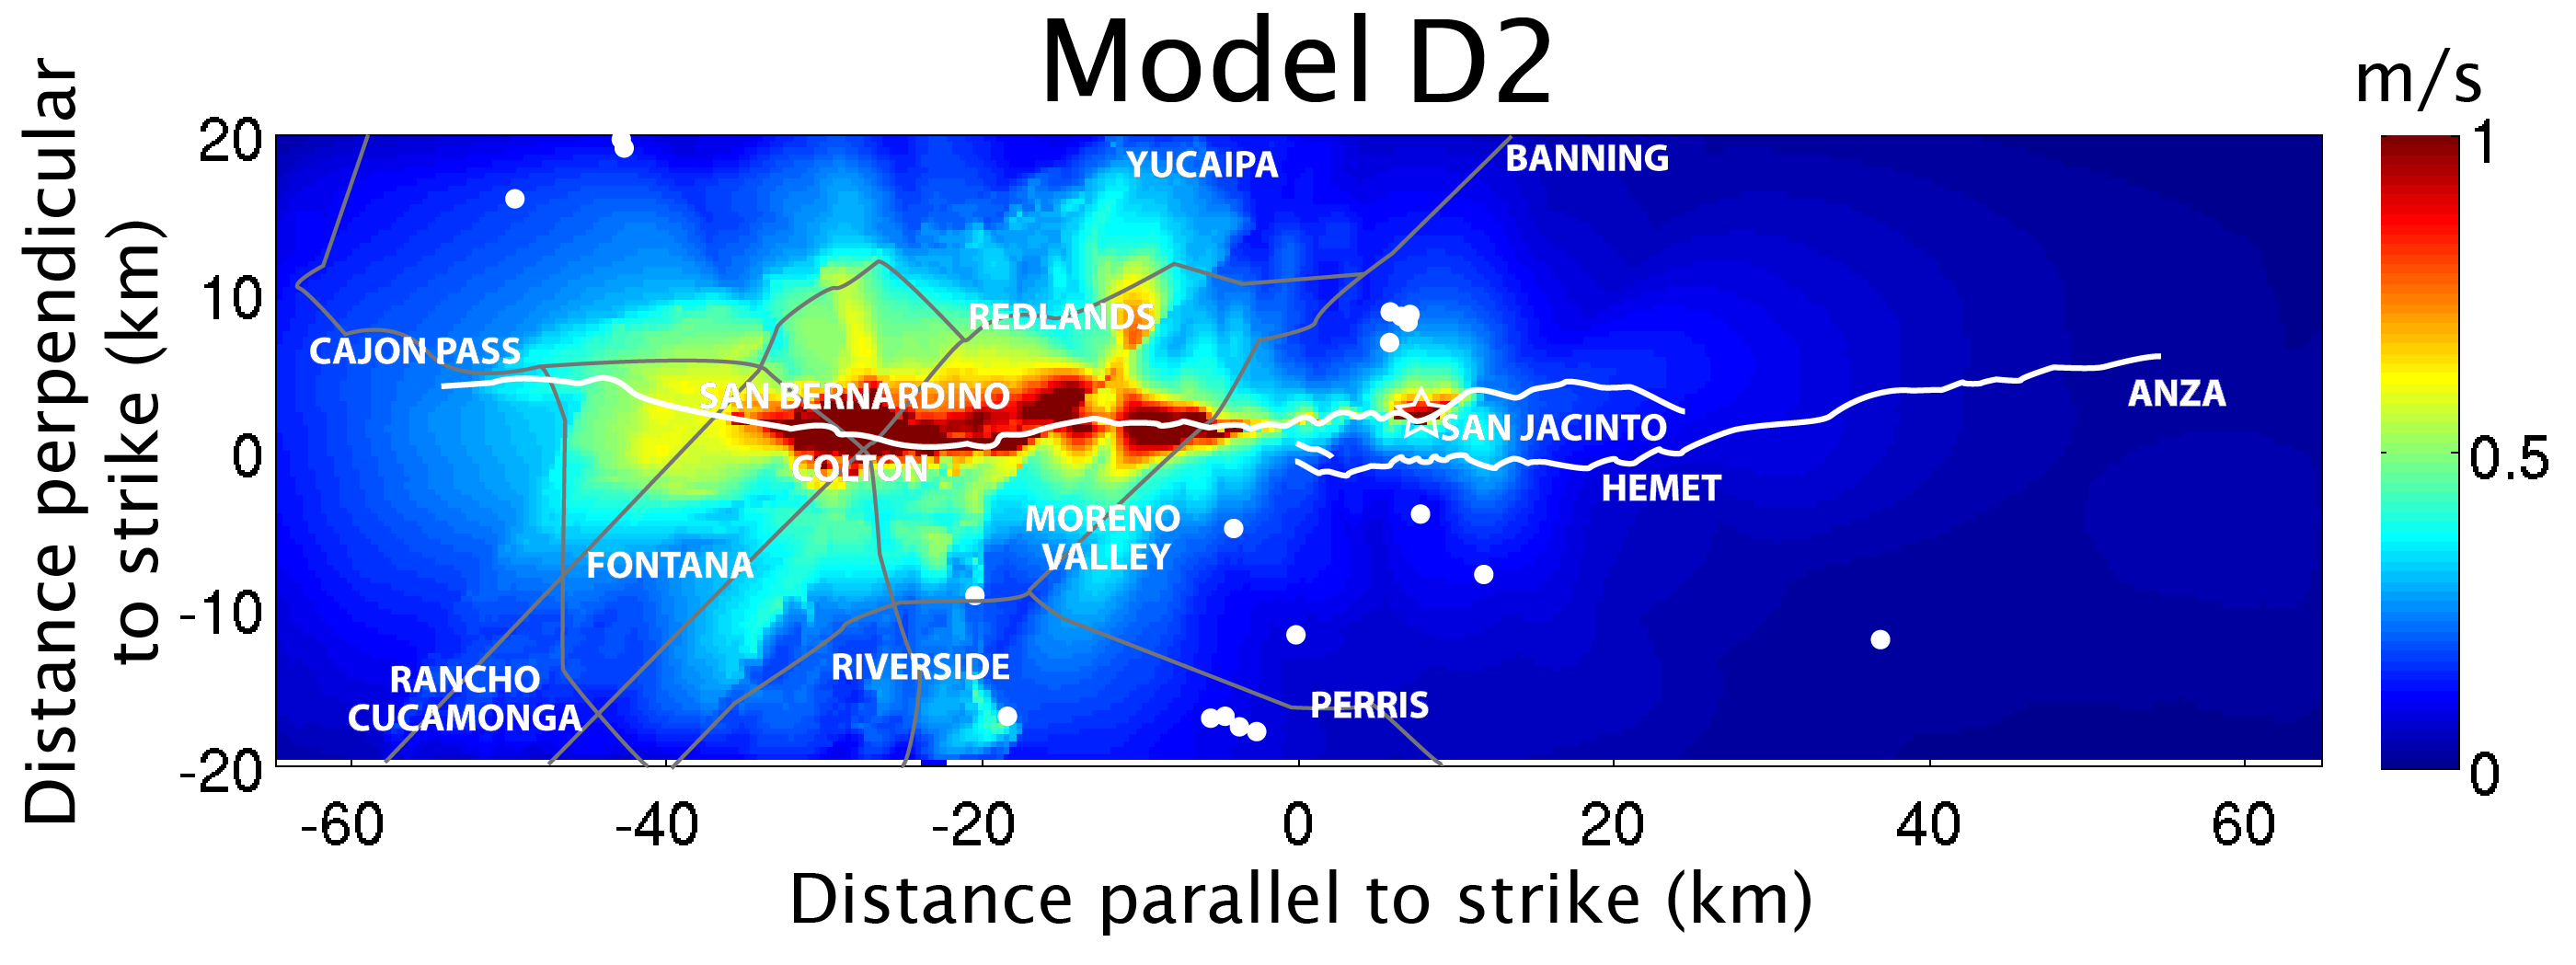
Figure S2a, b, c, and d. Plots of low-frequency ground motions for the four dynamic rupture models (models A1, B2, C1, and D2) that were used to generate broadband synthetic seismograms. The fault trace is shown by white lines, precariously balanced rock (PBR) sites are indicated by white dots, and the epicenter is marked by the open white star. Gray lines show major freeways, and cities are labeled in black text.
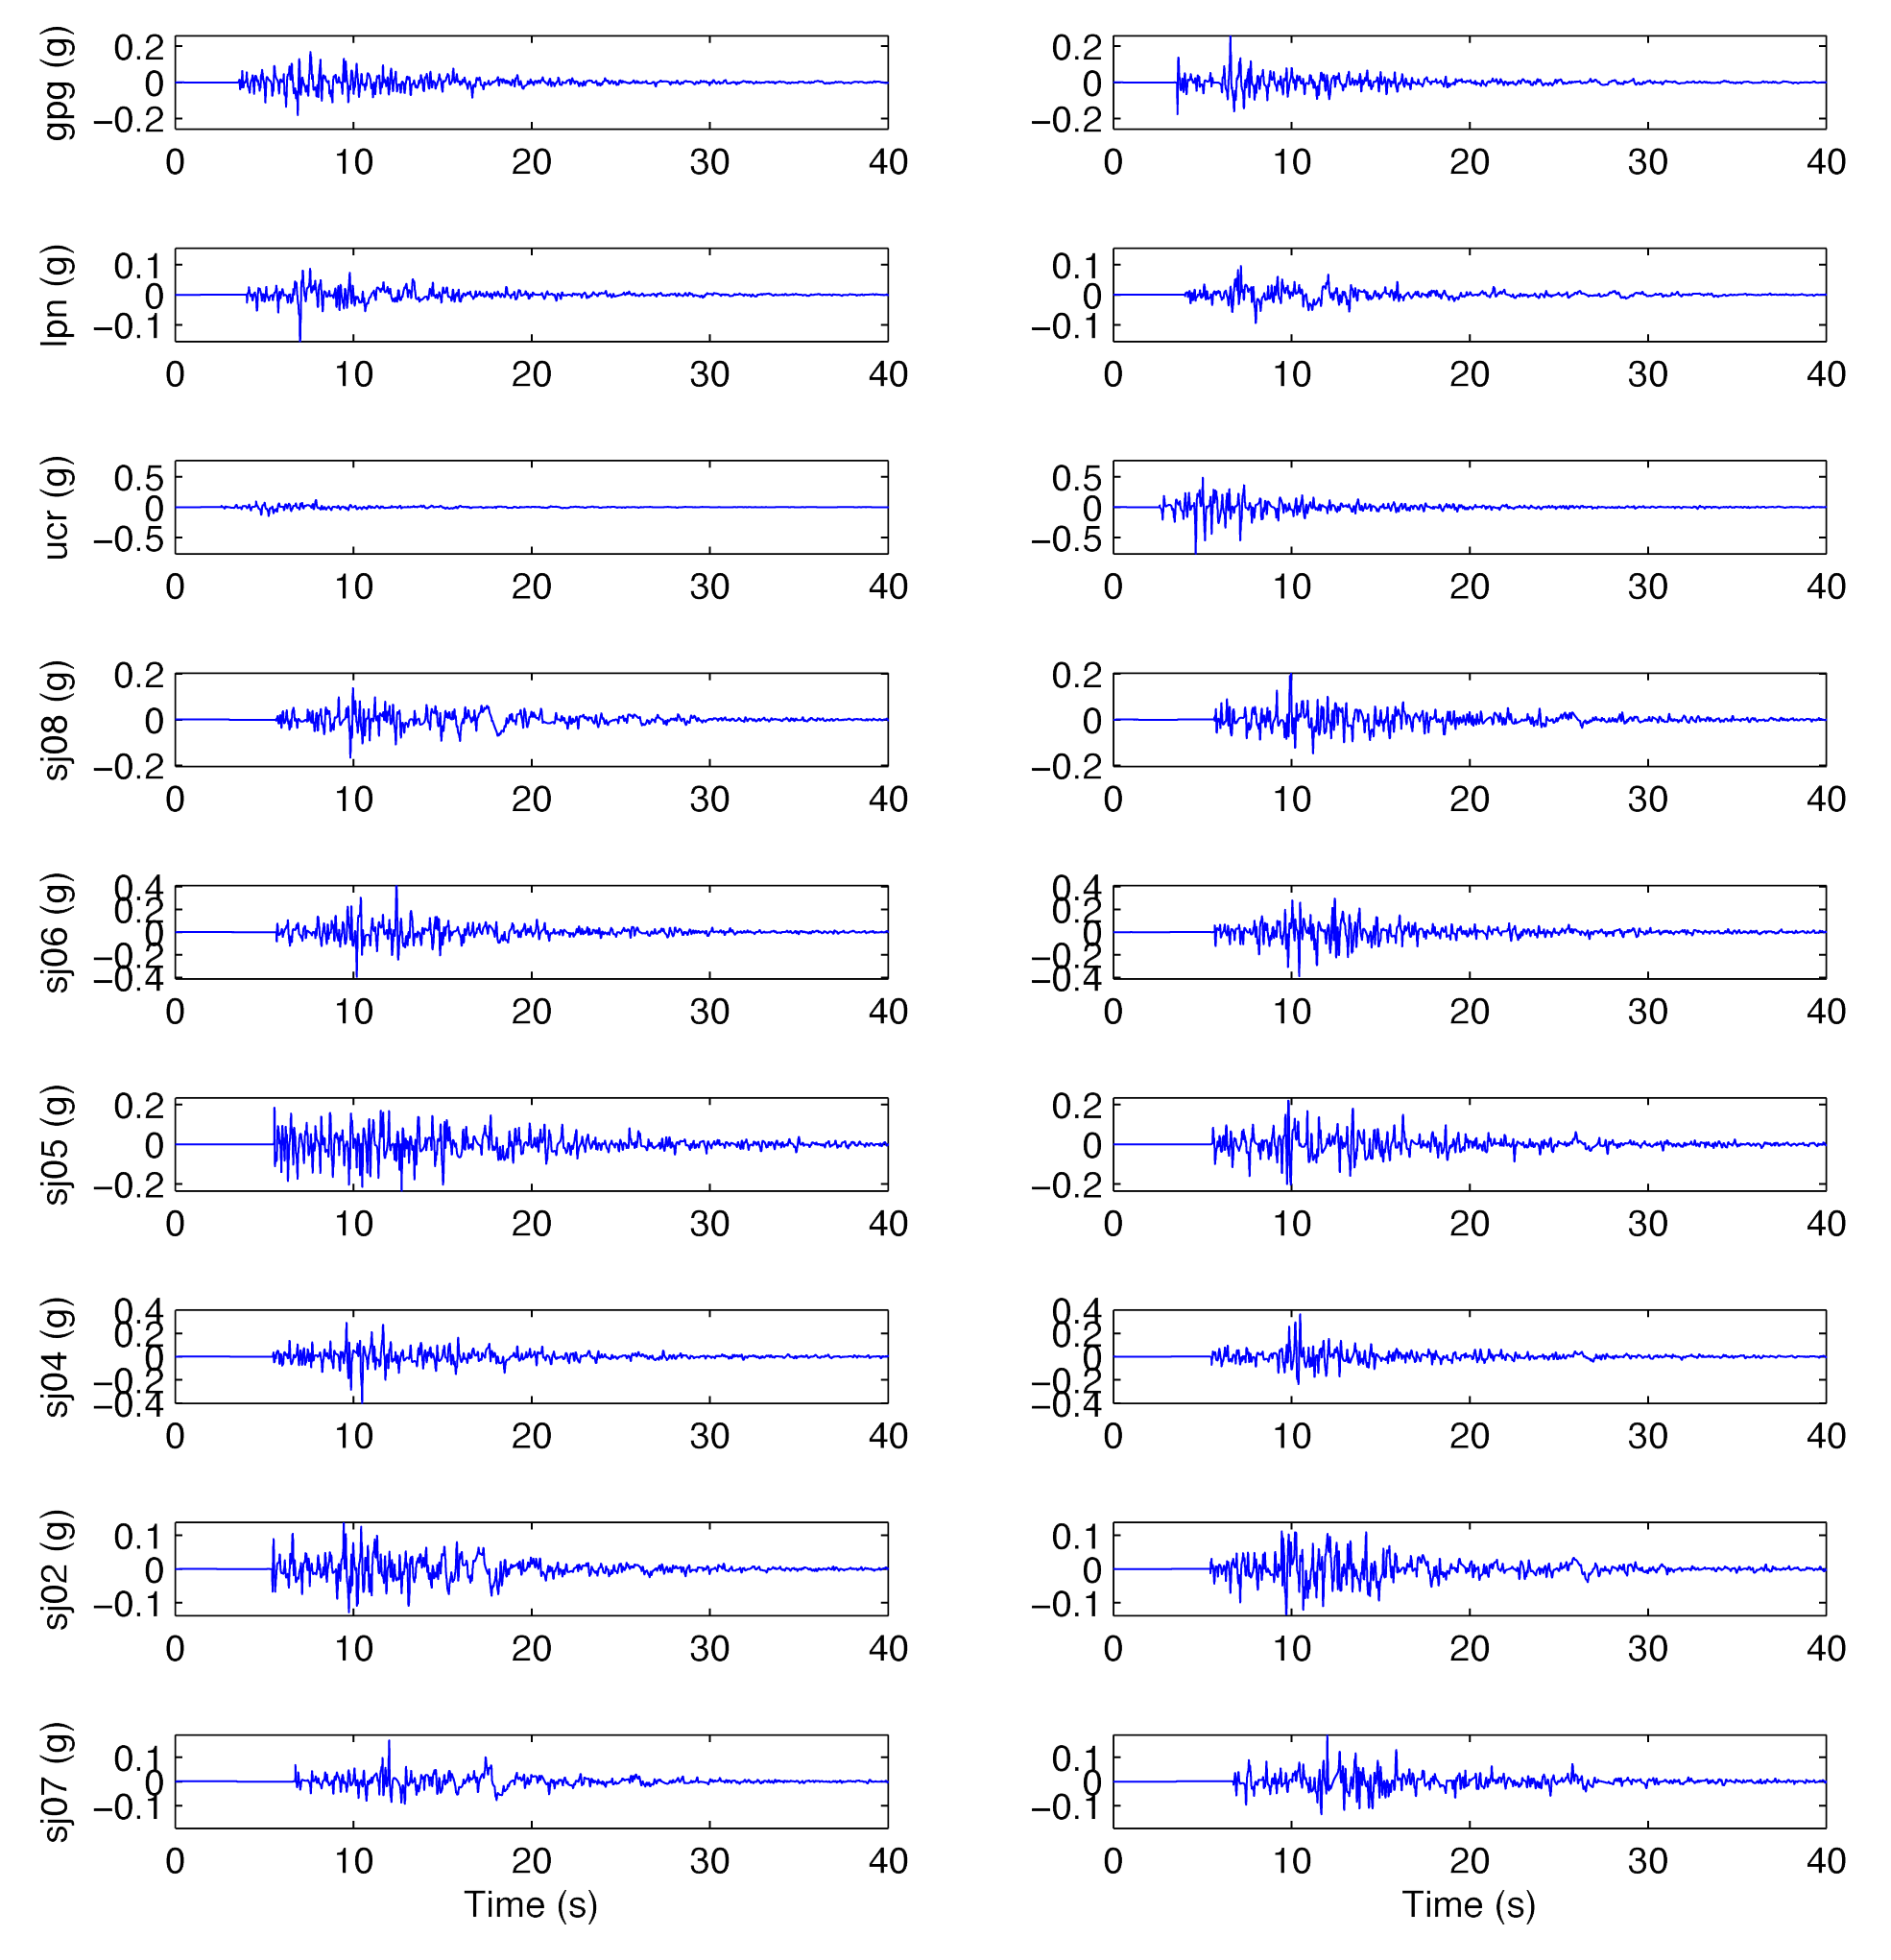
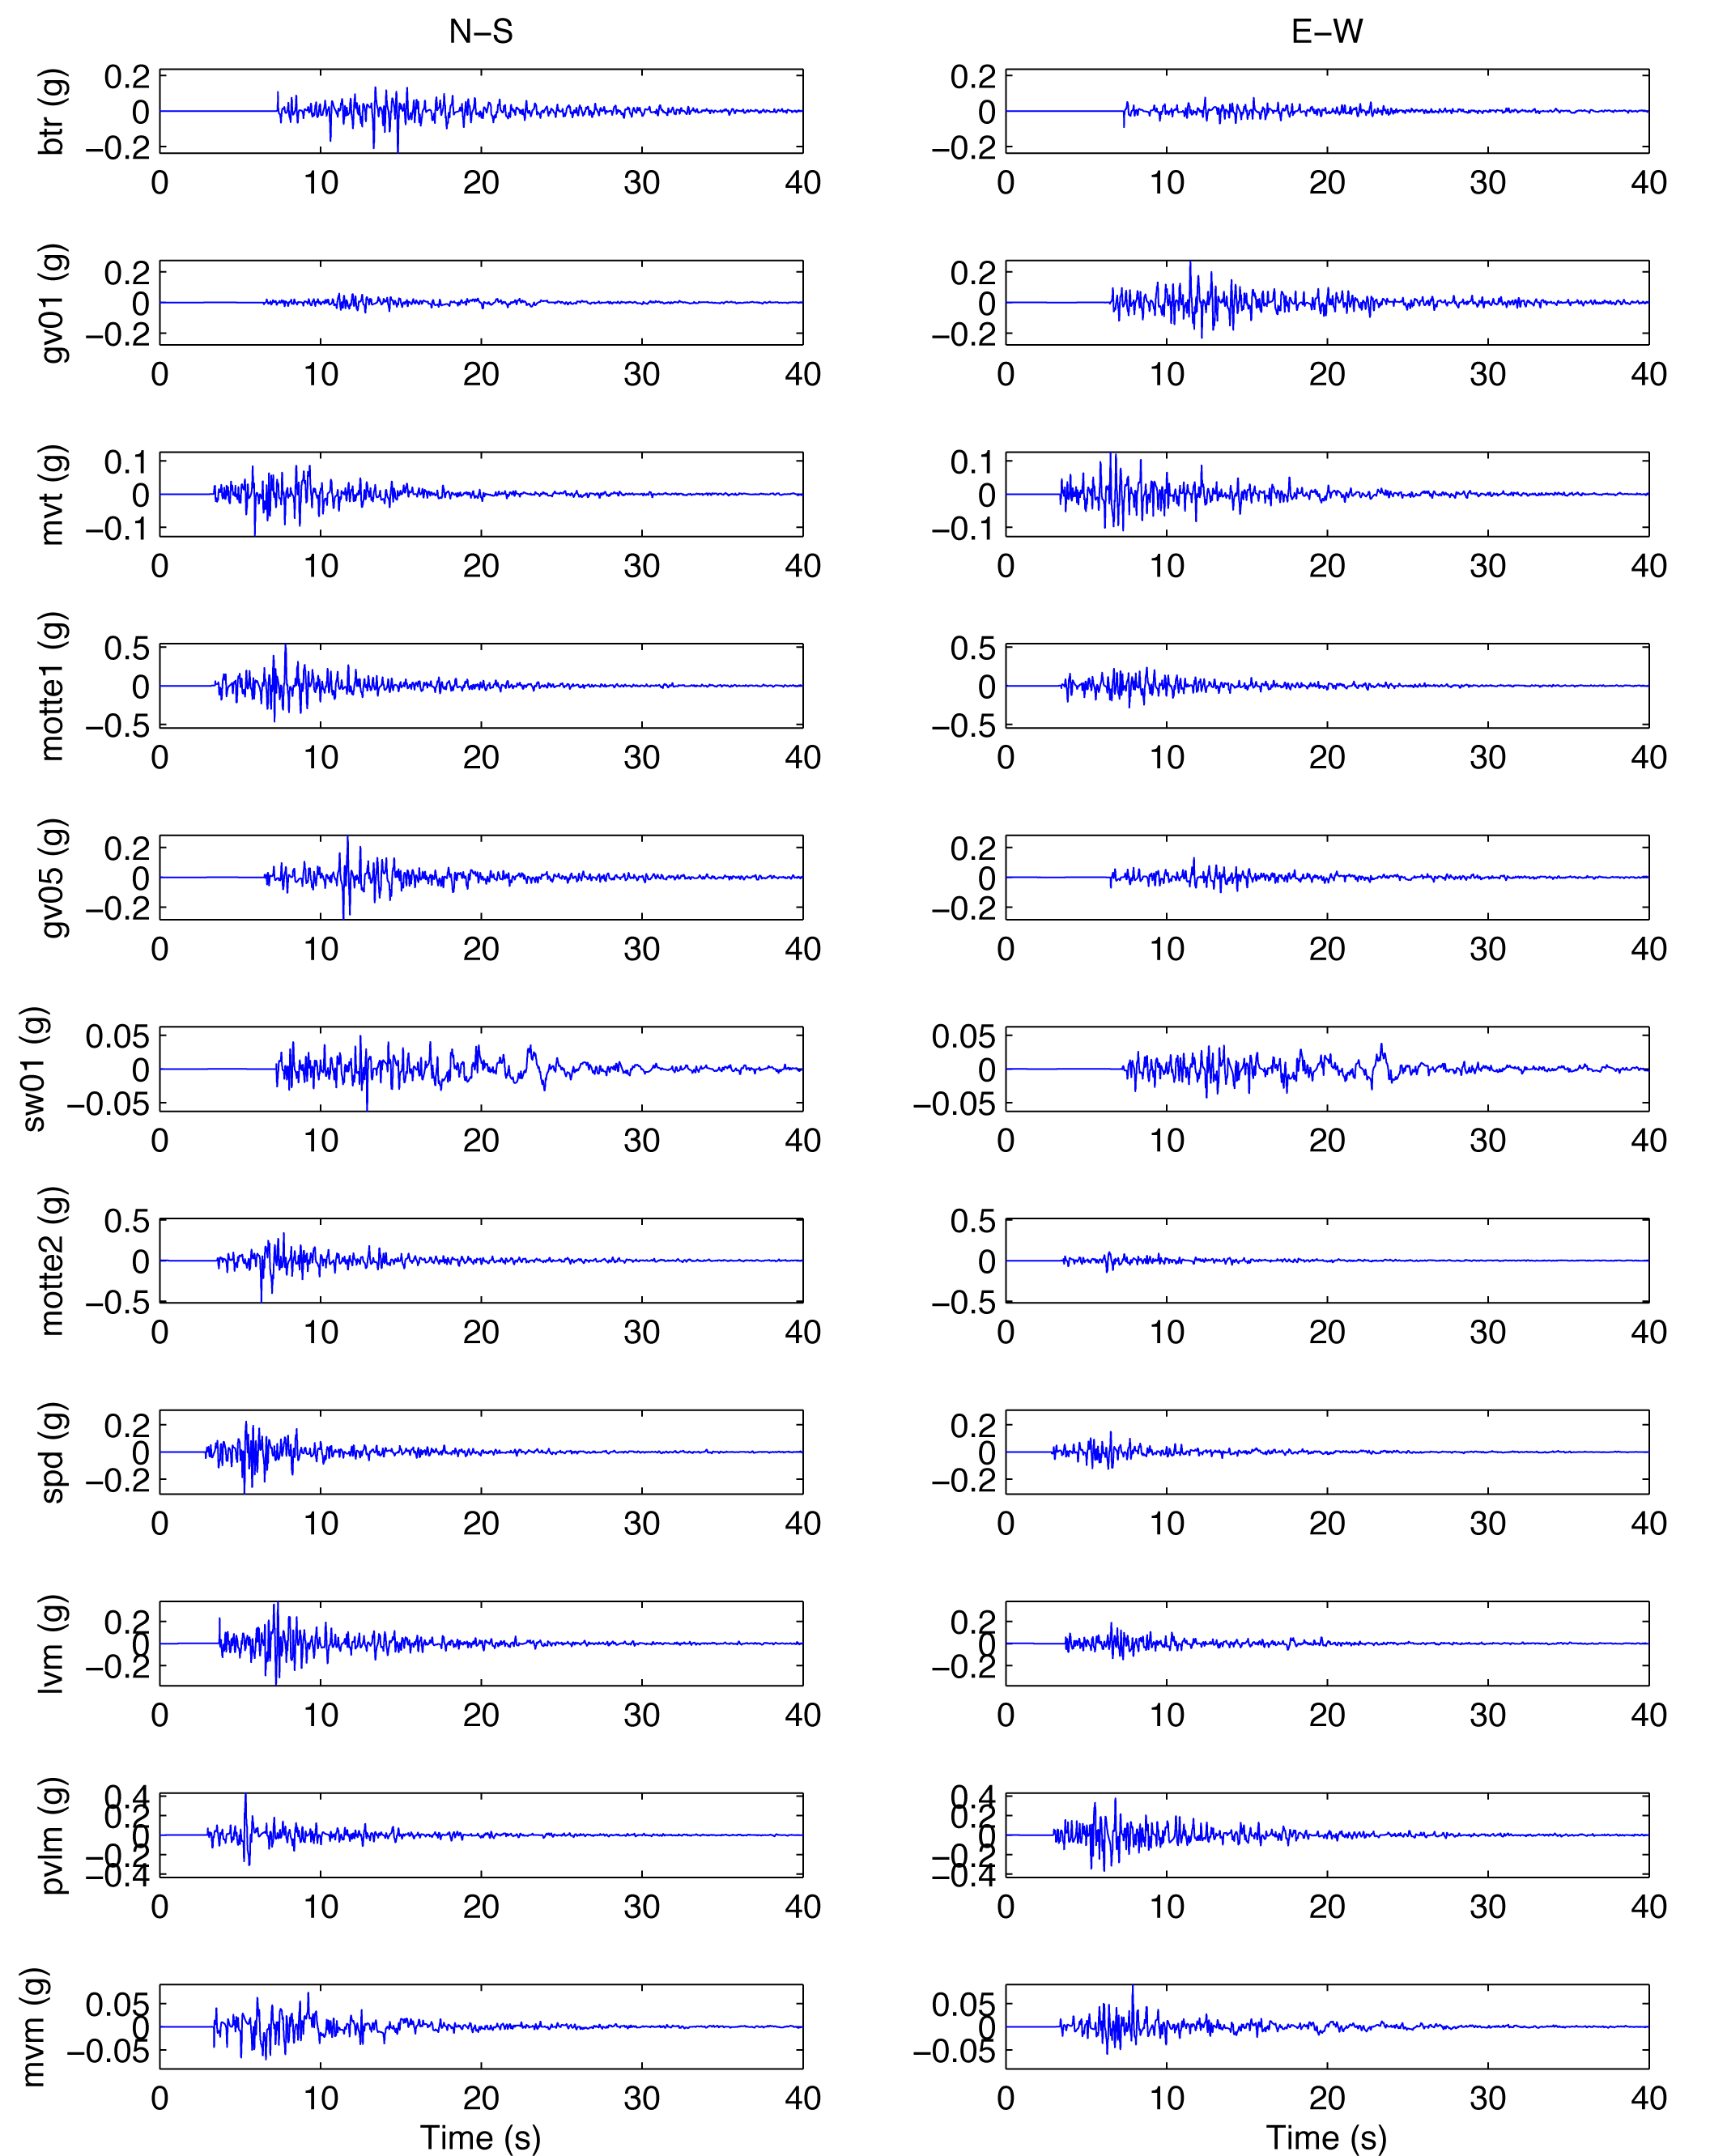
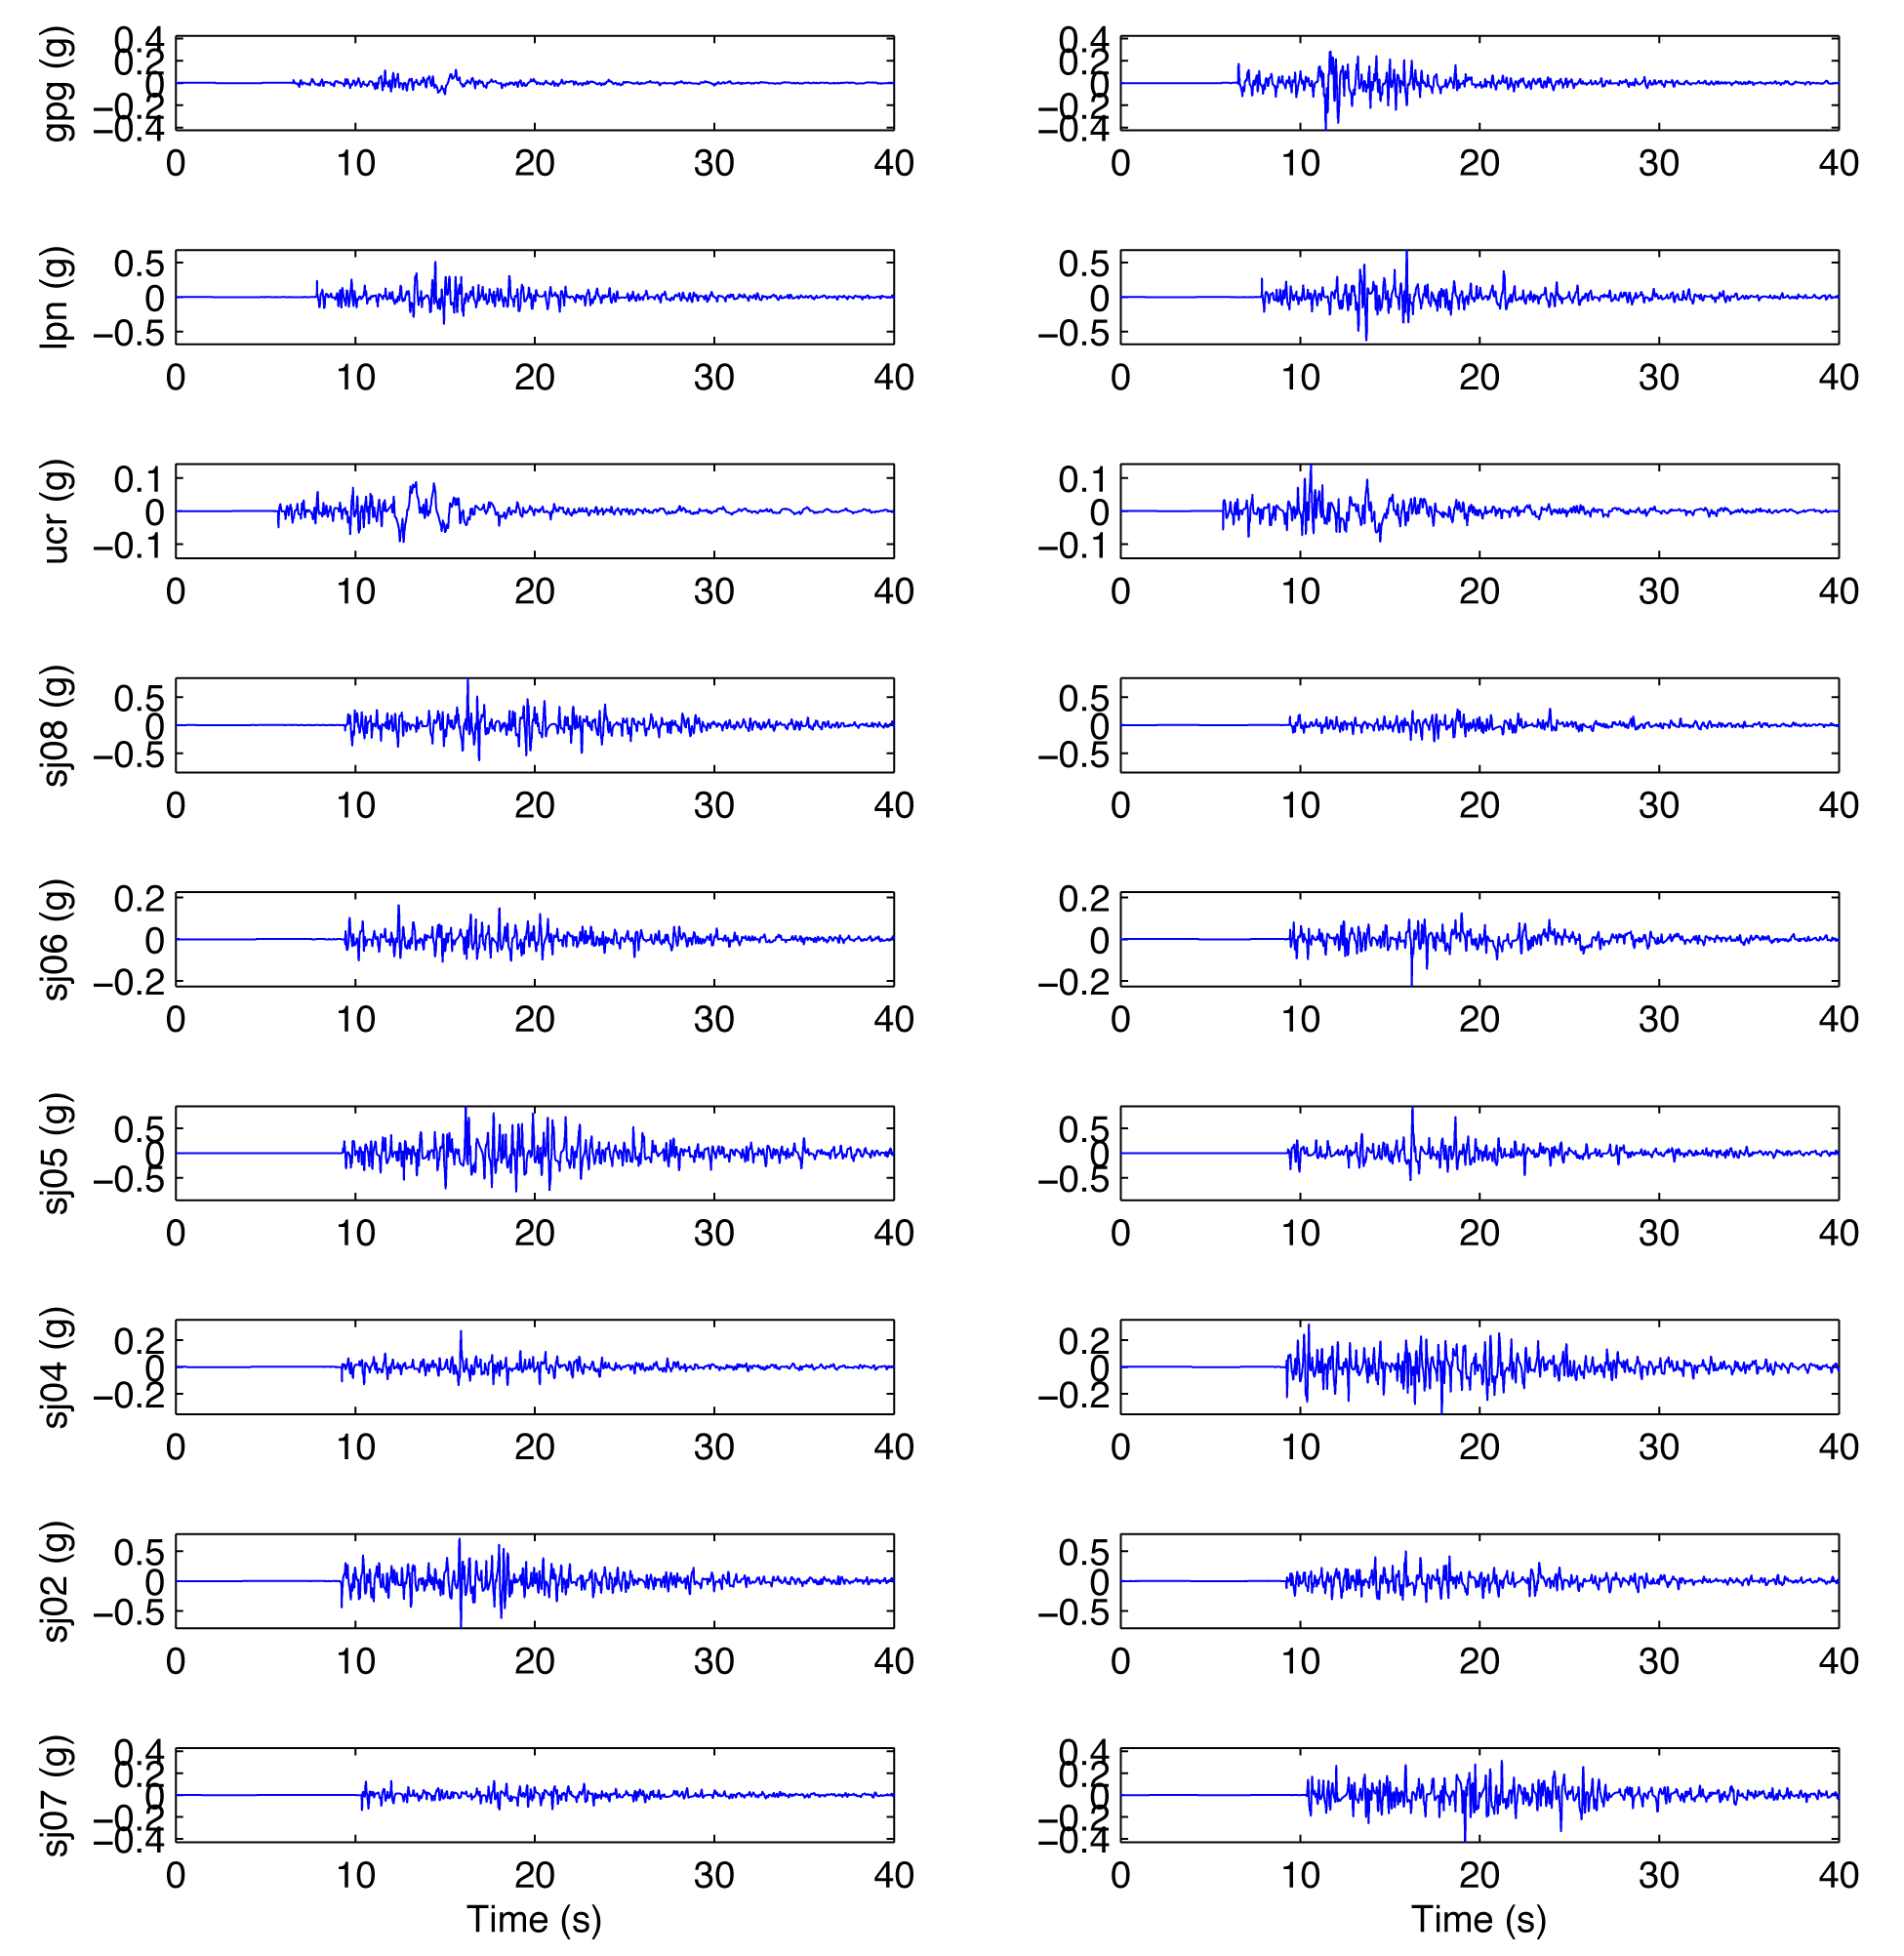
Figure S3a and b. Broadband synthetic accelerograms at all PBR sites for rupture scenario A1 (N-S, north–south; E-W, east–west).
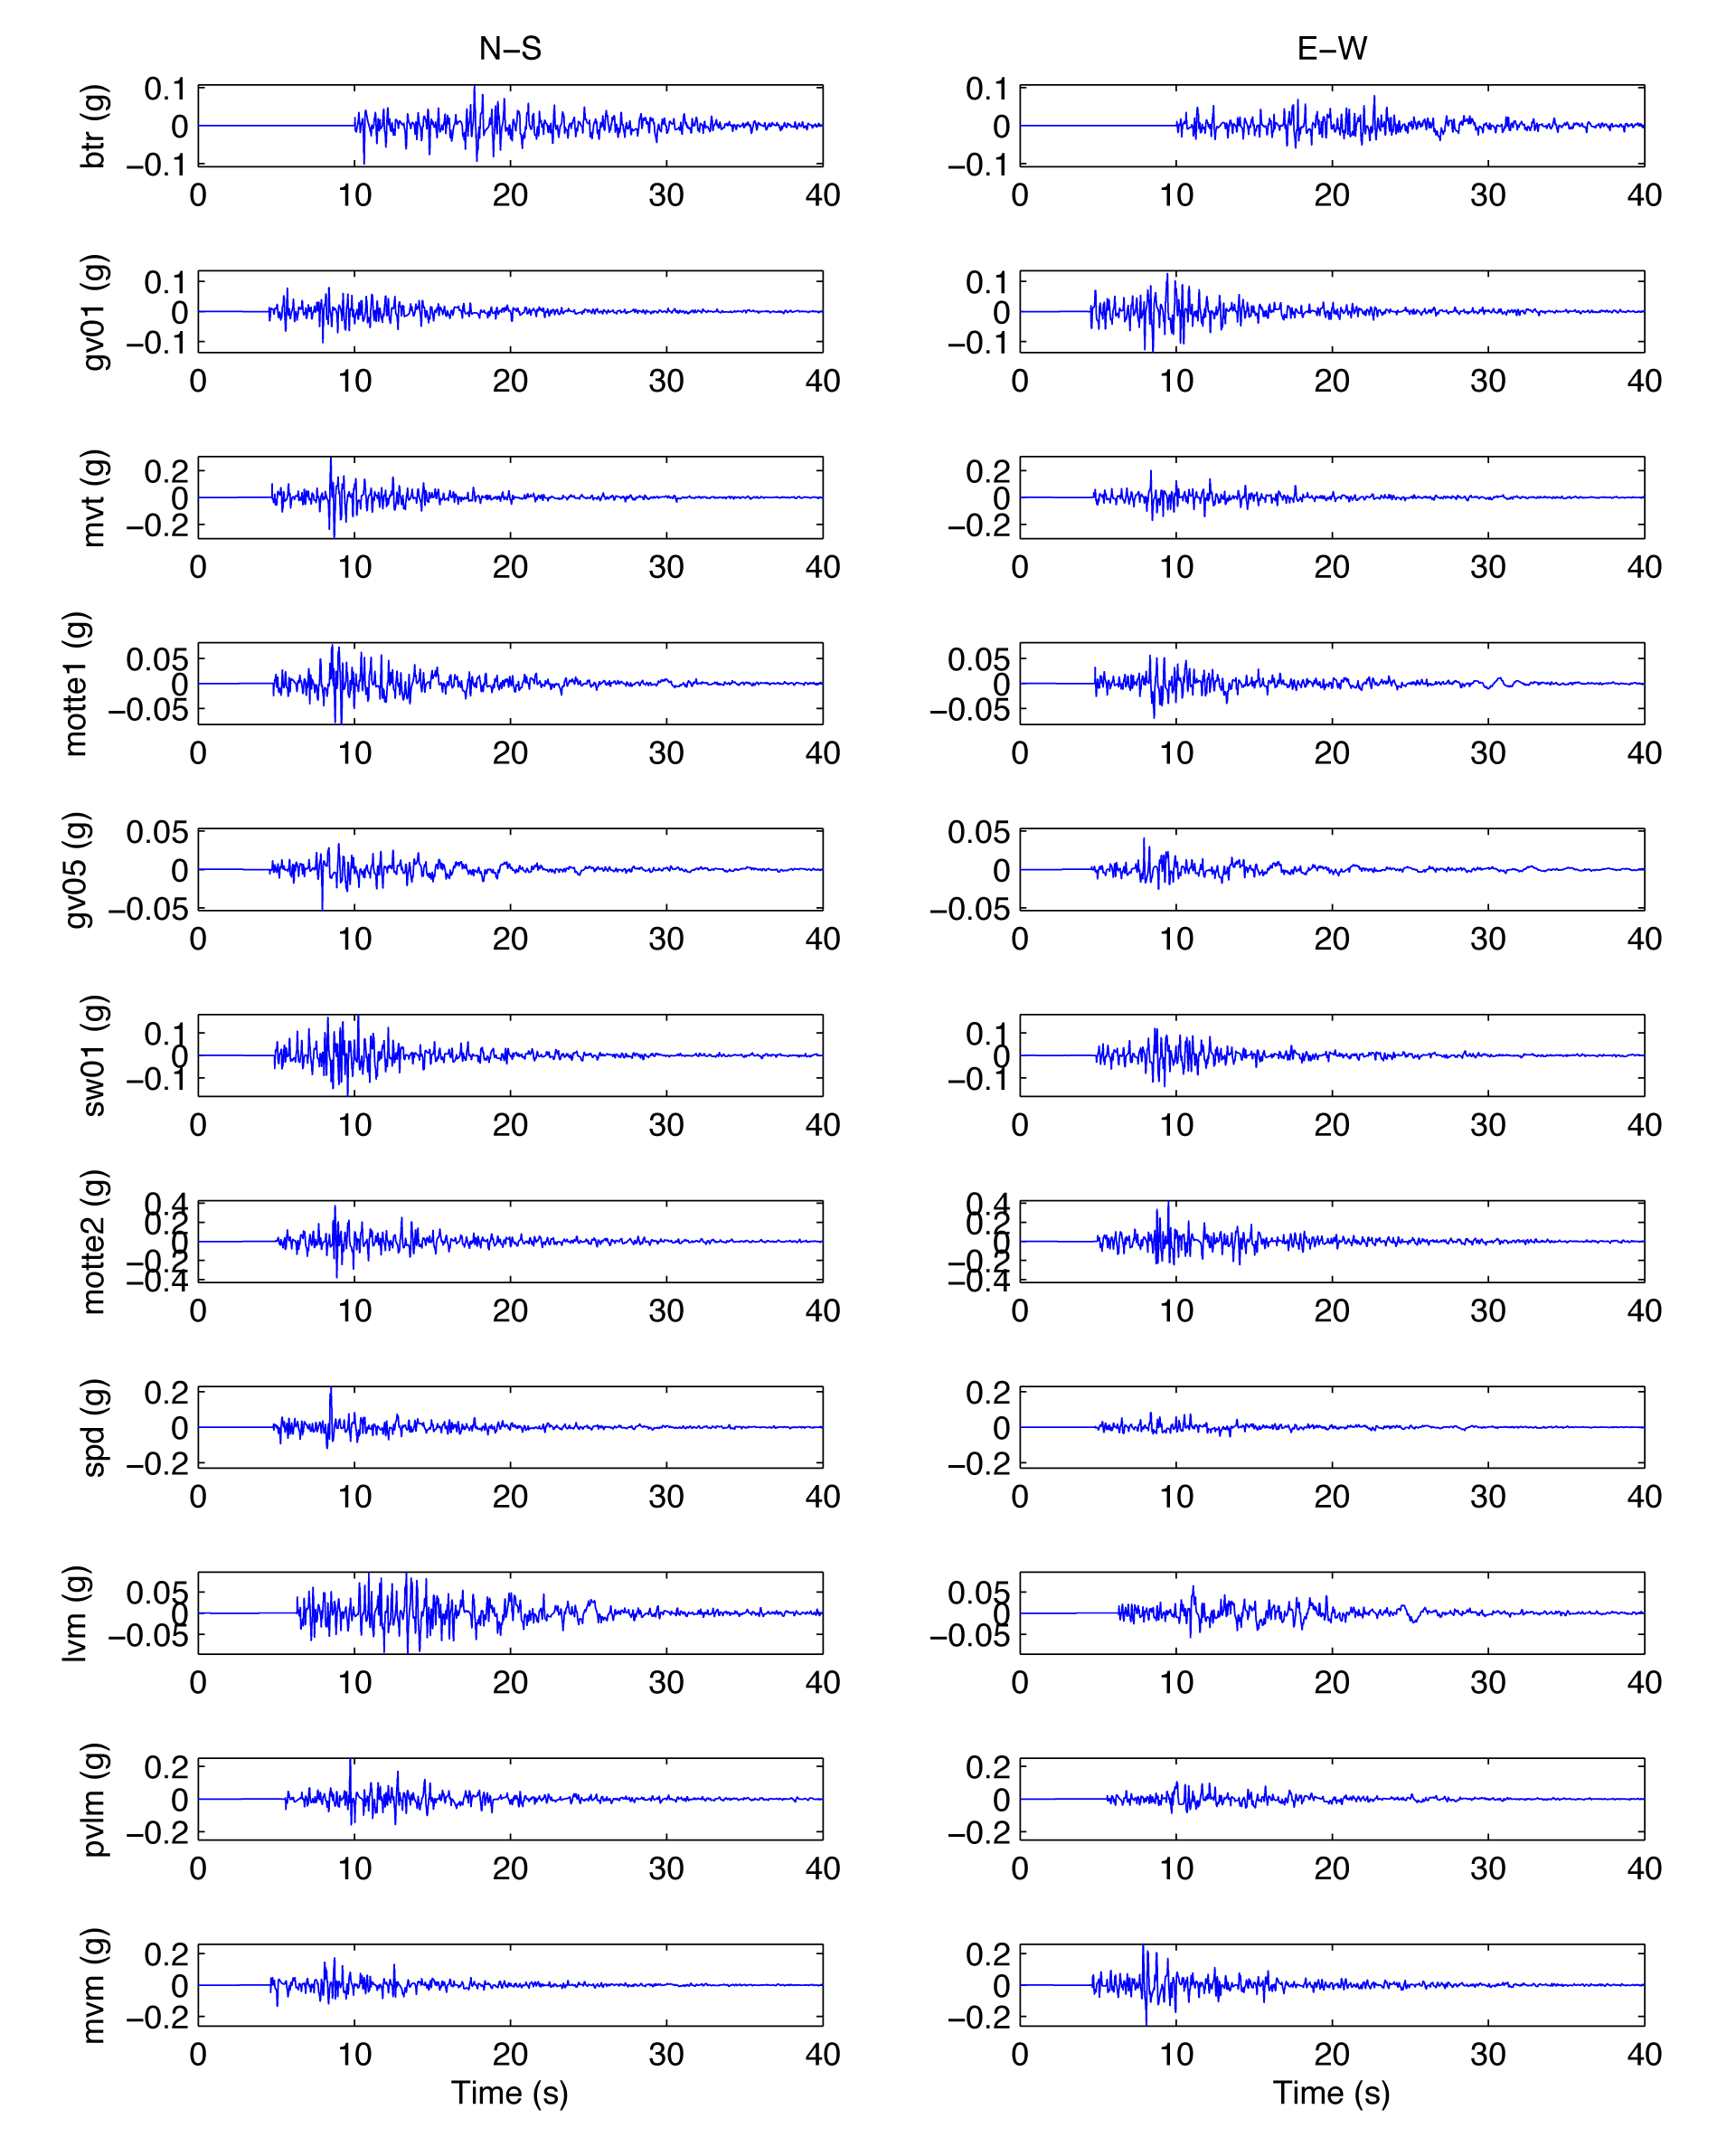
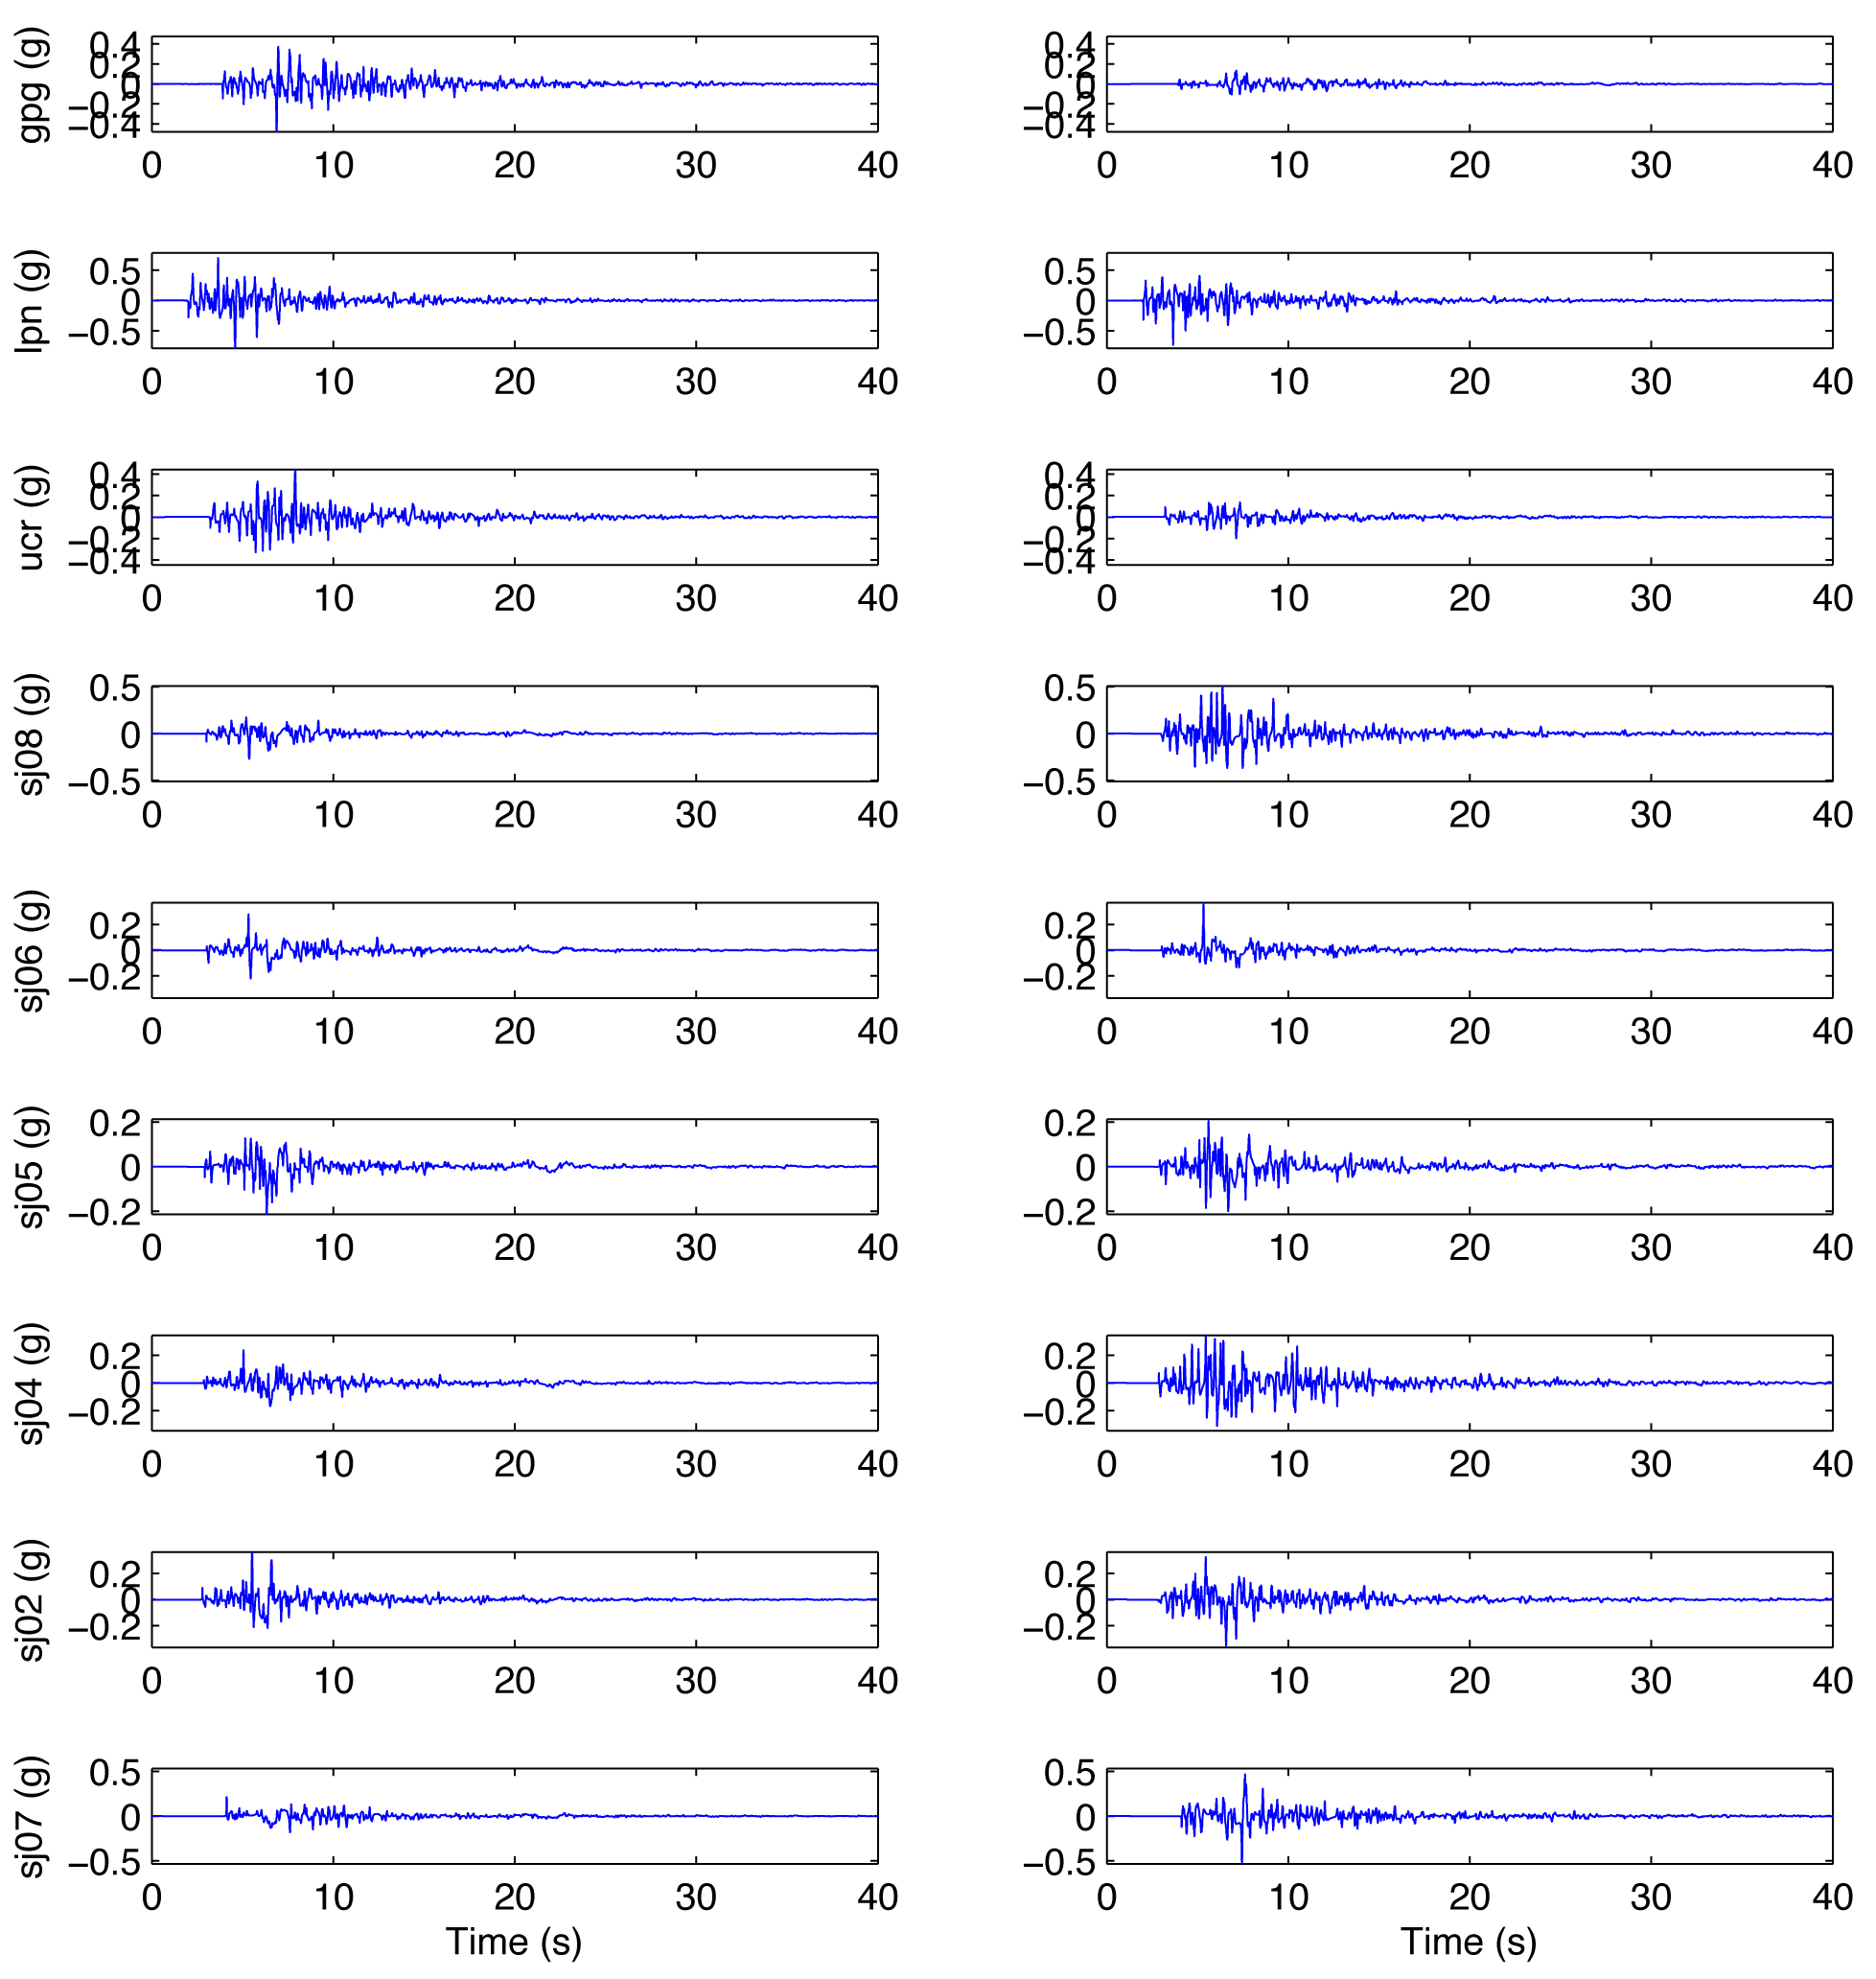
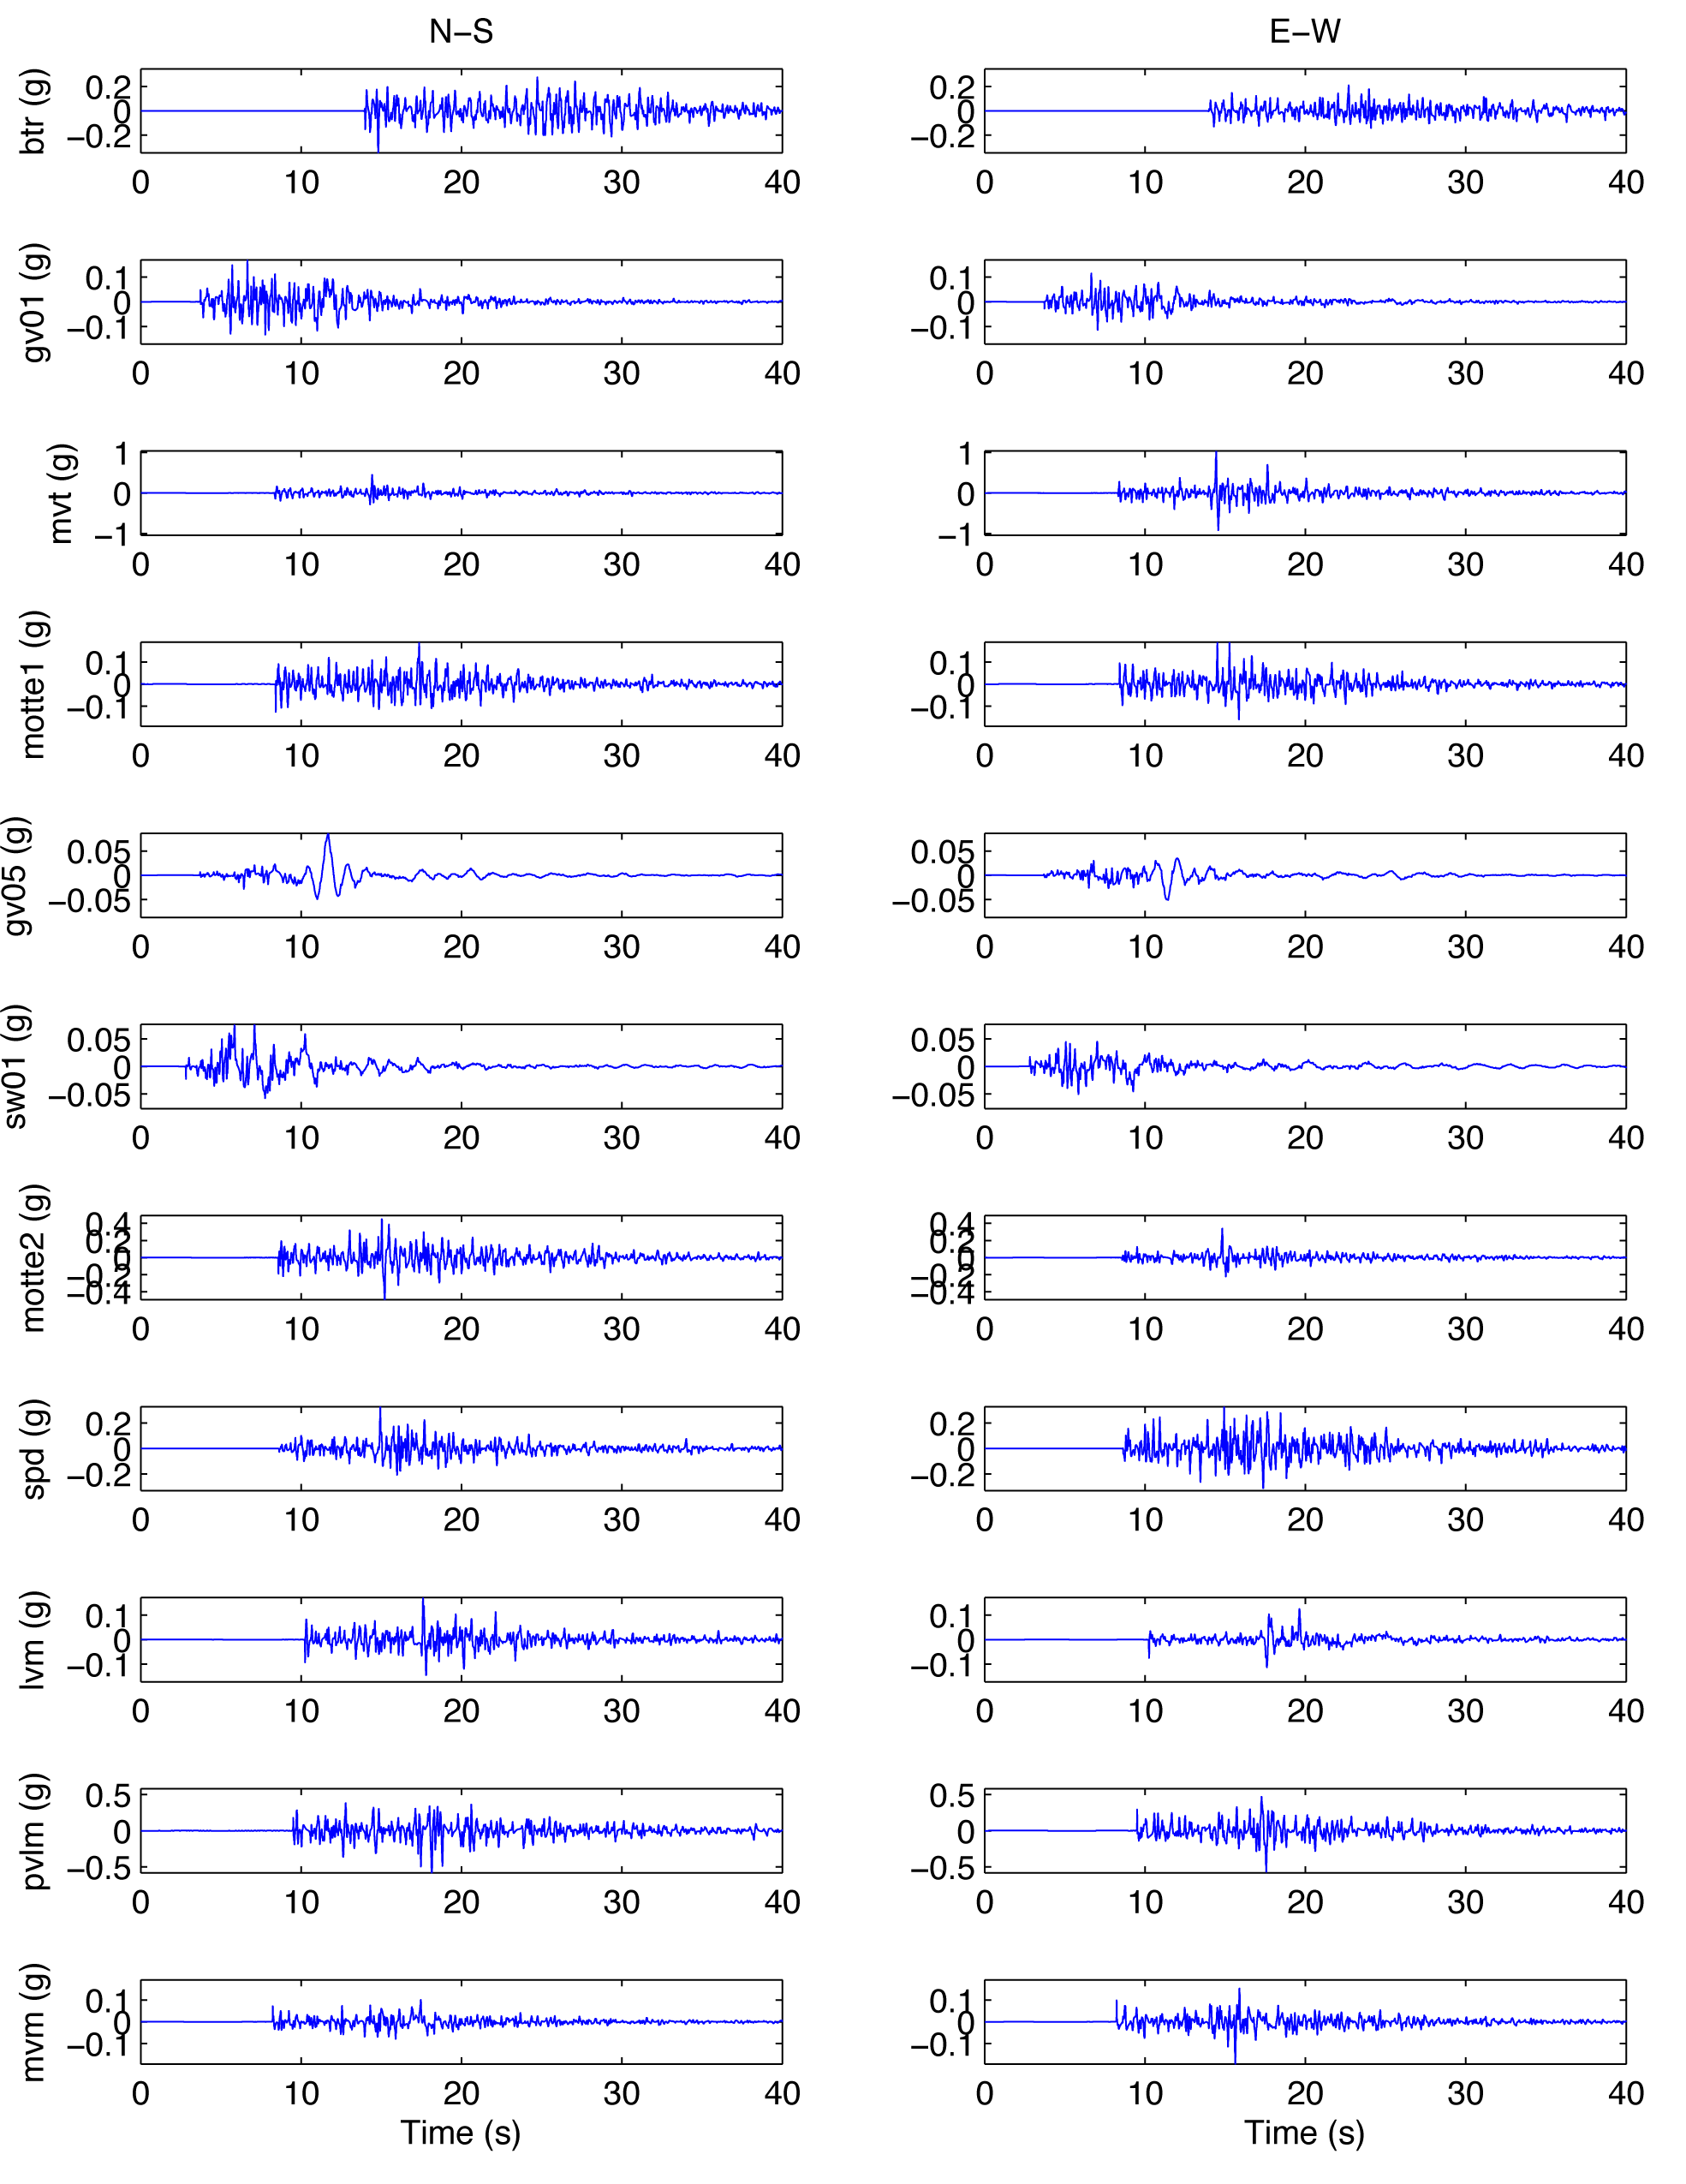
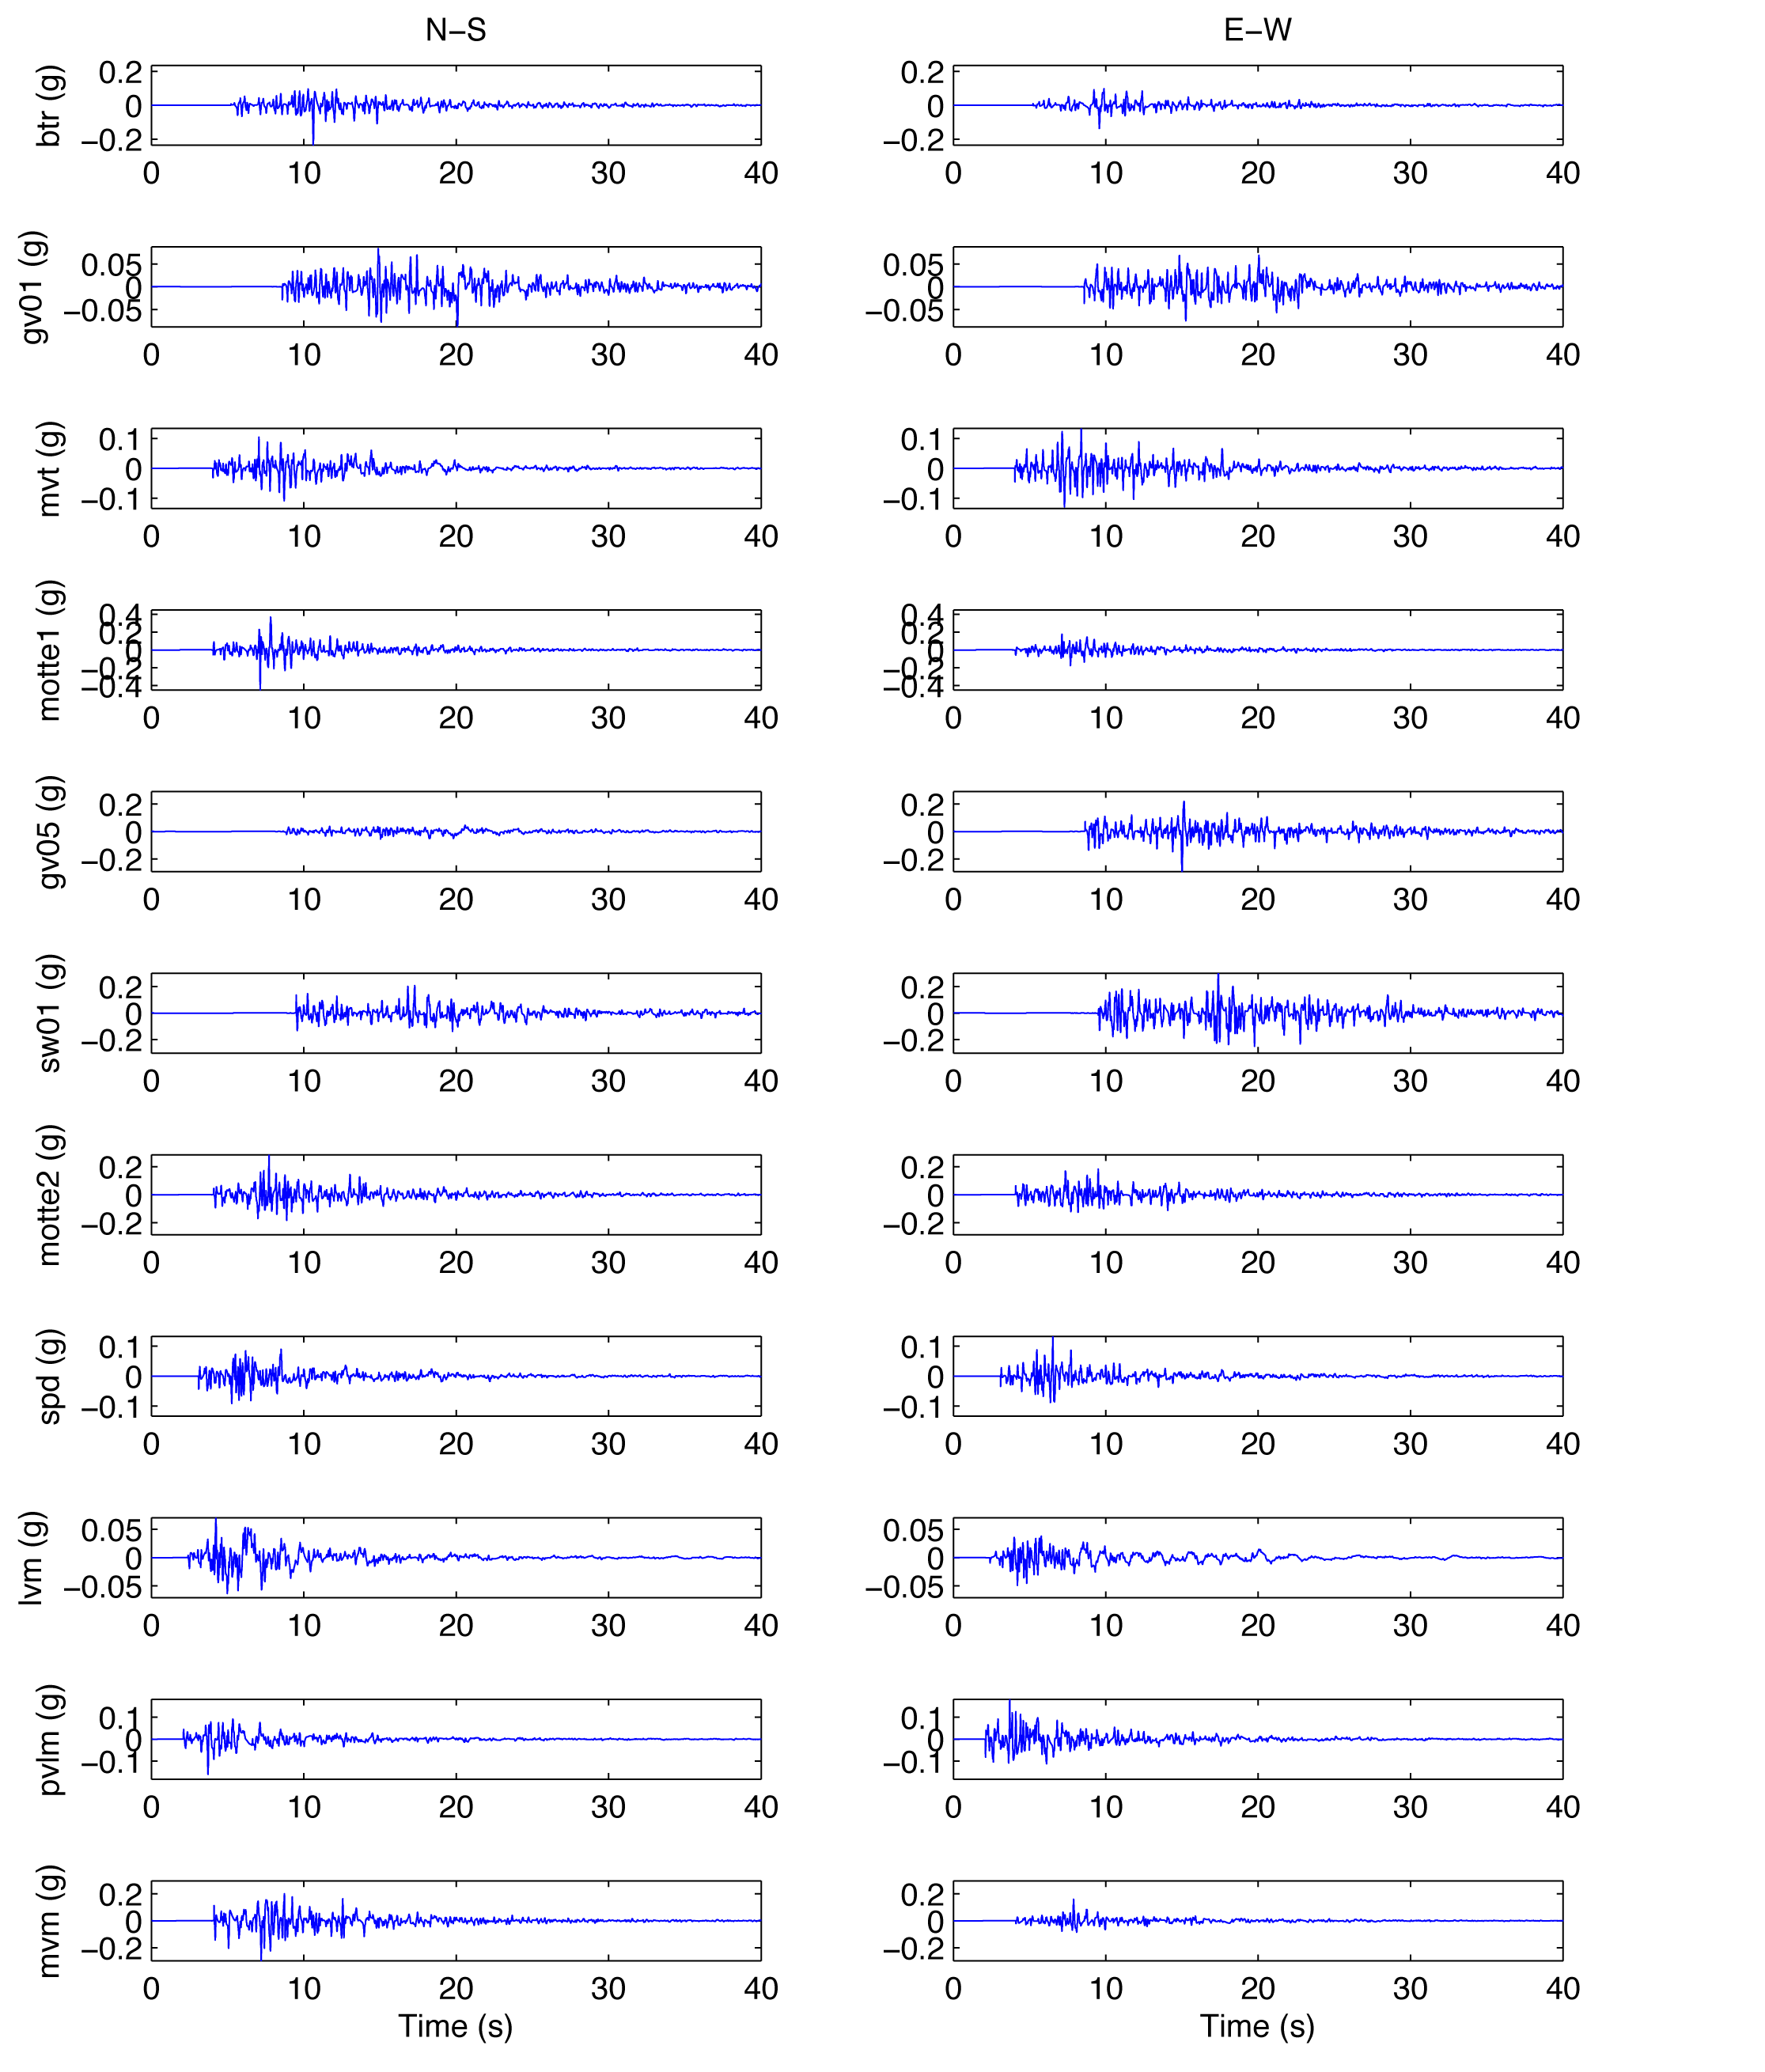
Figure S4a and b. Broadband synthetic accelerograms at all PBR sites for rupture scenario B2 (N-S, north–south; E-W, east–west).
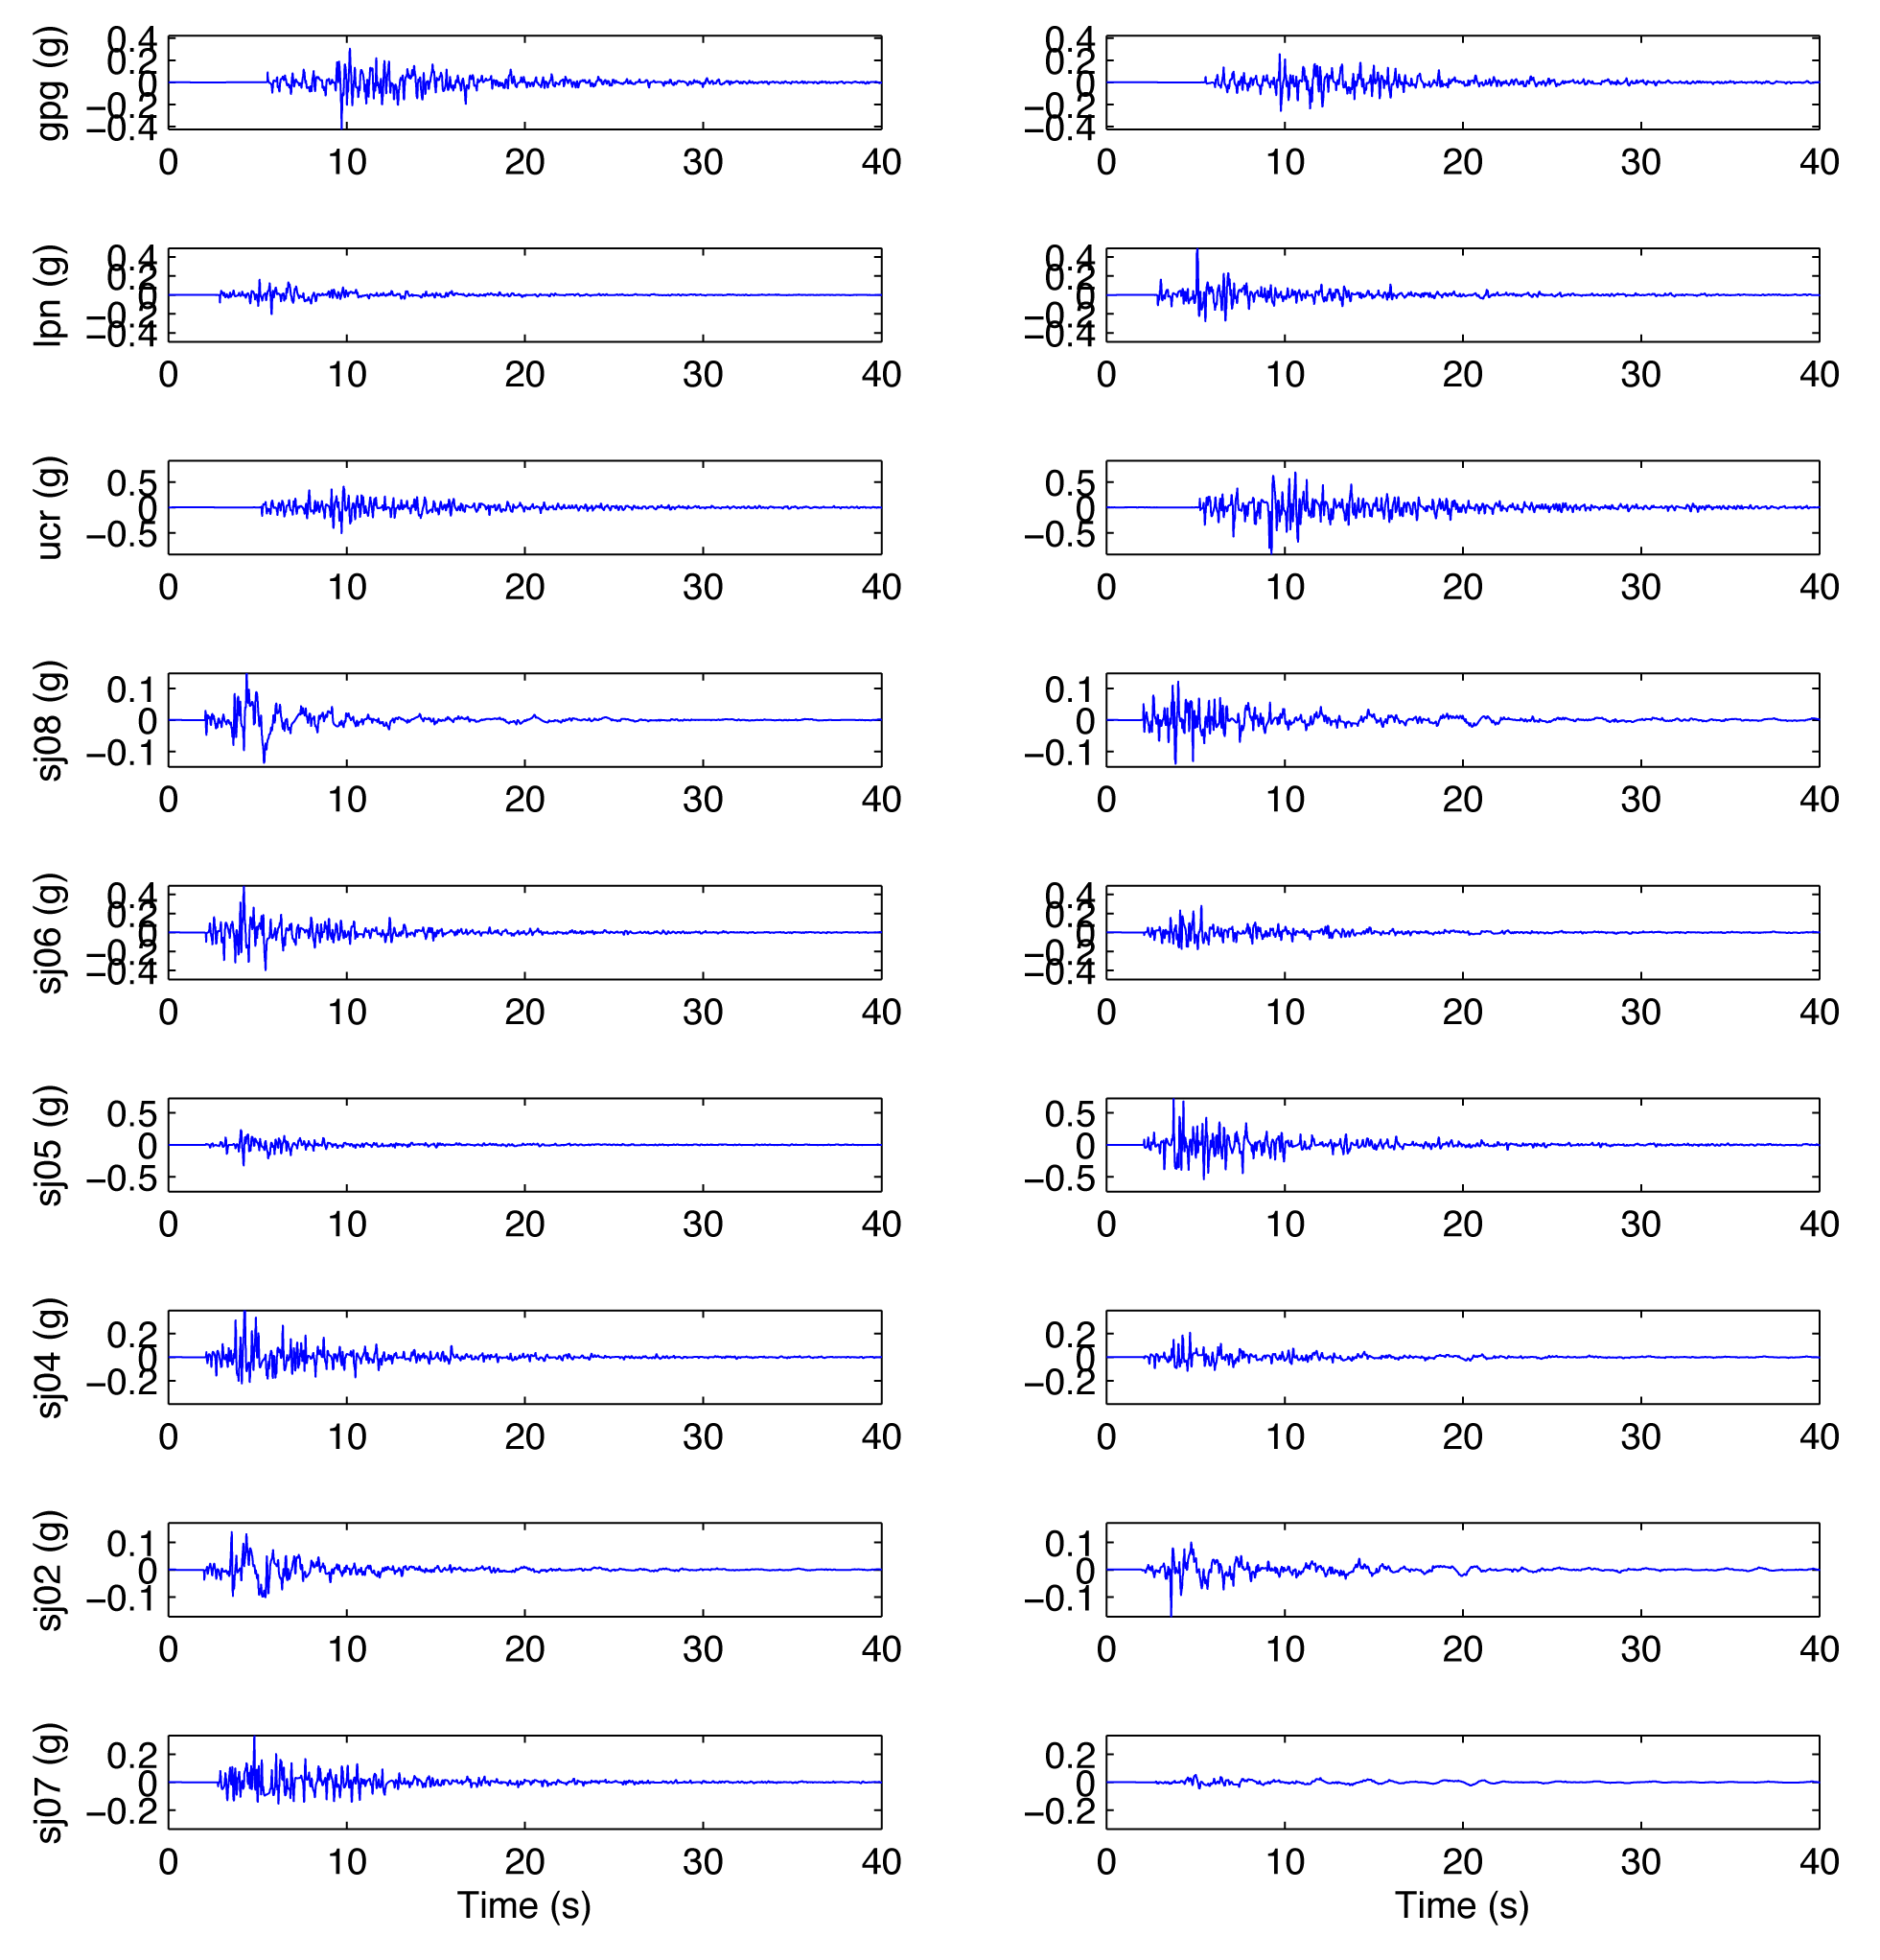
Figure S5a and b. Broadband synthetic accelerograms at all PBR sites for rupture scenario C1 (N-S, north–south; E-W, east–west).
Figure S6a and b. Broadband synthetic accelerograms at all PBR sites for rupture scenario D2 (N-S, north–south; E-W, east–west).
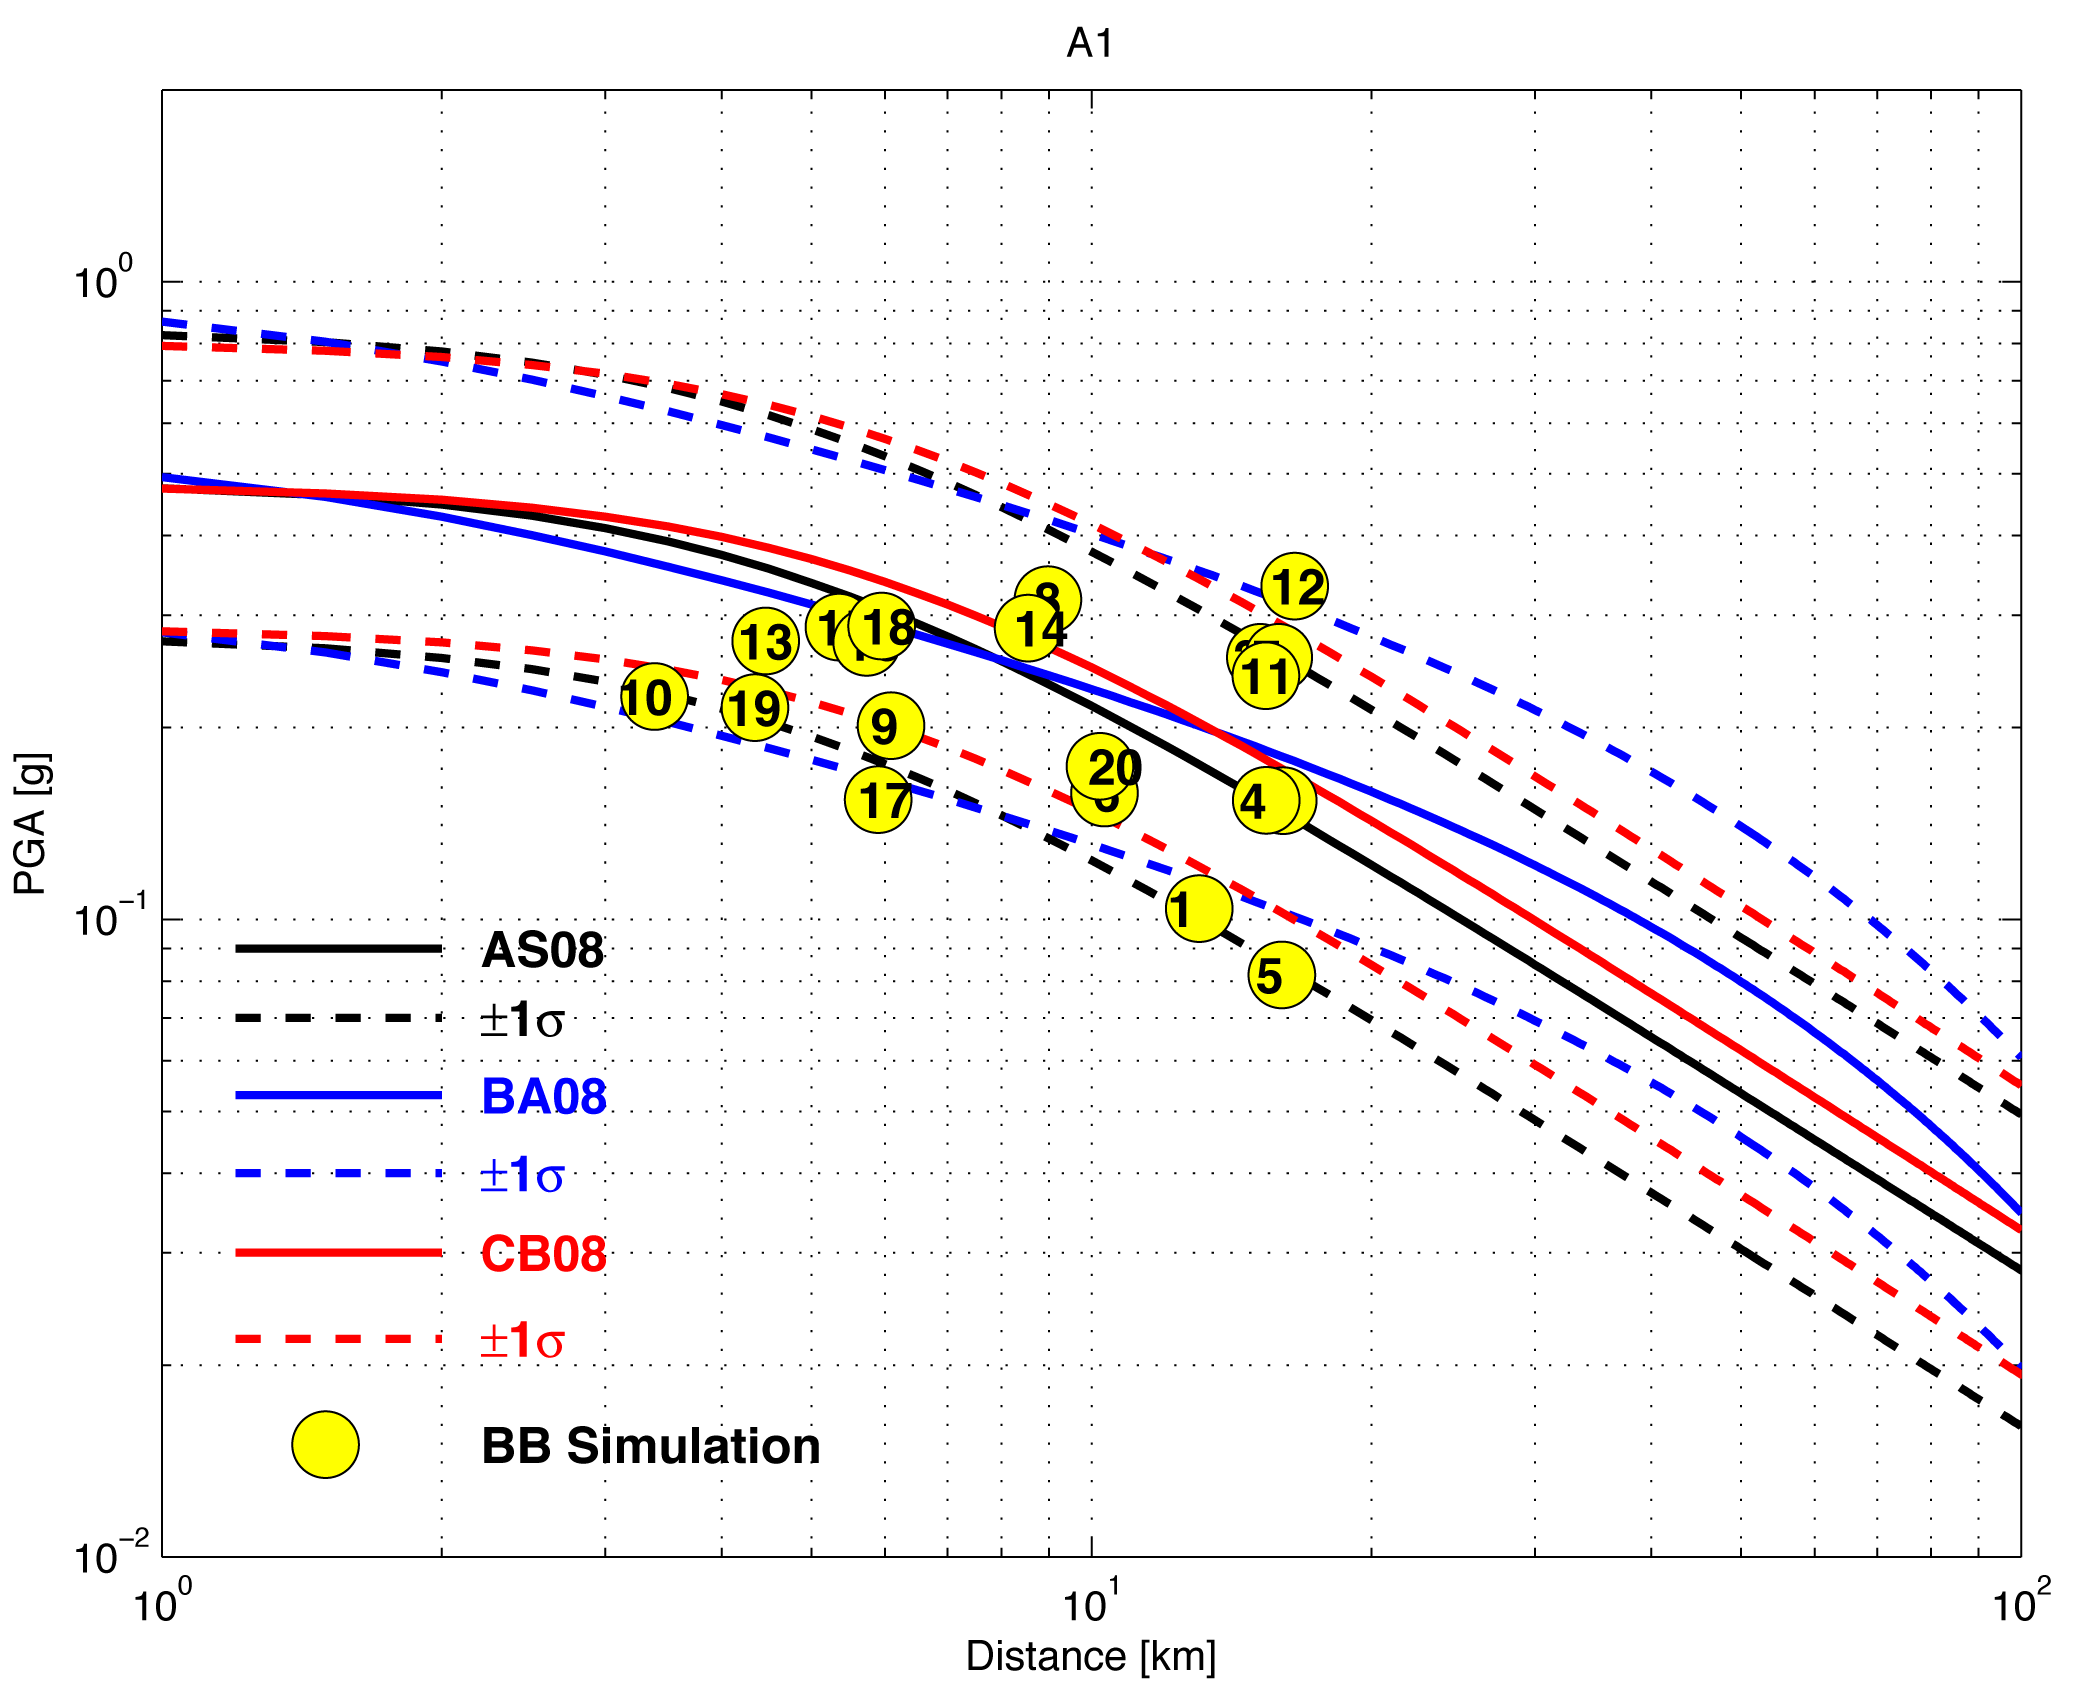
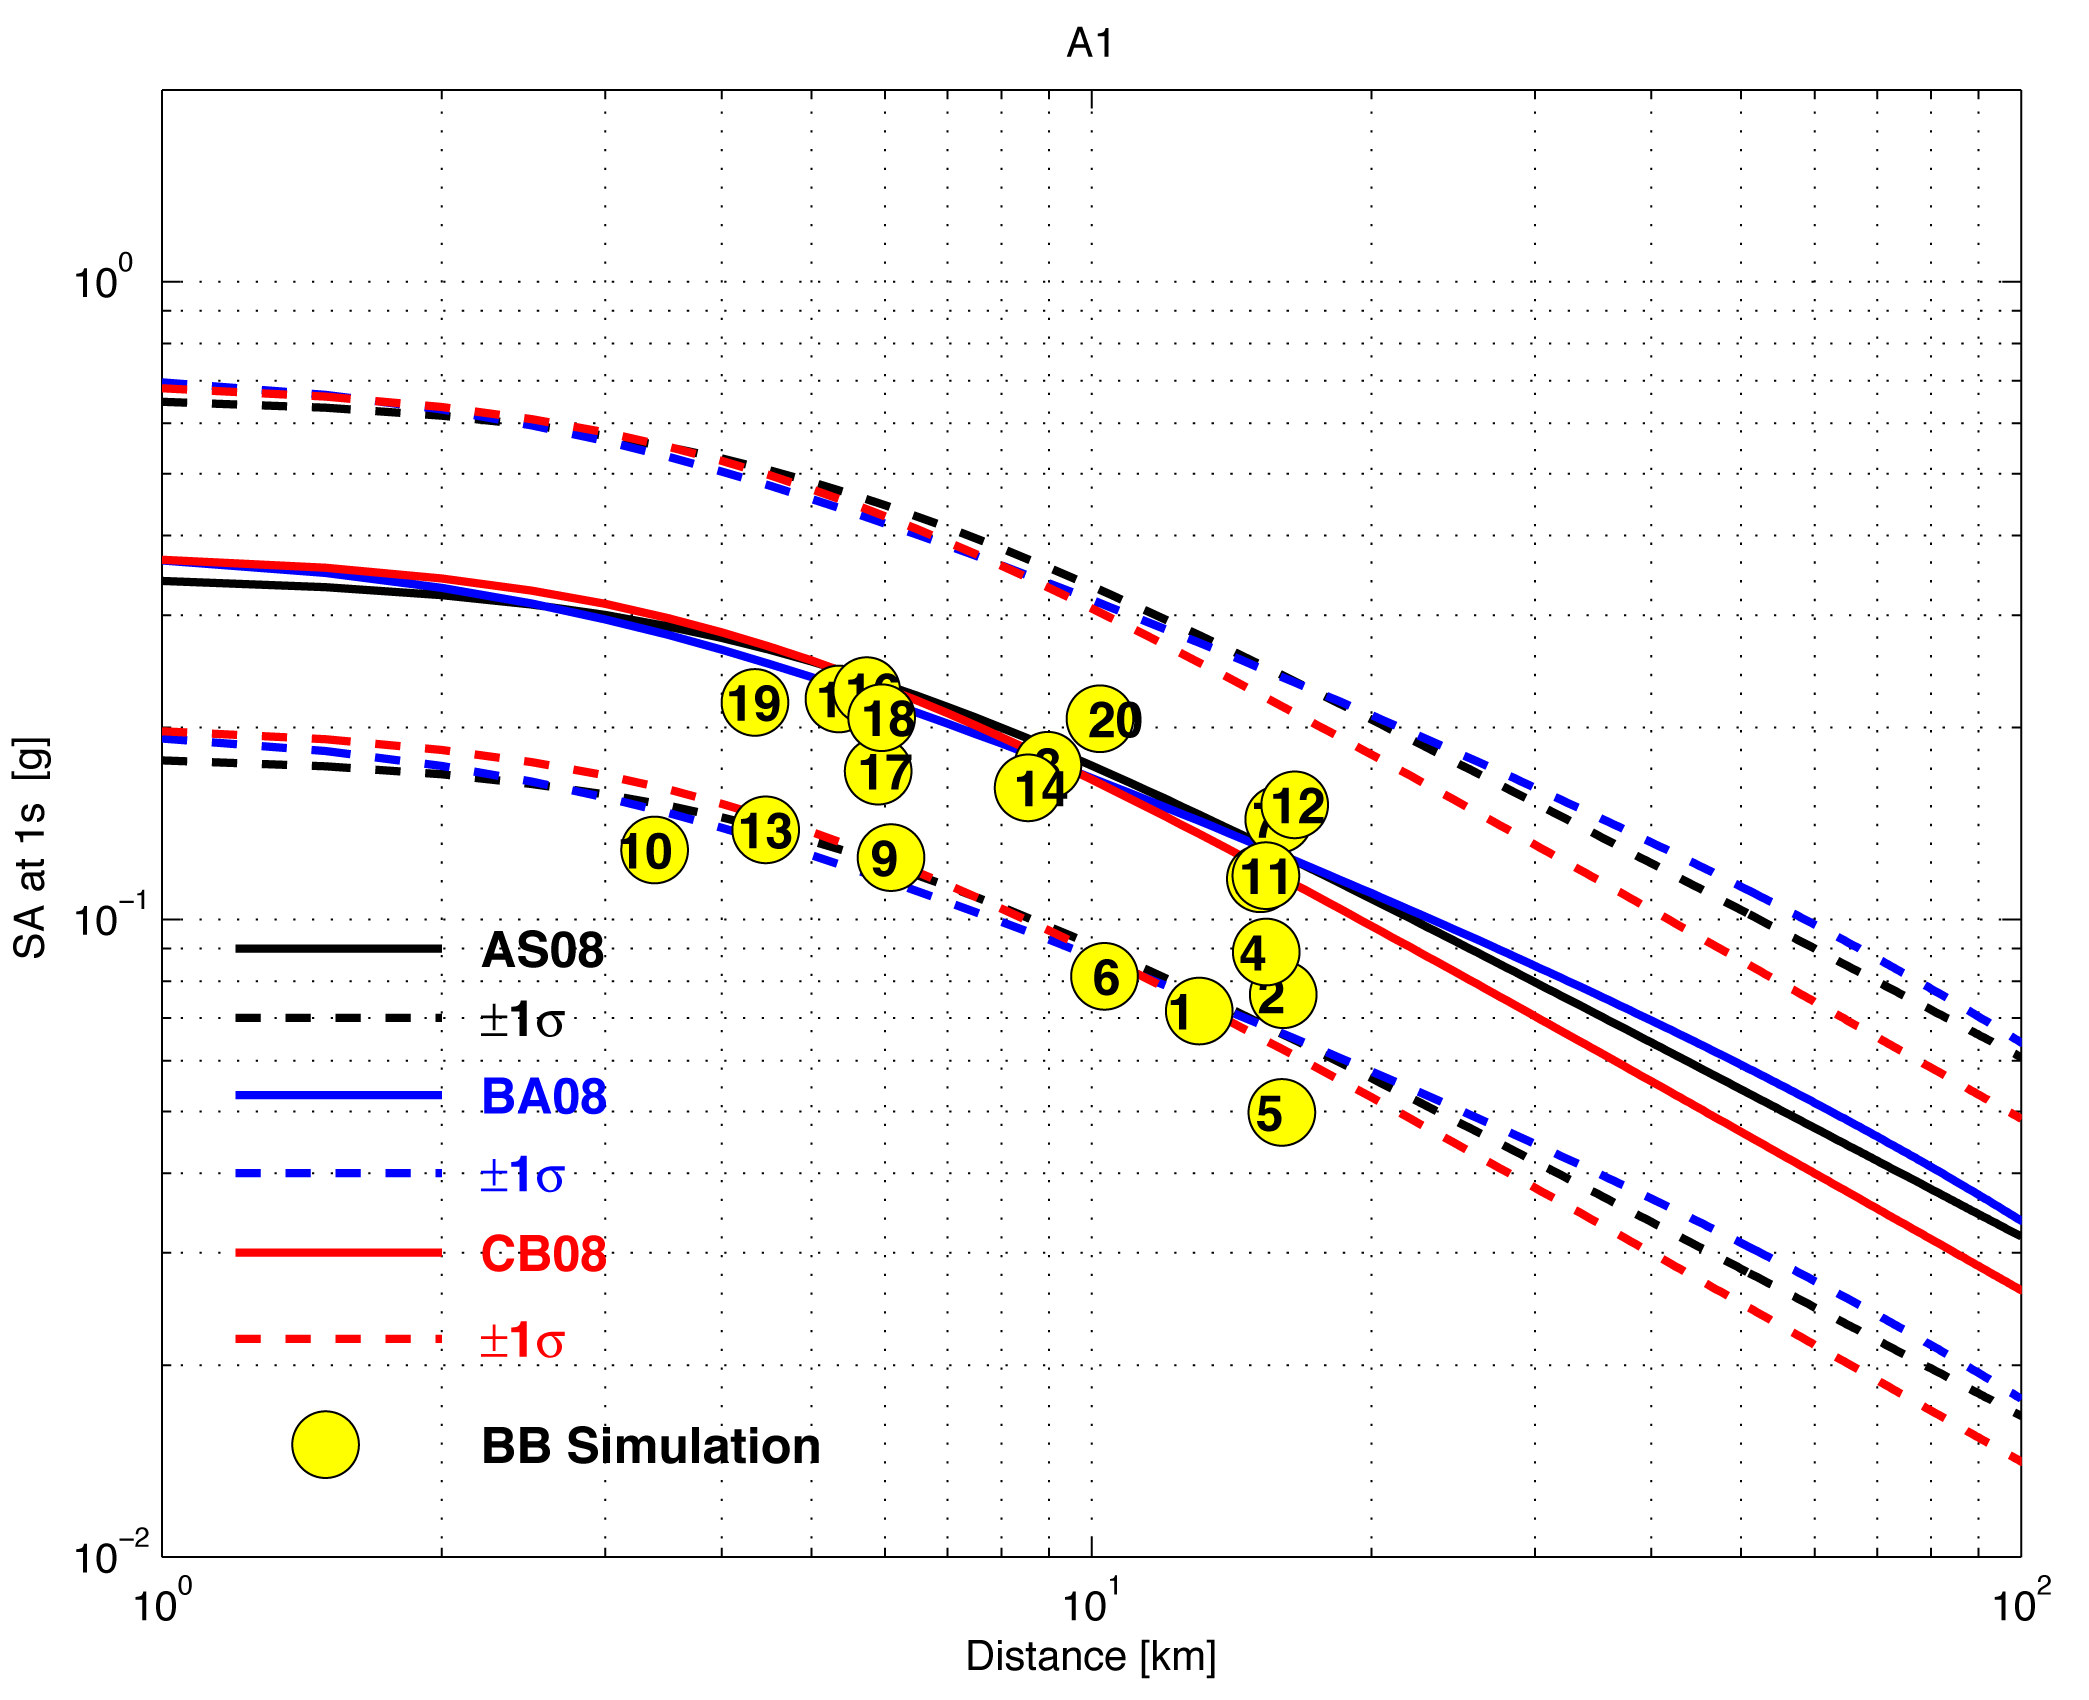
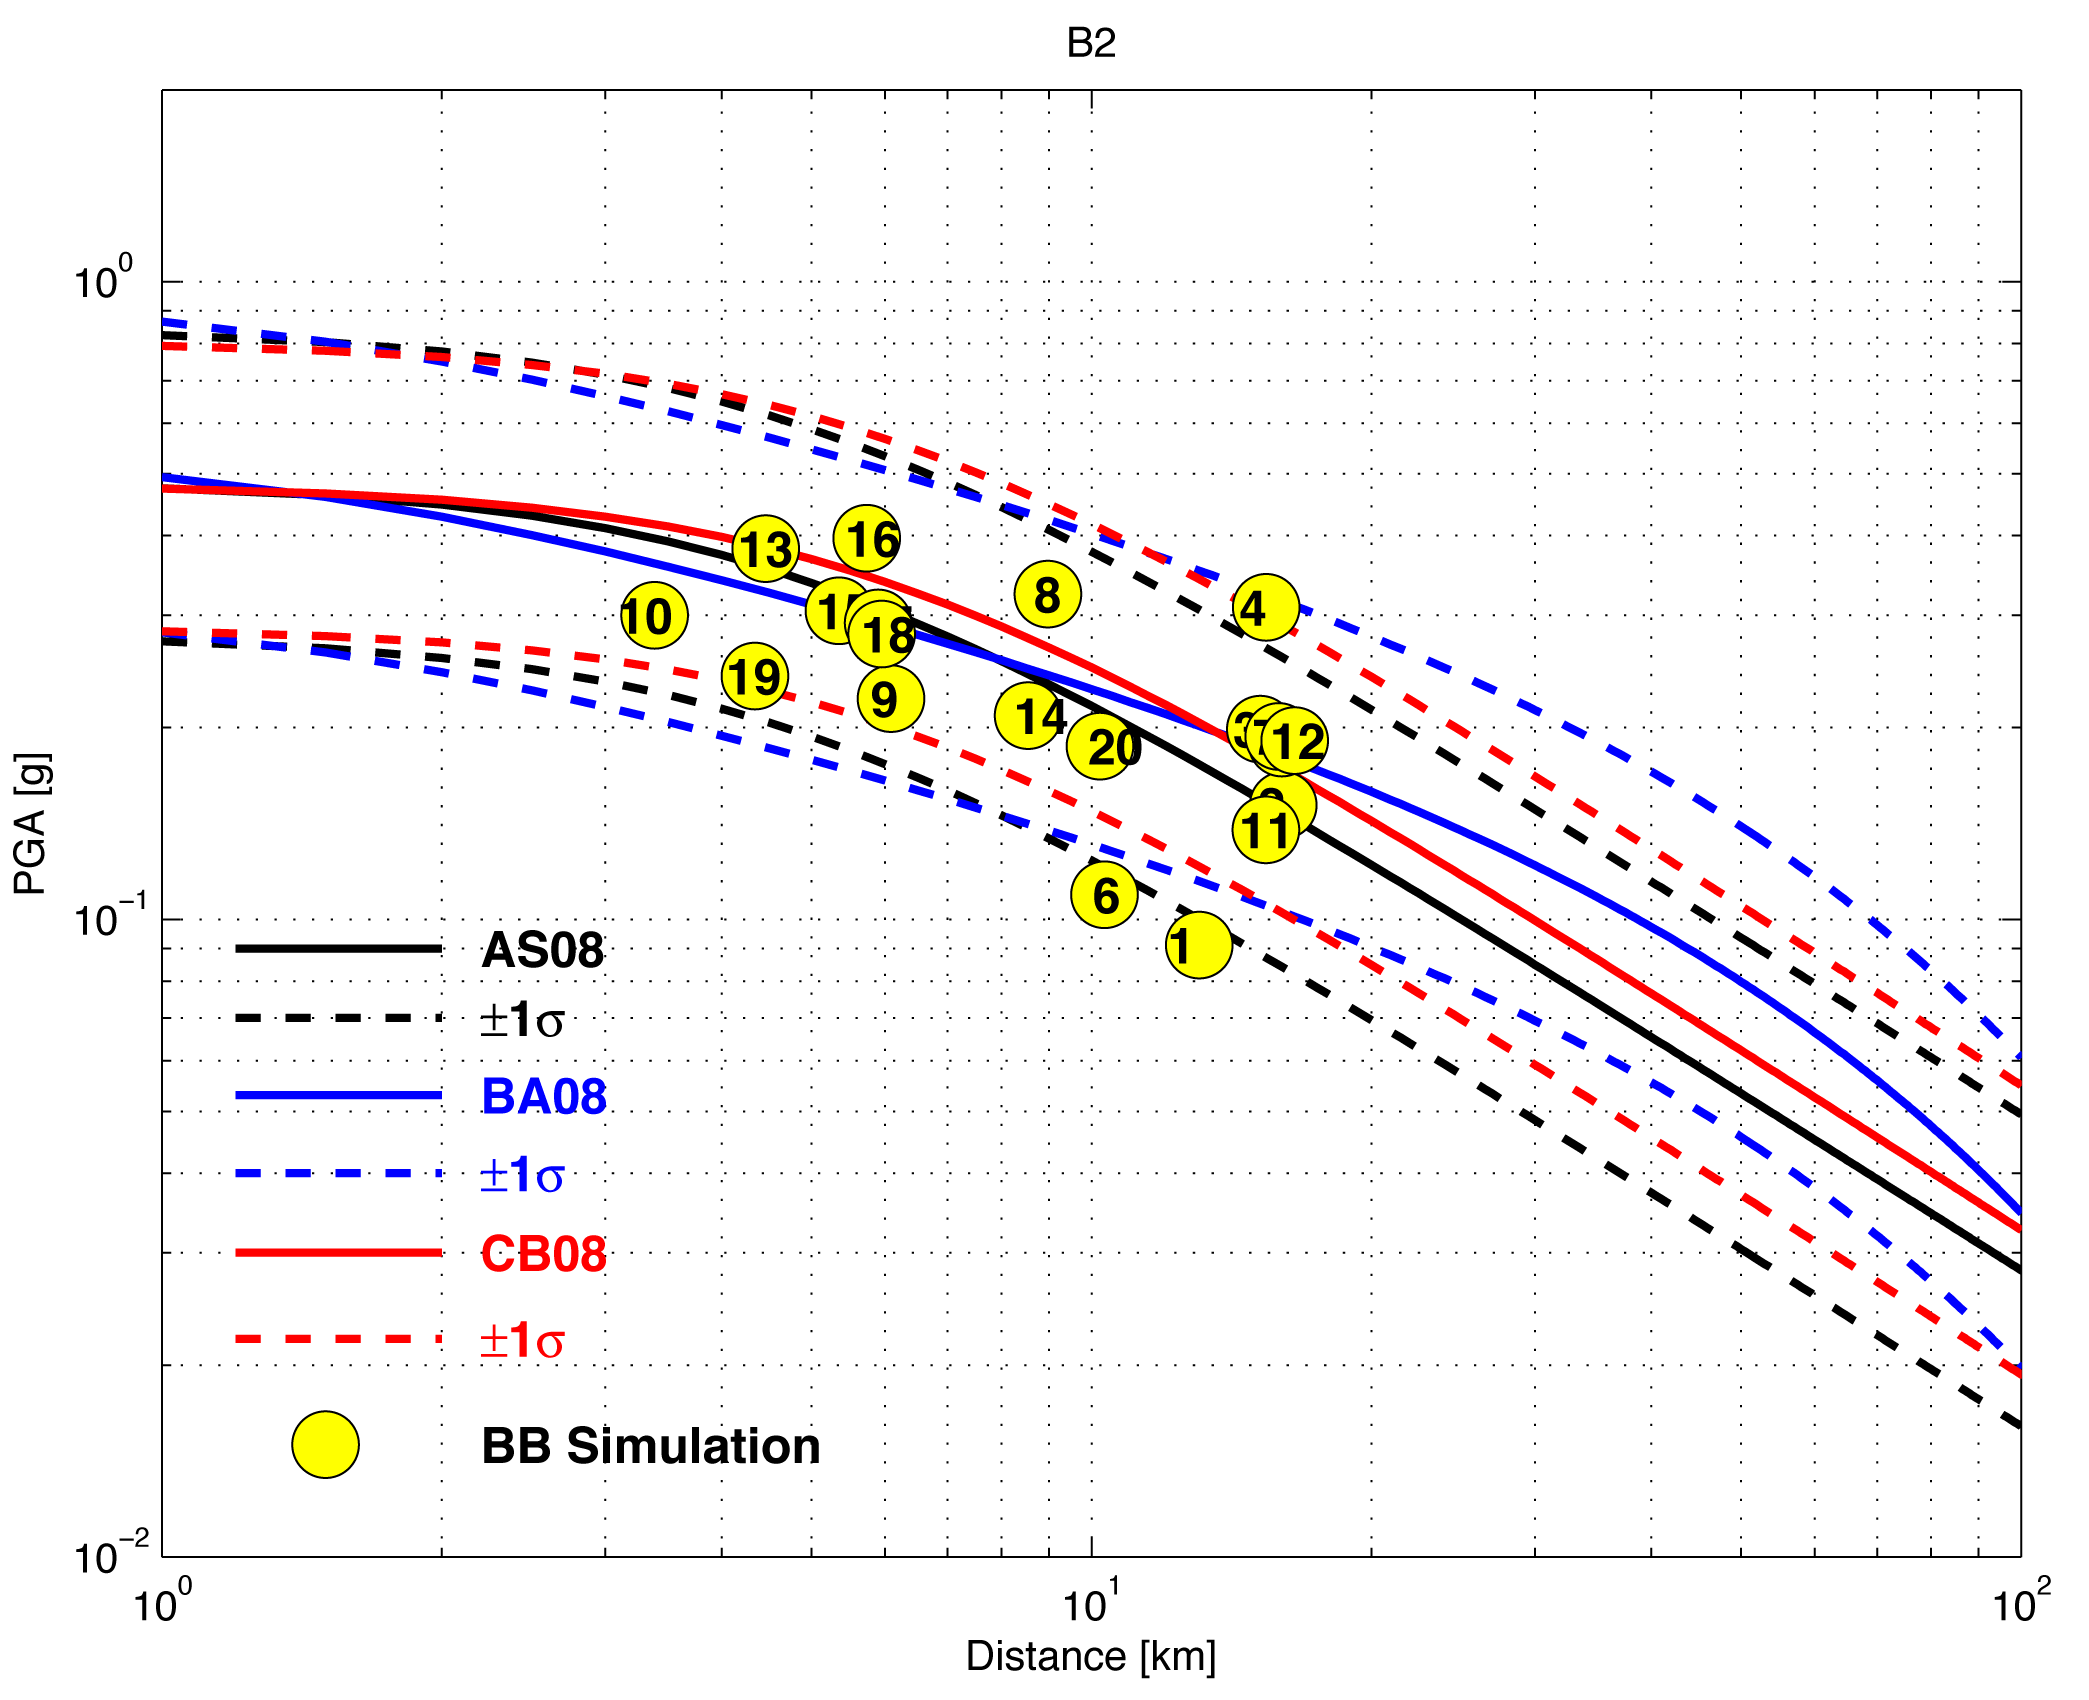
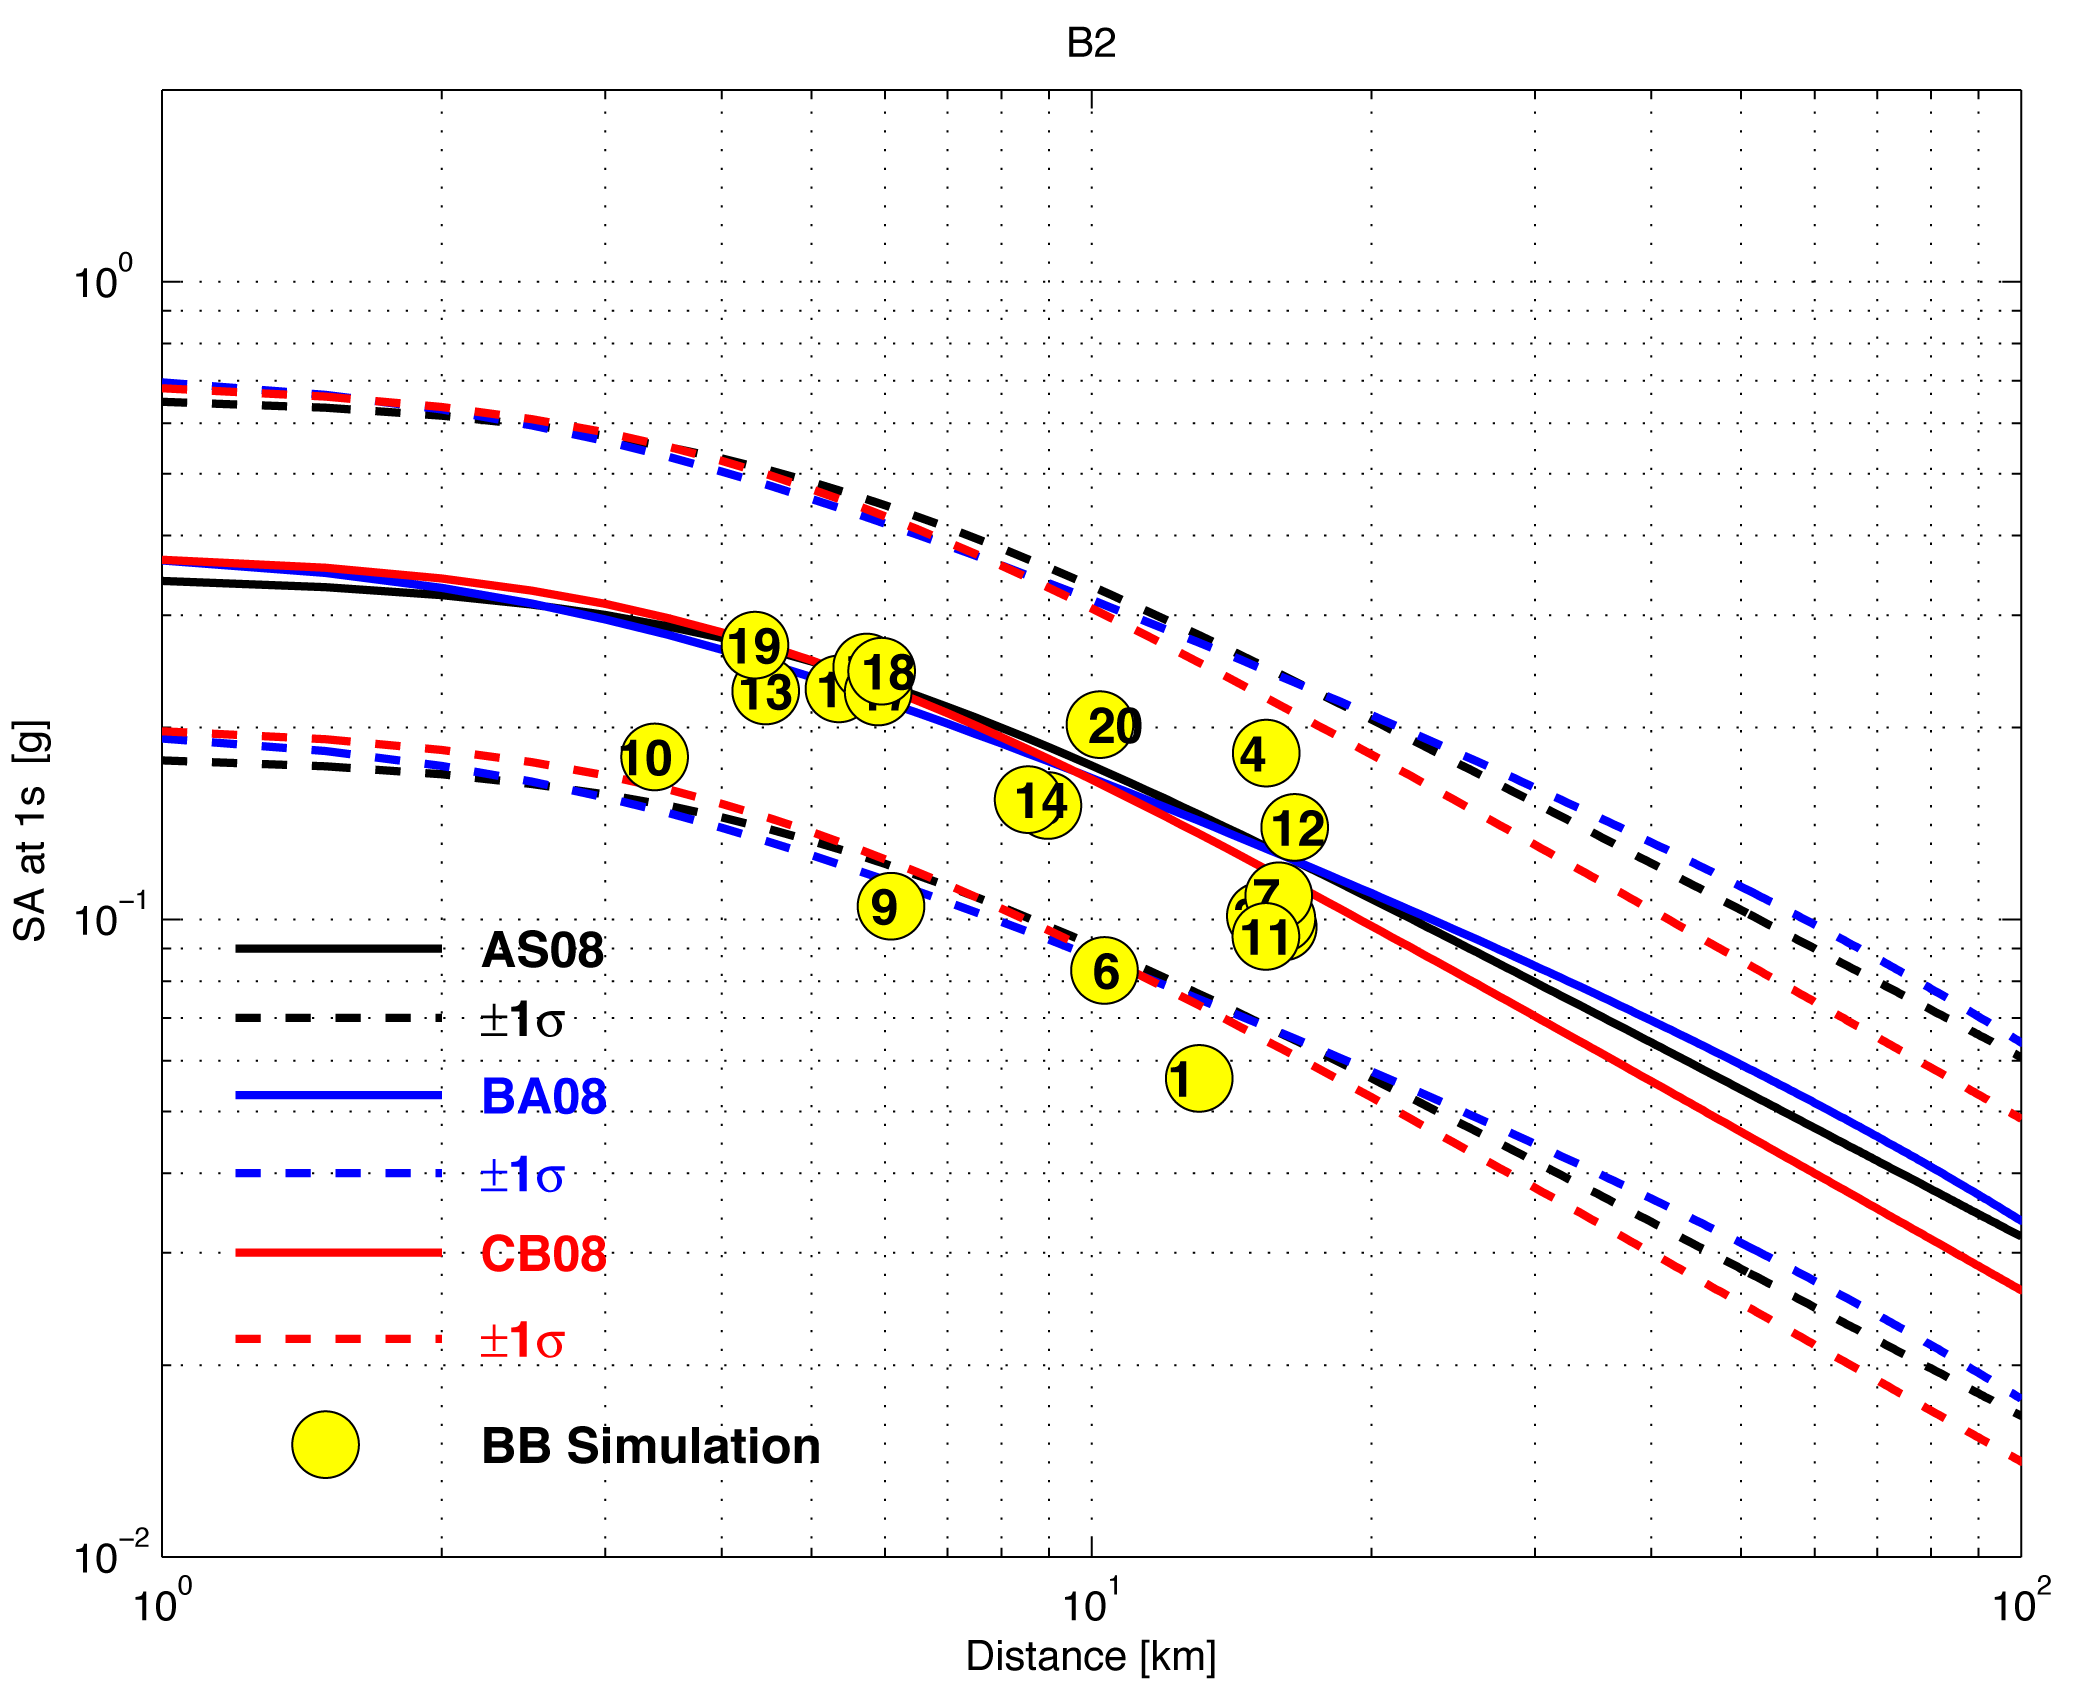
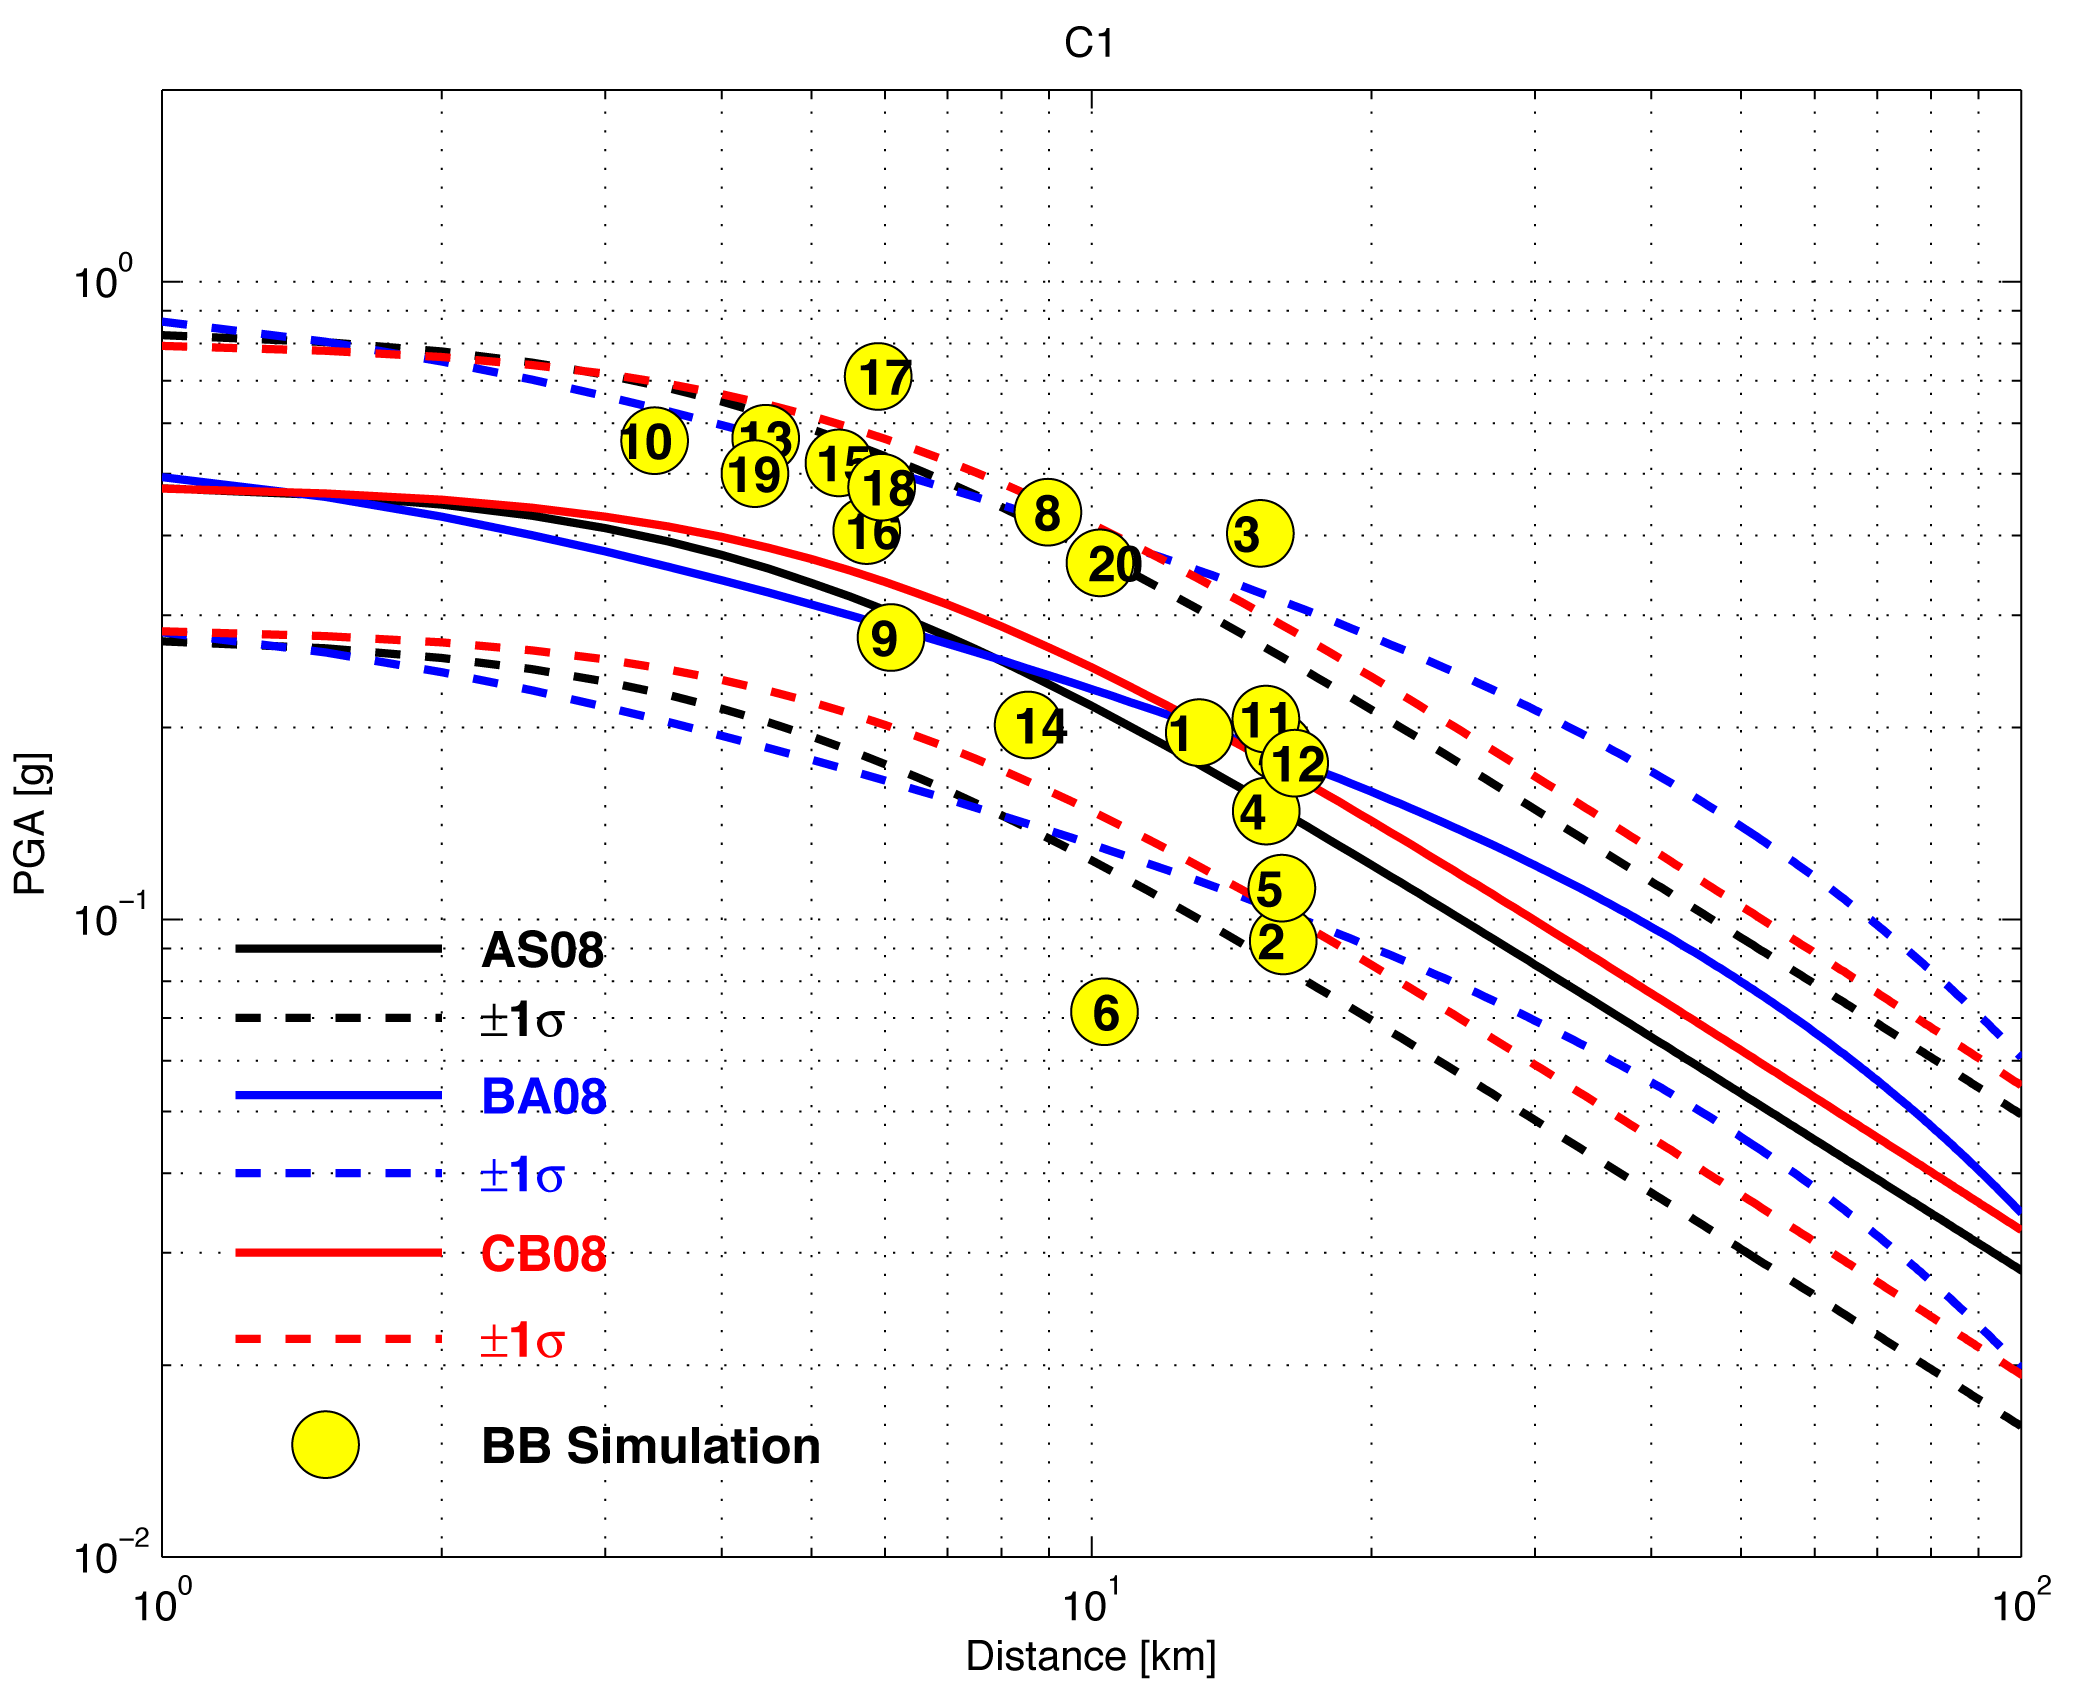
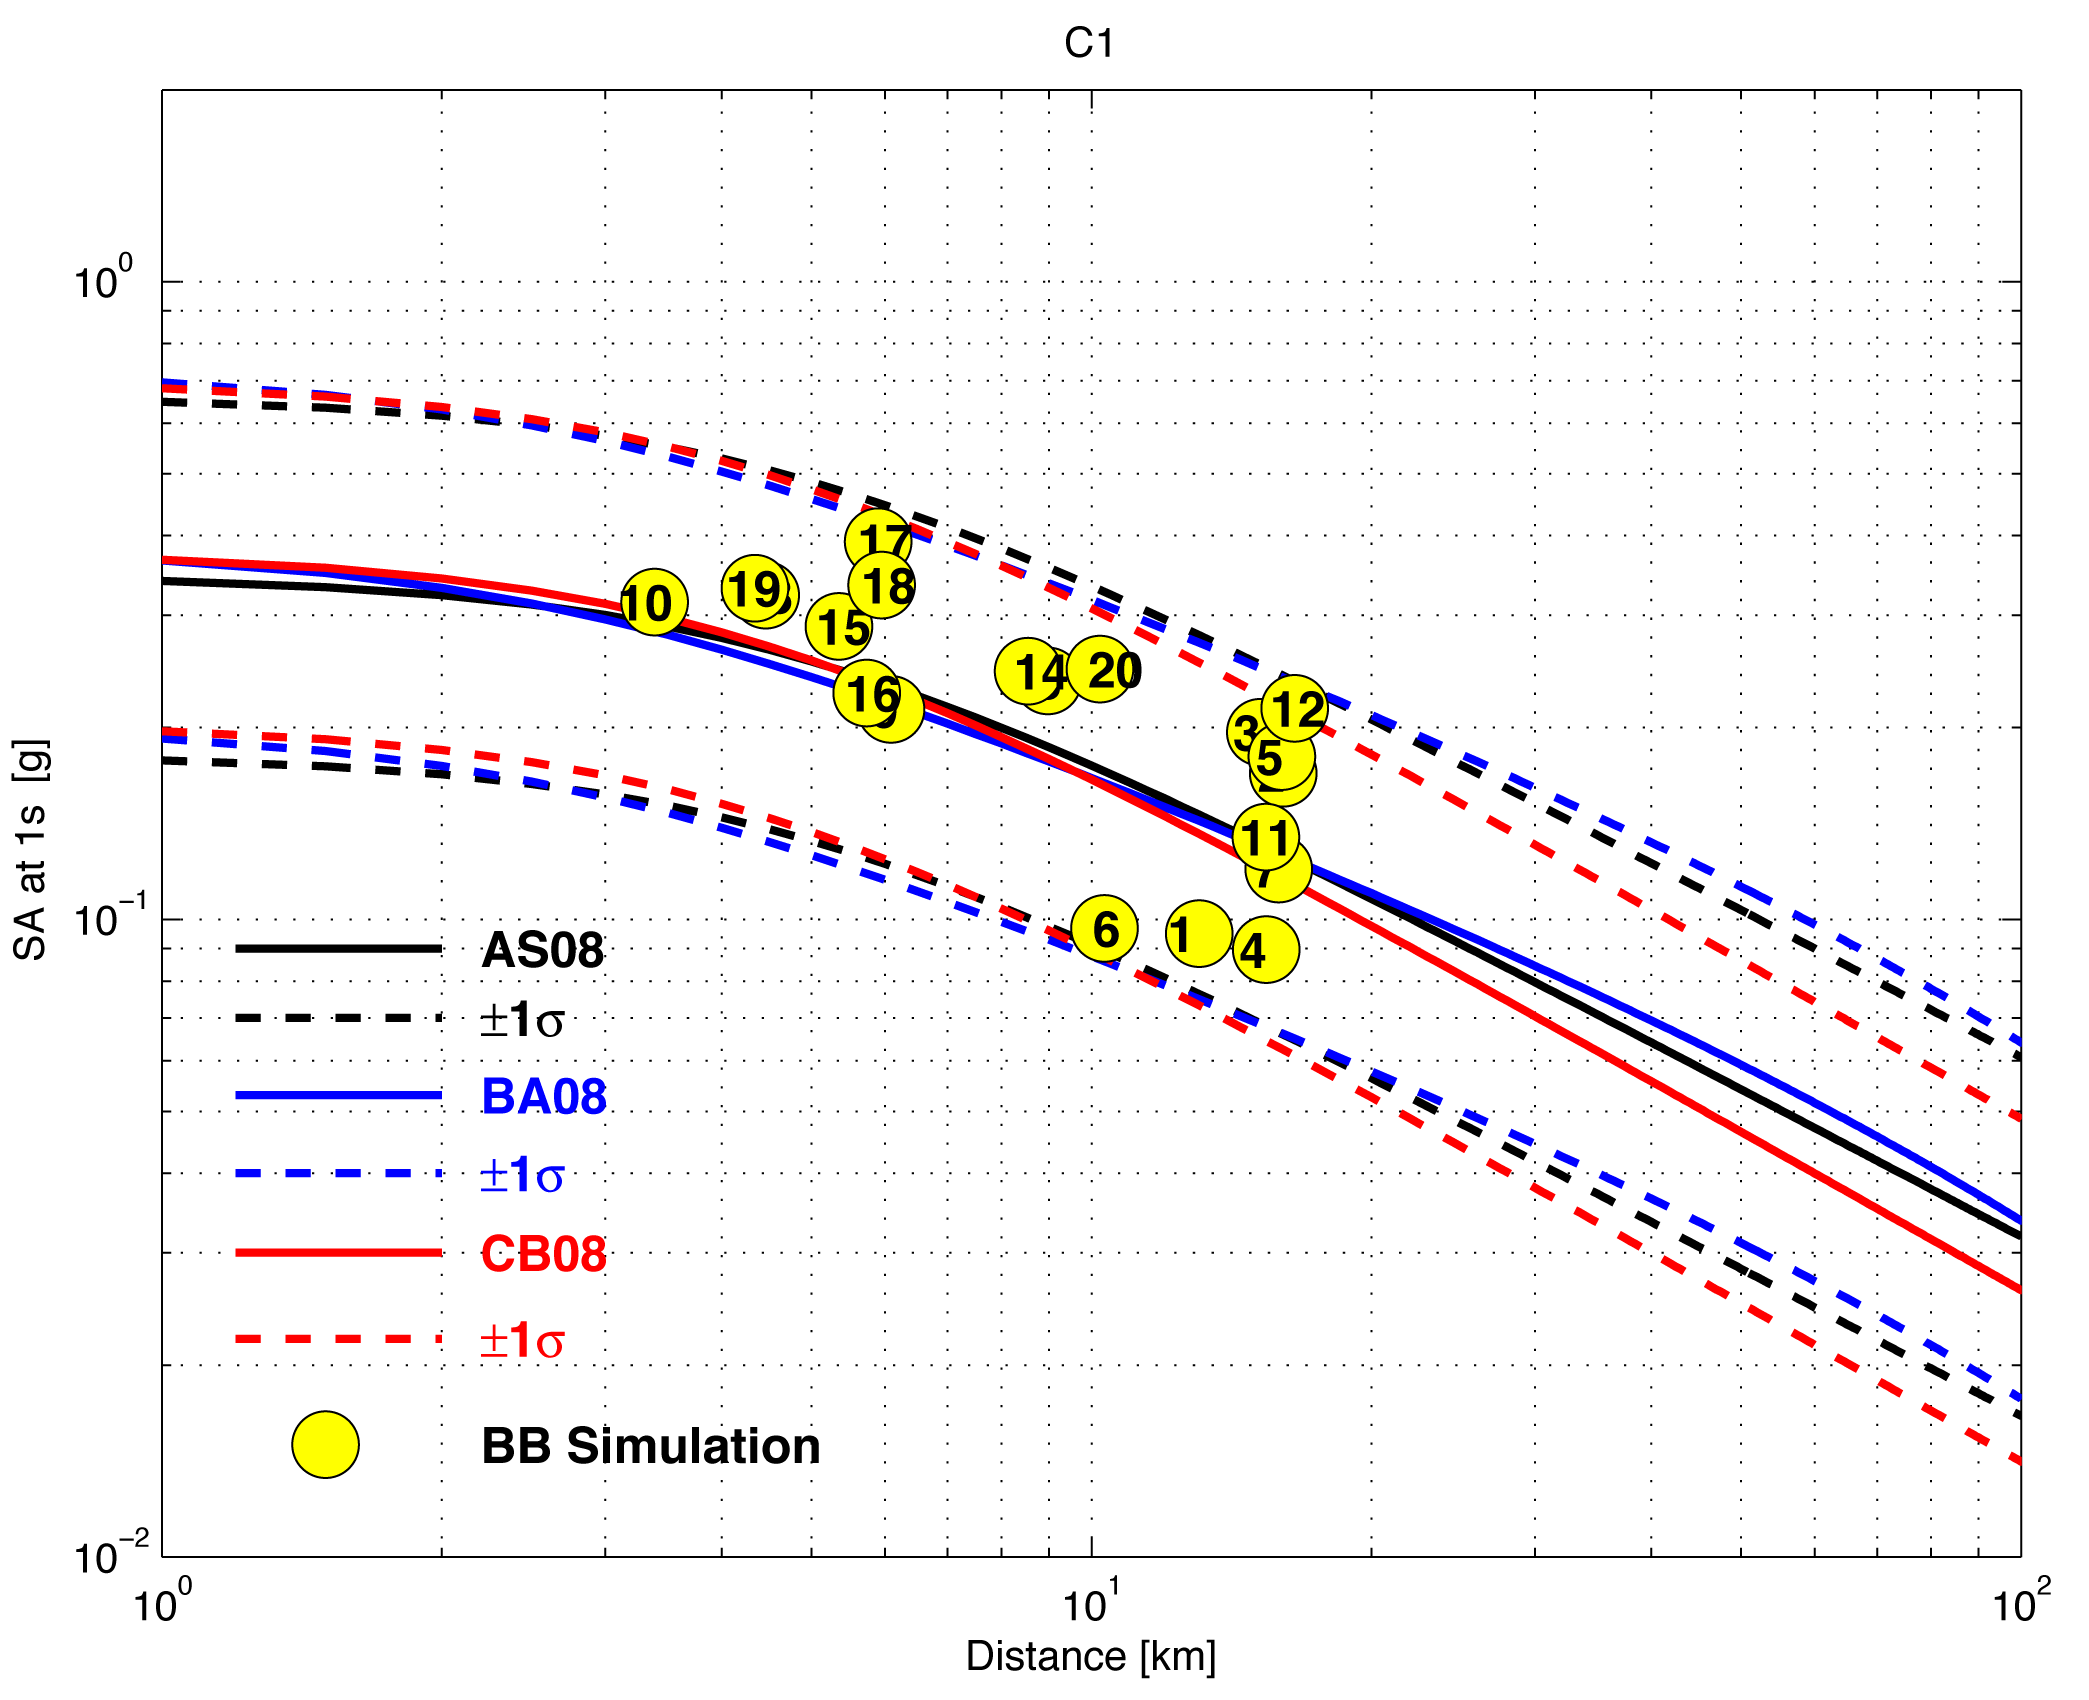
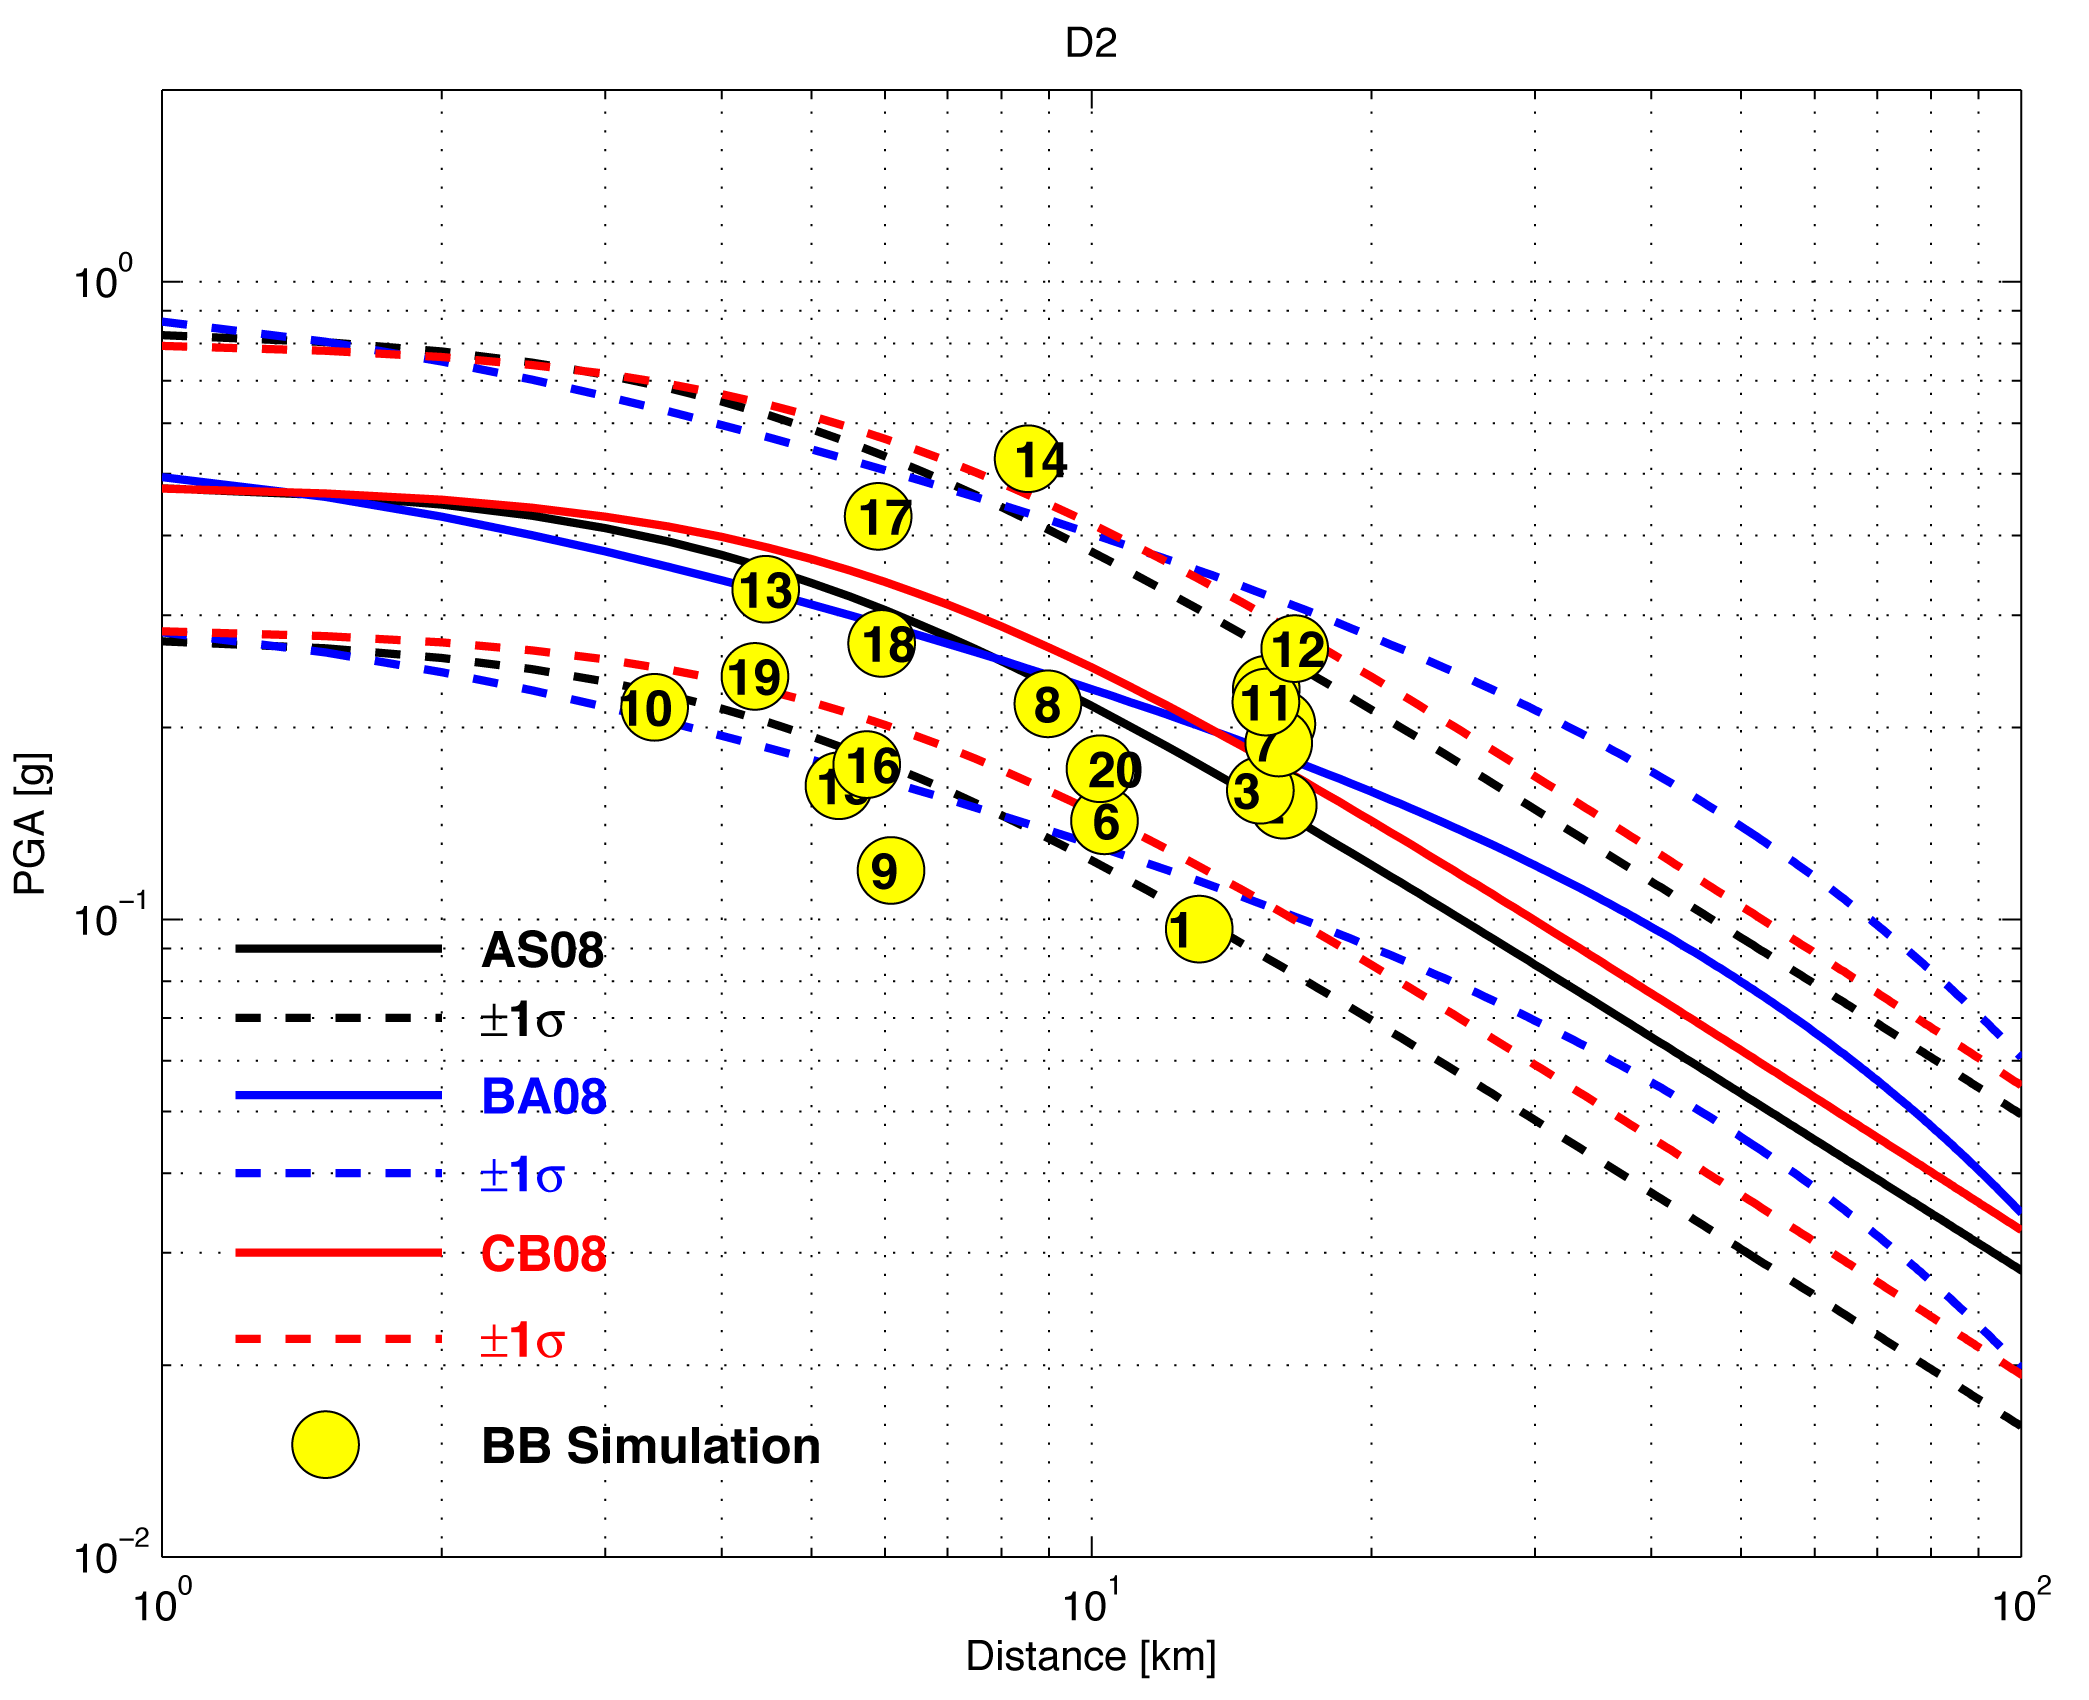
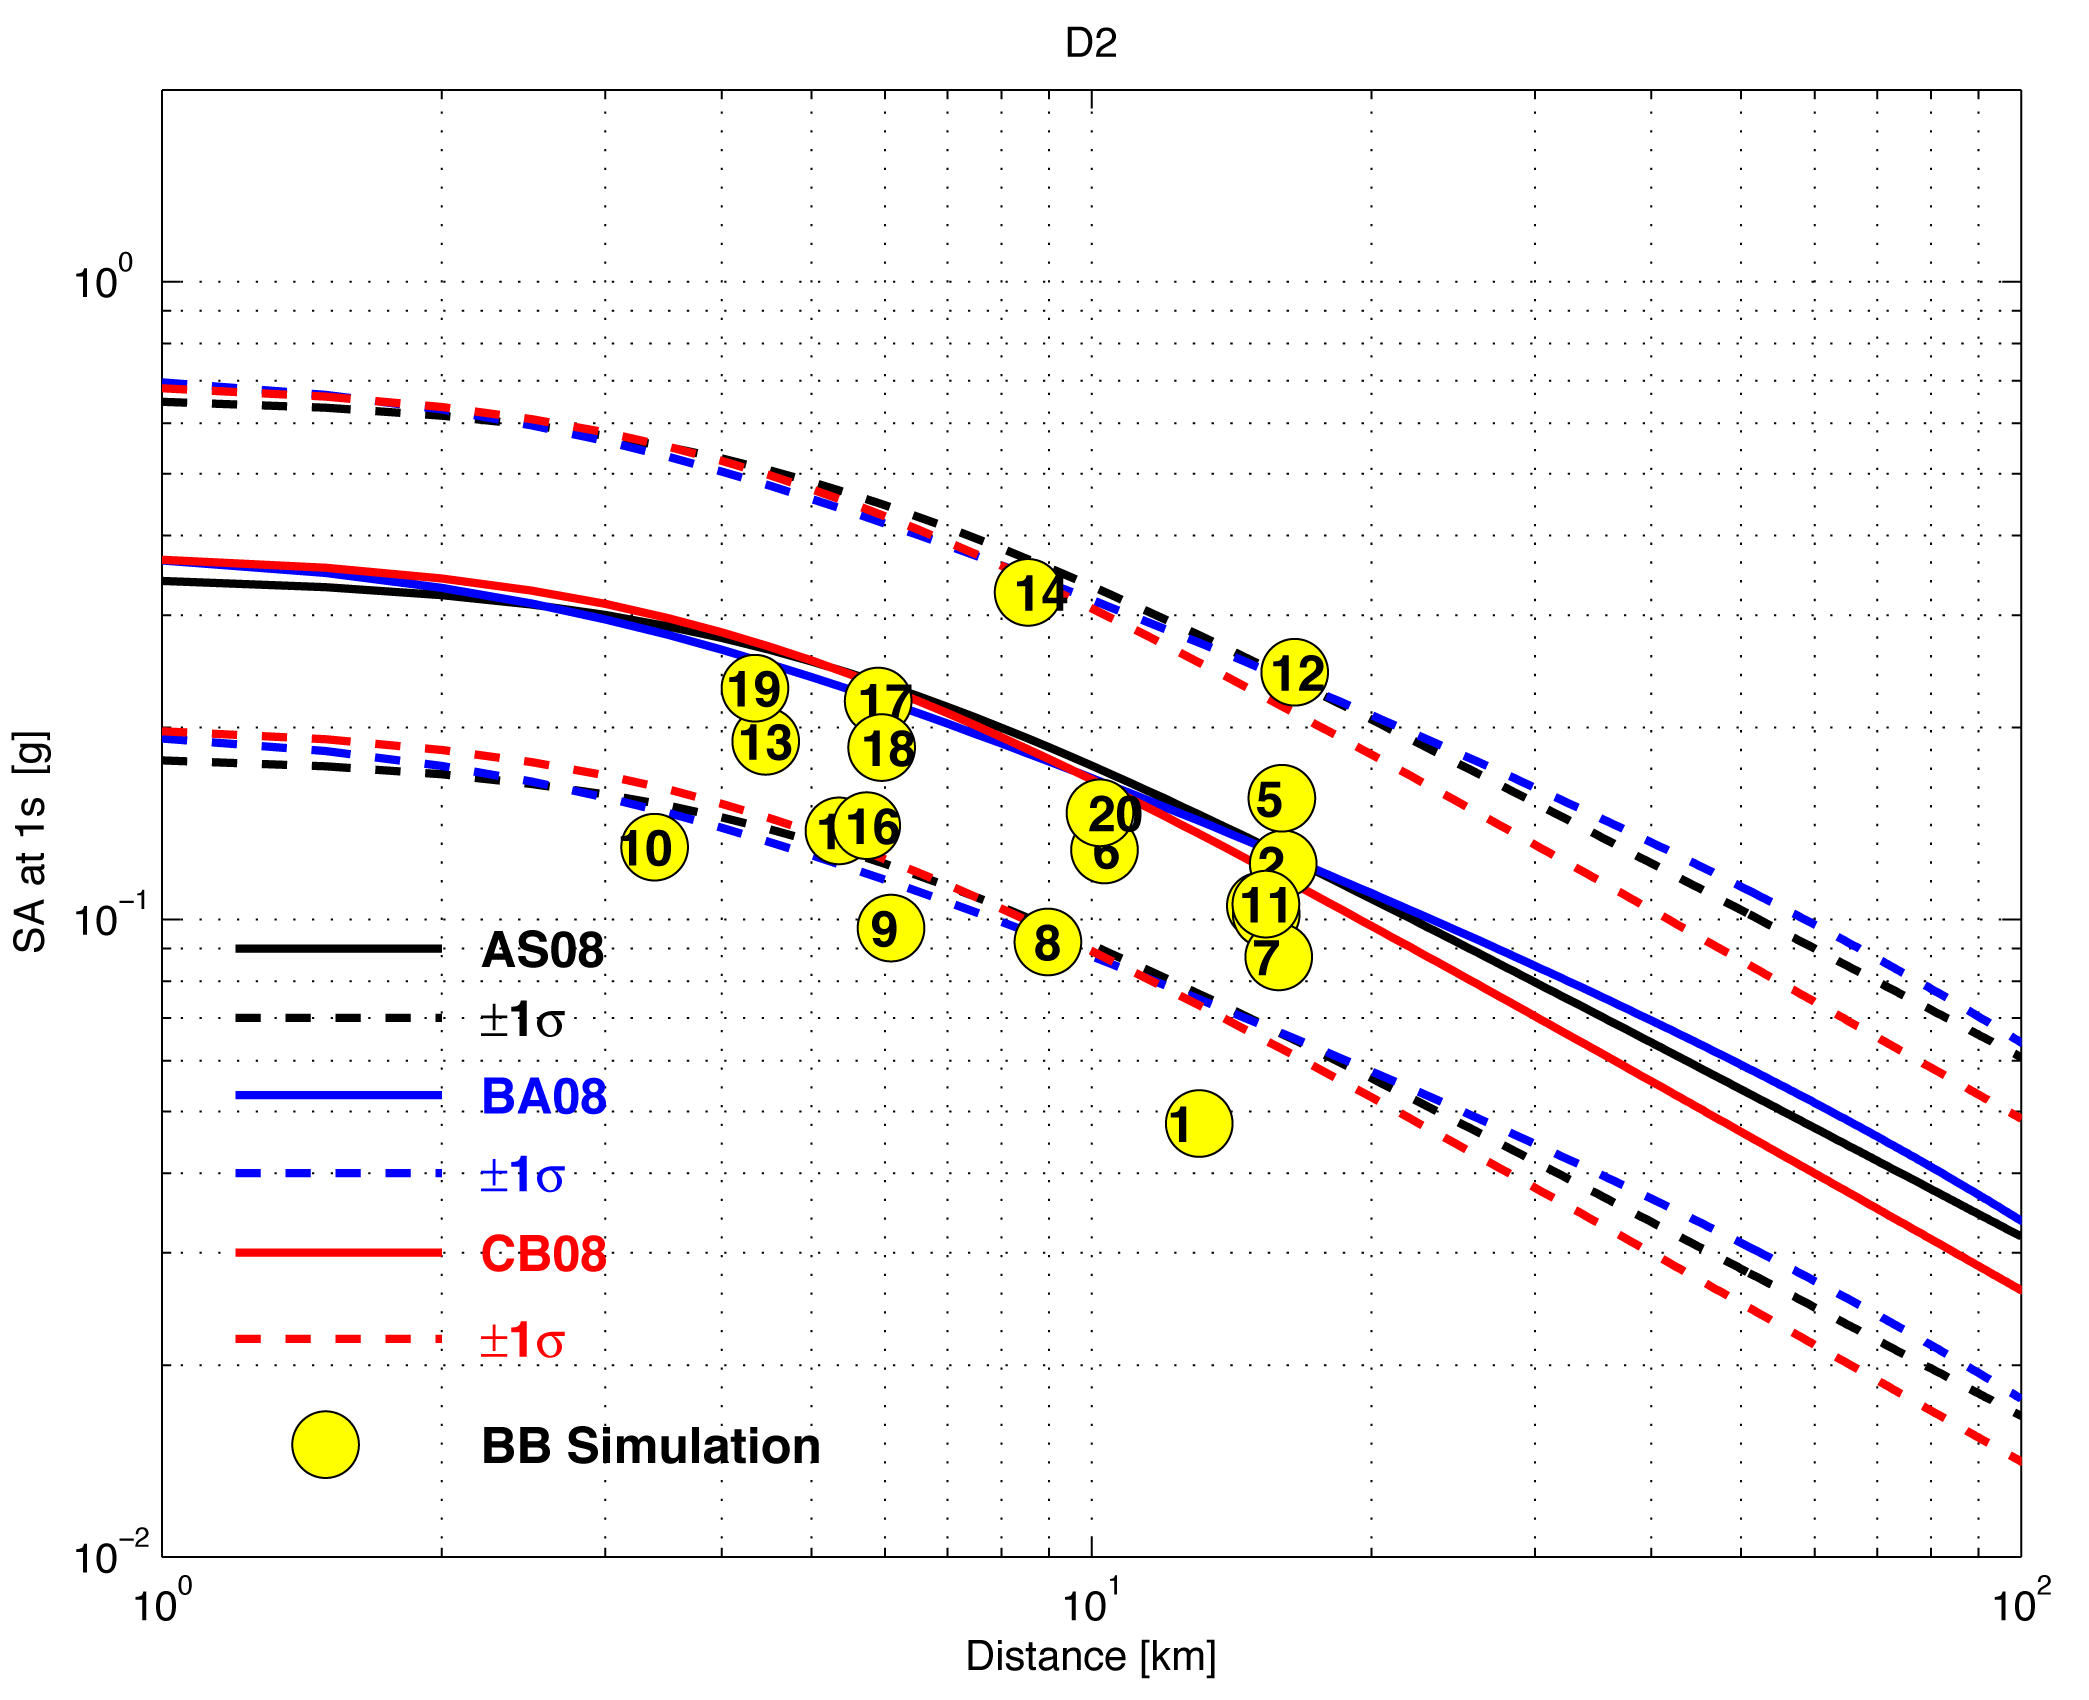
Figure S7a, b, c, d, e, f, g, and h. Comparison of peak ground accelerations (PGAs) and spectral acceleration (SA) at 1 s from the broadband (BB) motions of the dynamic rupture models (identified by model number at the top of each graph) to the leading GMPEs: Abrahamson and Silva (2008) in black, Boore and Atkinson (2008) in blue, and Campbell and Bozorgnia (2008) in red. Solid lines indicate mean values from the GMPEs, and dashed lines represent ±1σ. Each yellow dot represents a version of the specified rupture scenario using a different stochastic scatterer realization in the media.
Abrahamson, N. A., and W. J. Silva (2008). Summary of the Abrahamson and Silva NGA Ground-Motion Relations, Earthq. Spectra 24, no. 1, 67–97.
Boore, D. M., and G. M. Atkinson (2008). Ground-motion prediction equations for the average horizontal component of PGA, PGV, and 5%-damped PSA at spectral periods between 0.01 and 10.0 s, Earthq. Spectra 24, no. 1, 99–138.
Campbell, K. W., and Y. Bozorgnia (2008). NGA ground motion model for the geometric mean horizontal component of PGA, PGV, PGD and 5% damped linear elastic response spectra for periods ranging from 0.01 to 10 s, Earthq. Spectra 24, no. 1, 139–171.
[ Back ]