This electronic supplement contains figures of the distribution of between-event residuals with respect to magnitude and fault-top depth and the distribution of within-event residuals with respect to magnitude and source distance.
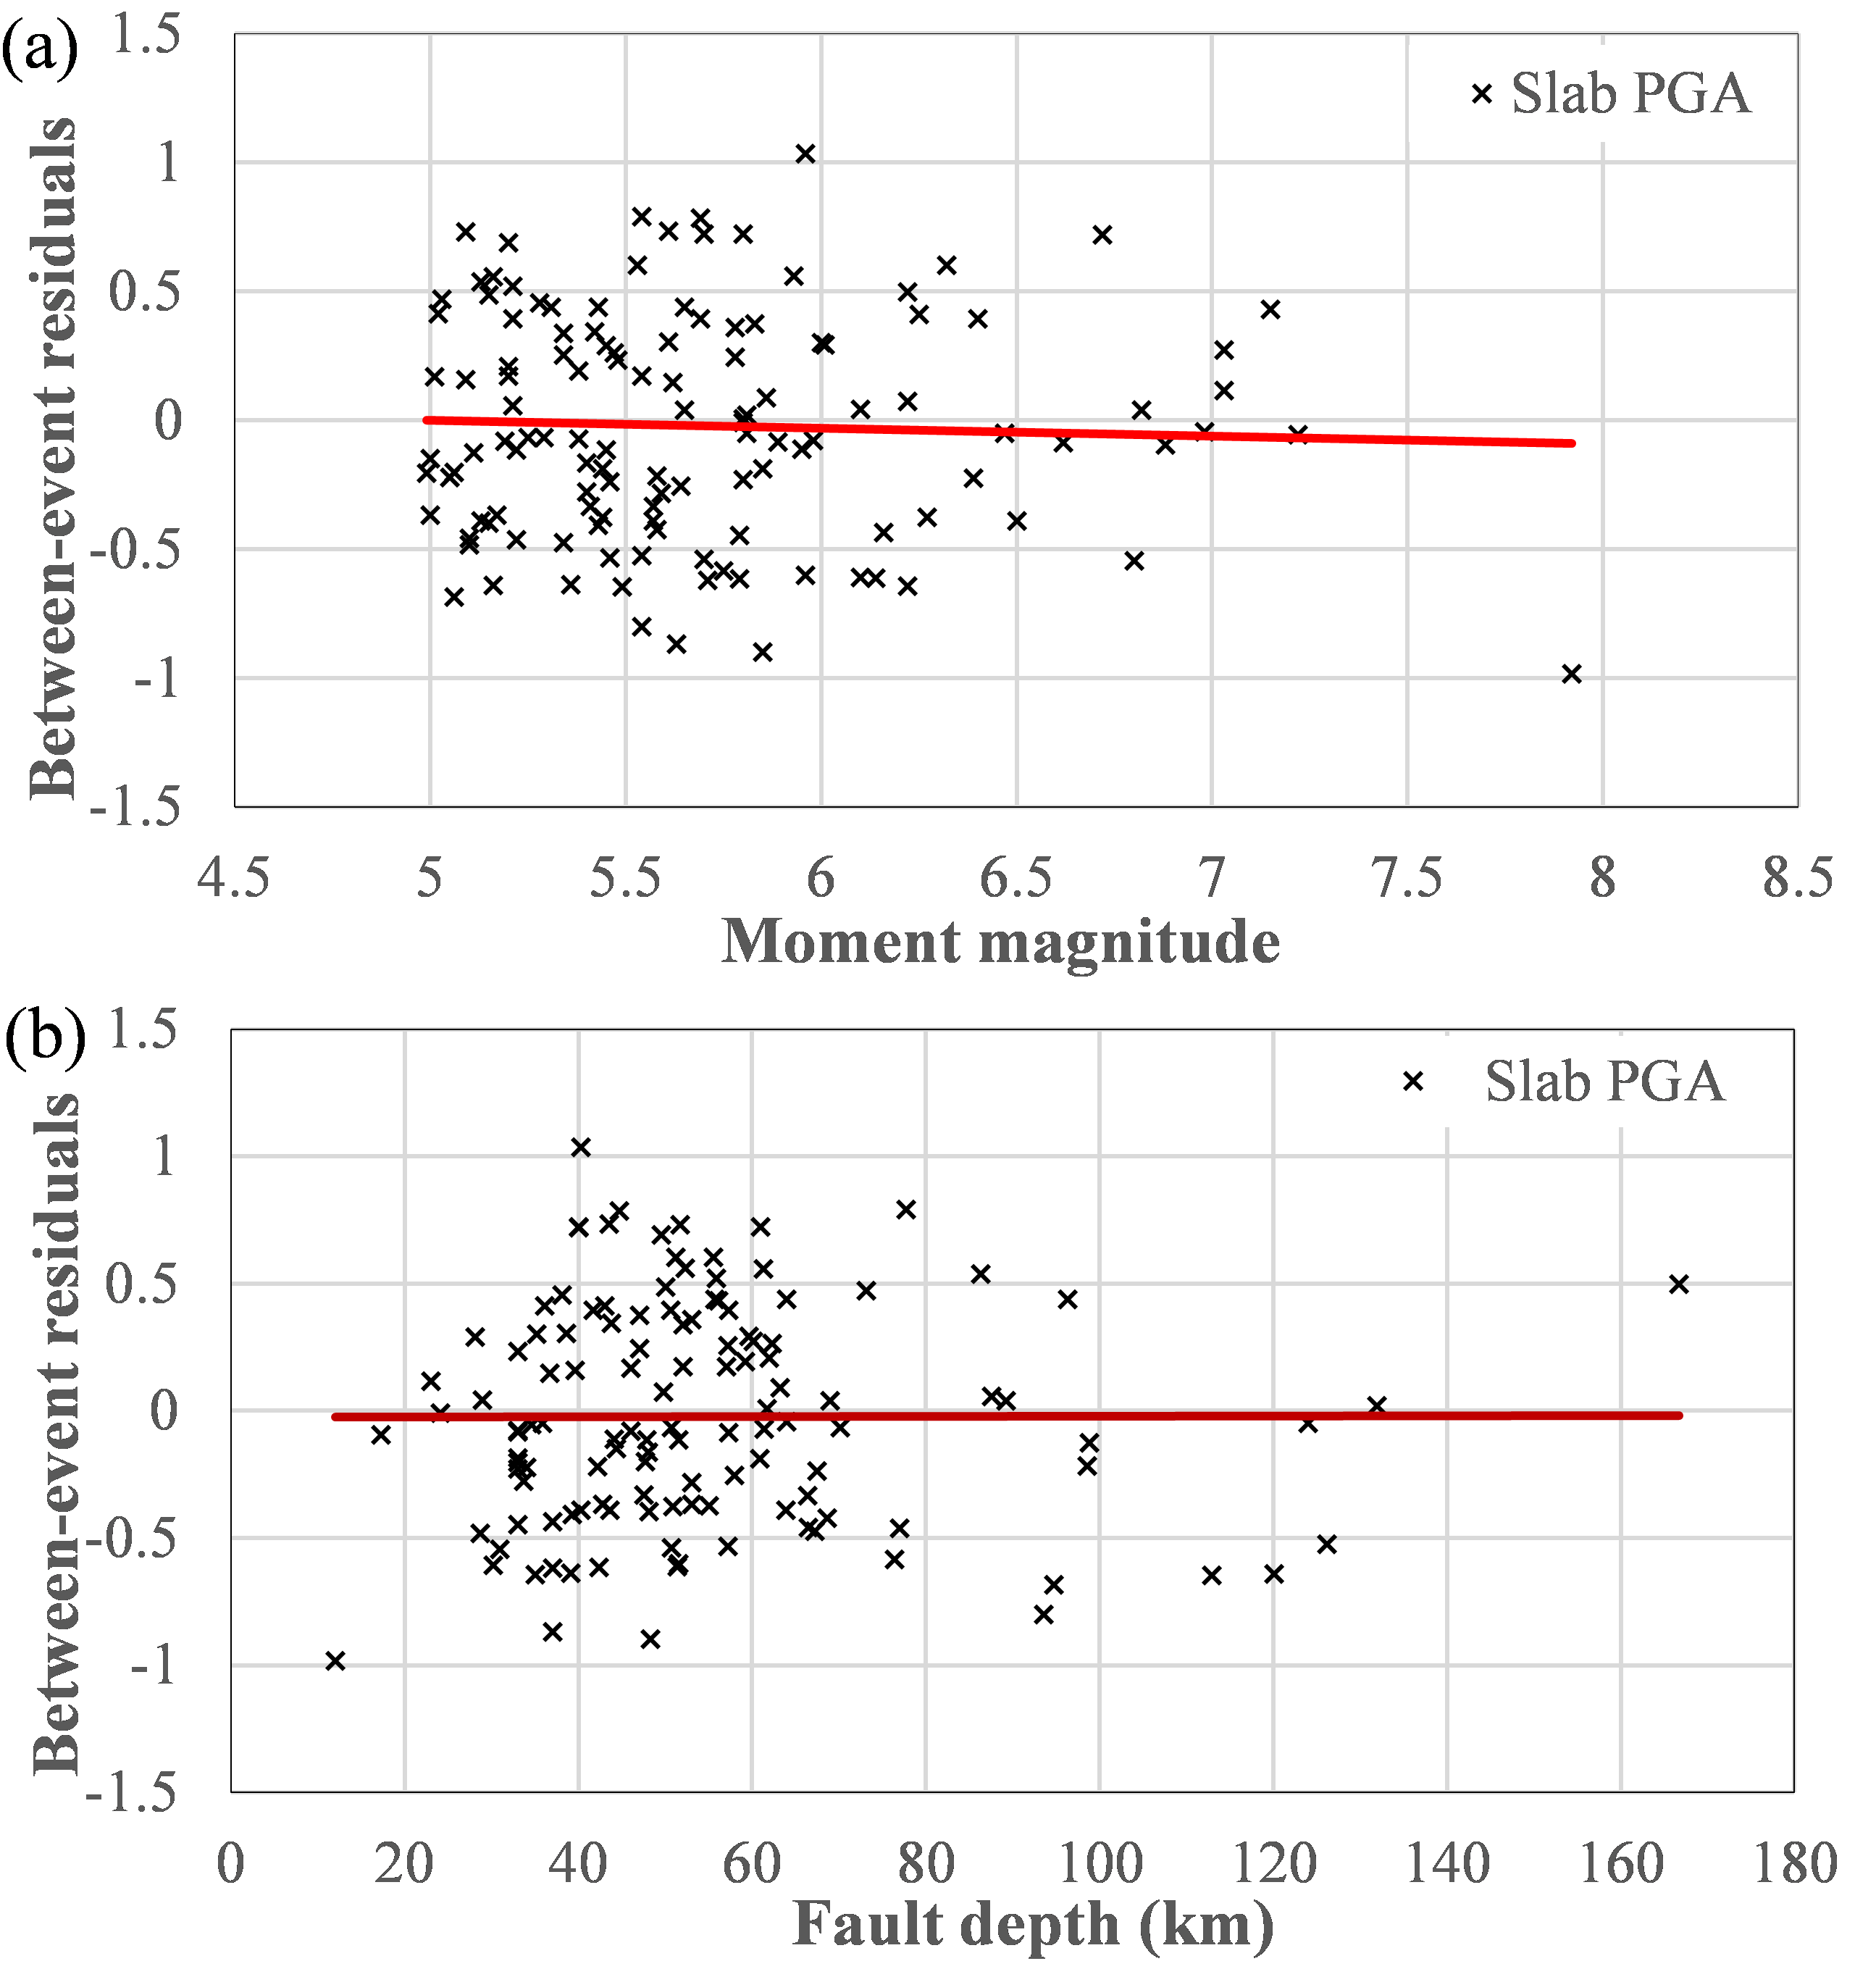
Figure S1. Distribution of between-event residuals for peak ground acceleration (PGA), with respect to (a) magnitude and (b) fault depth.
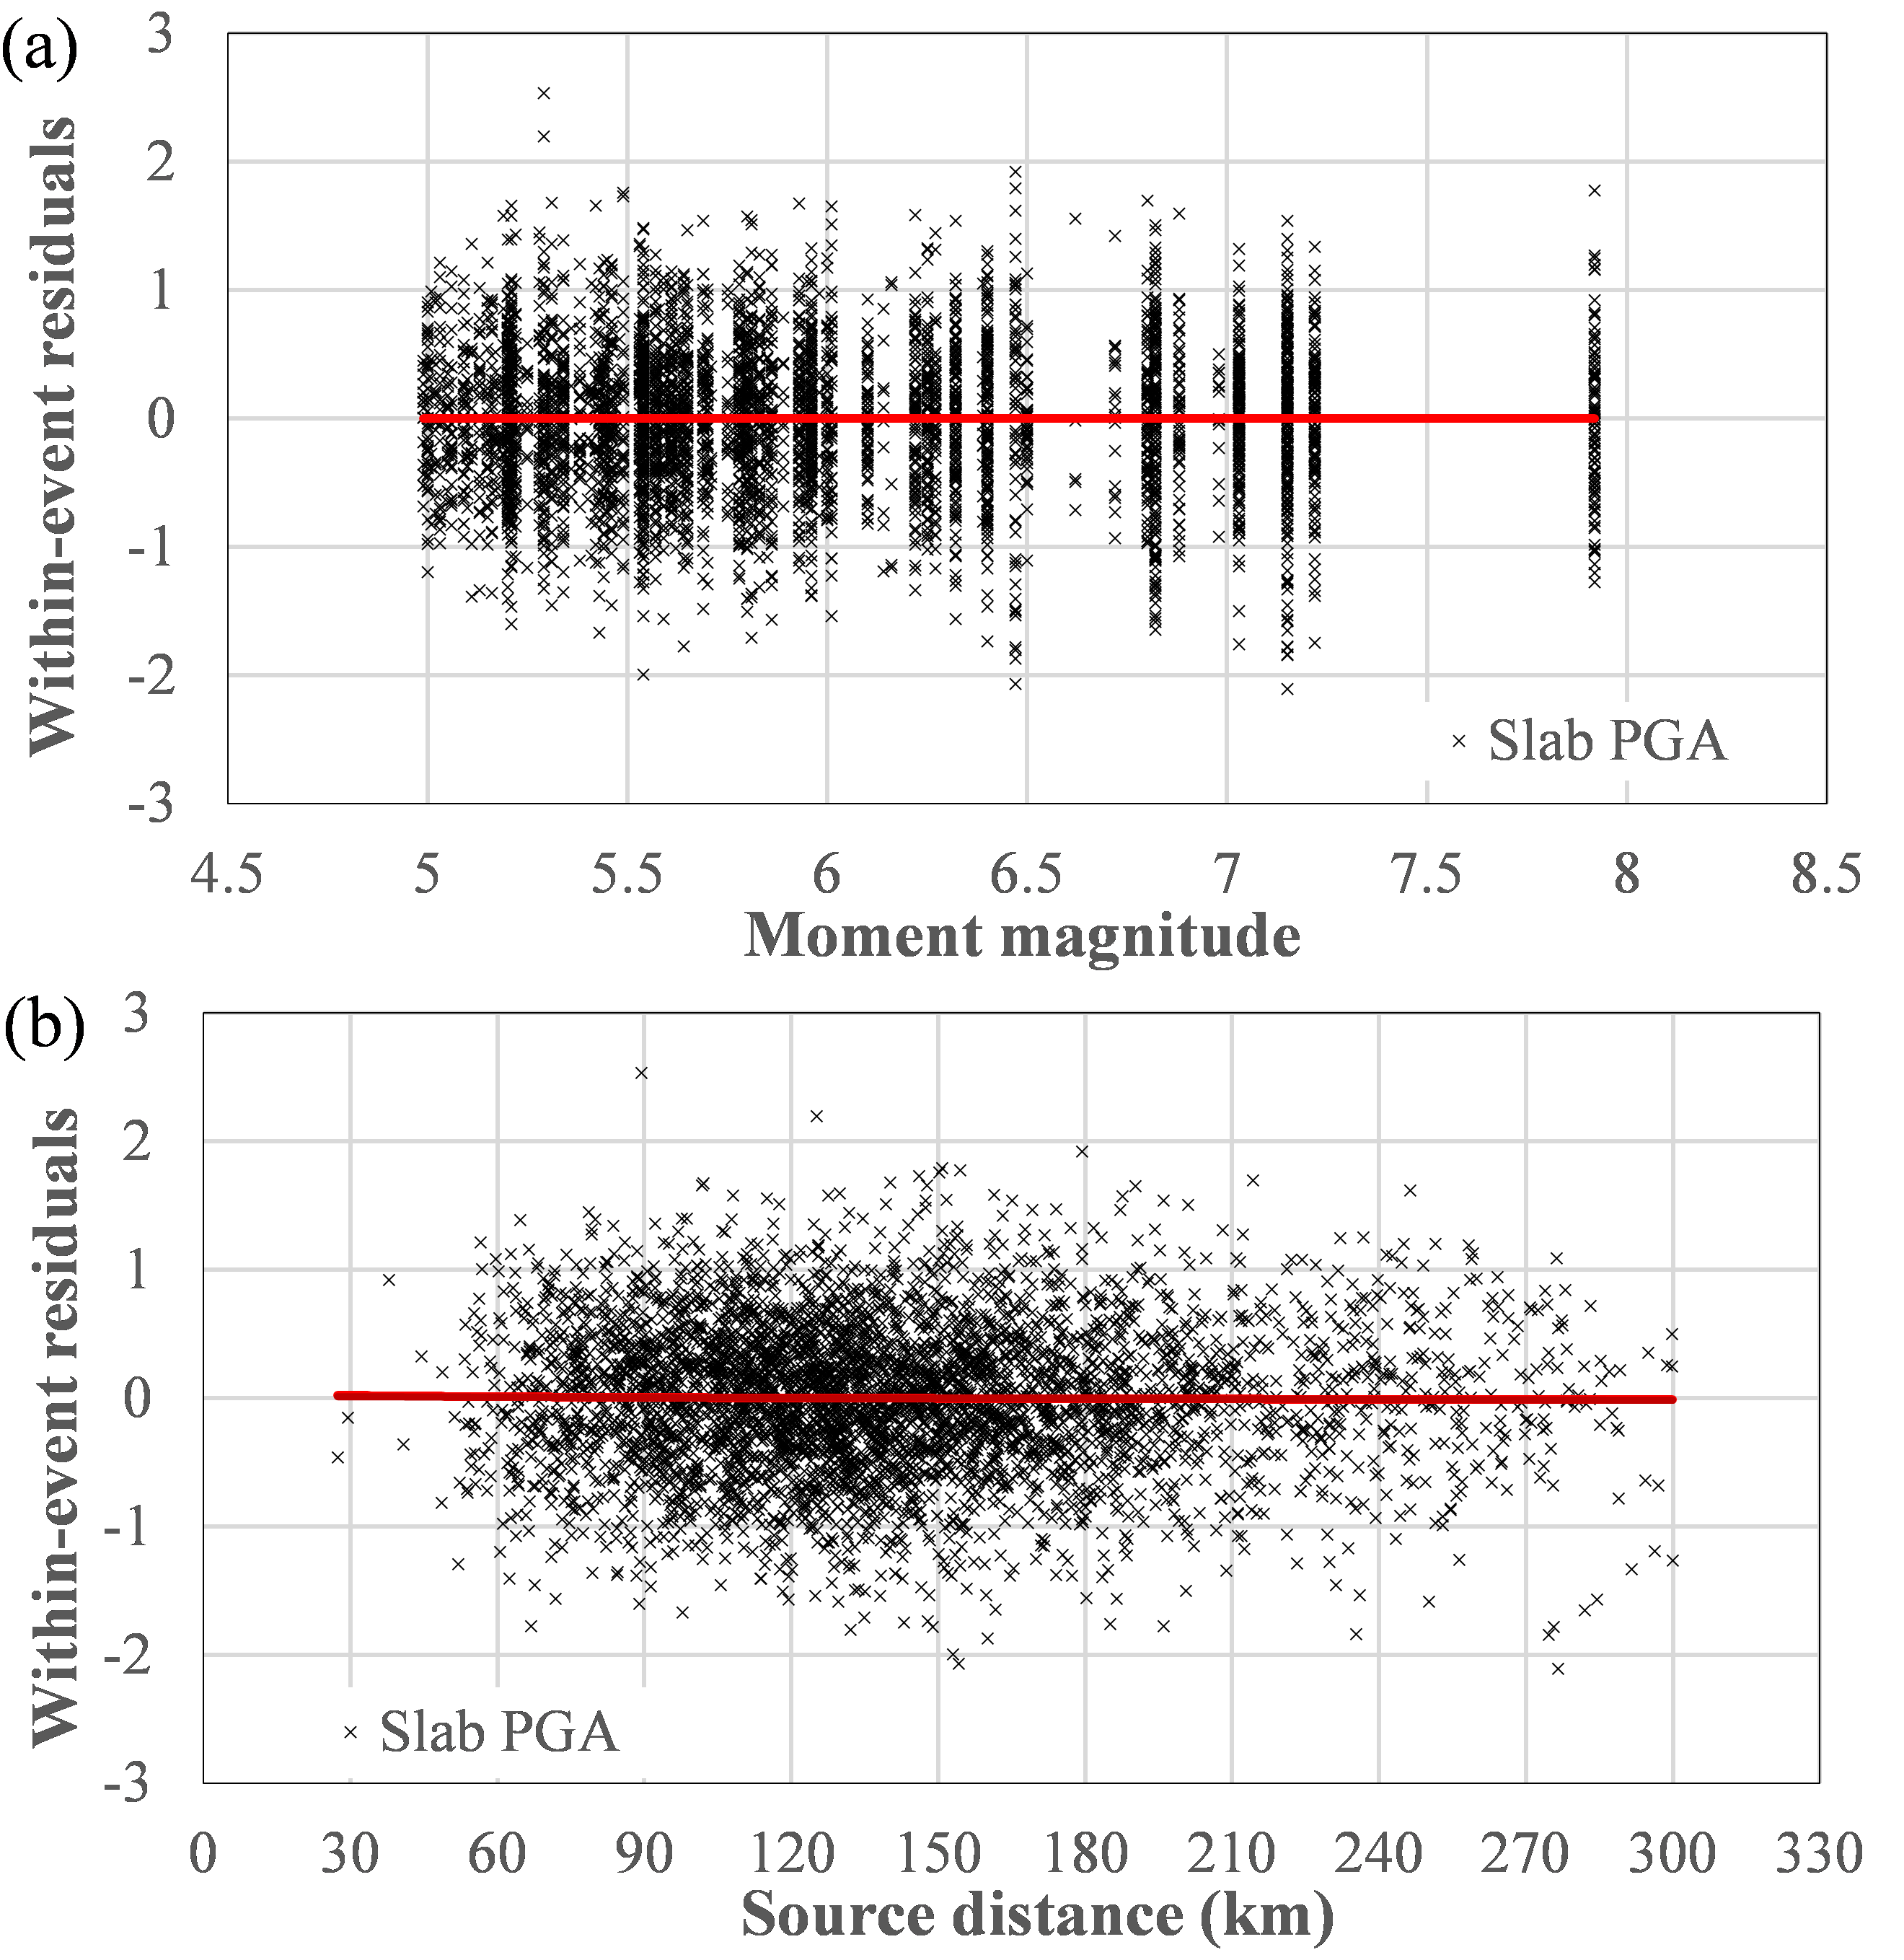
Figure S2. Distribution of within-event residuals for PGA with respect to (a) magnitude and (b) source distance.
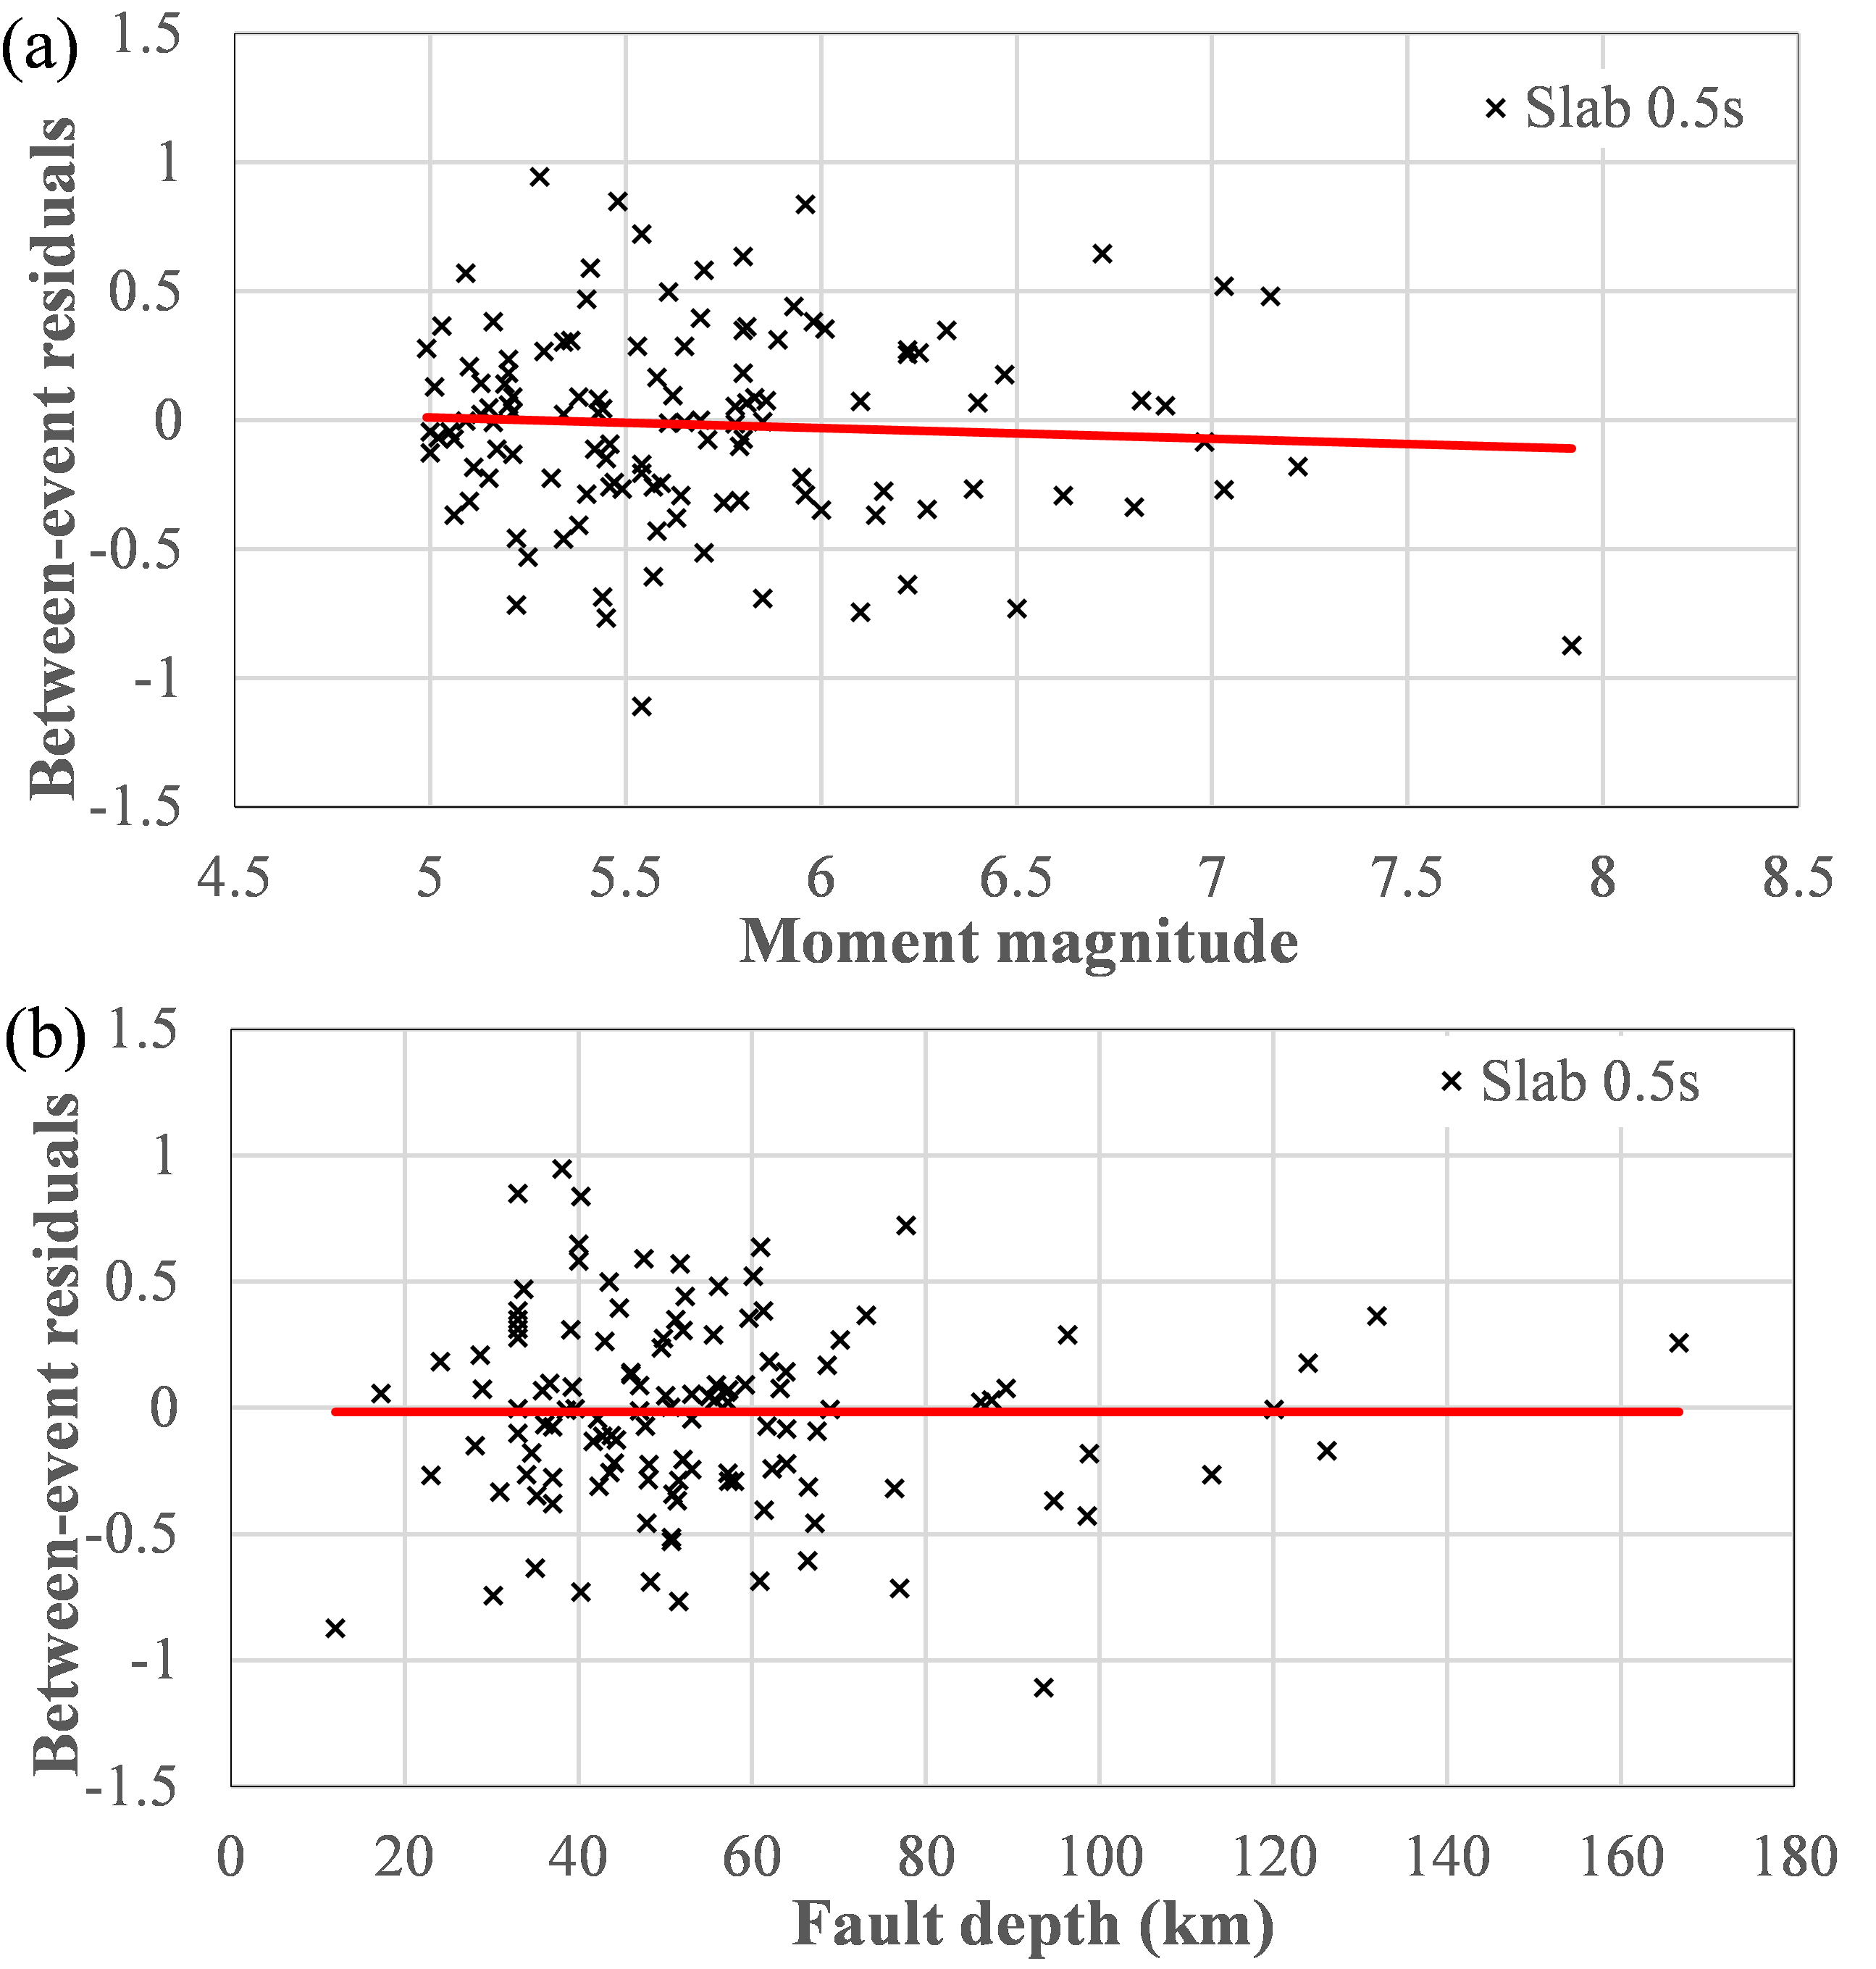
Figure S3. Distribution of between-event residuals for 0.5 s spectral acceleration with respect to (a) magnitude and (b) fault depth.
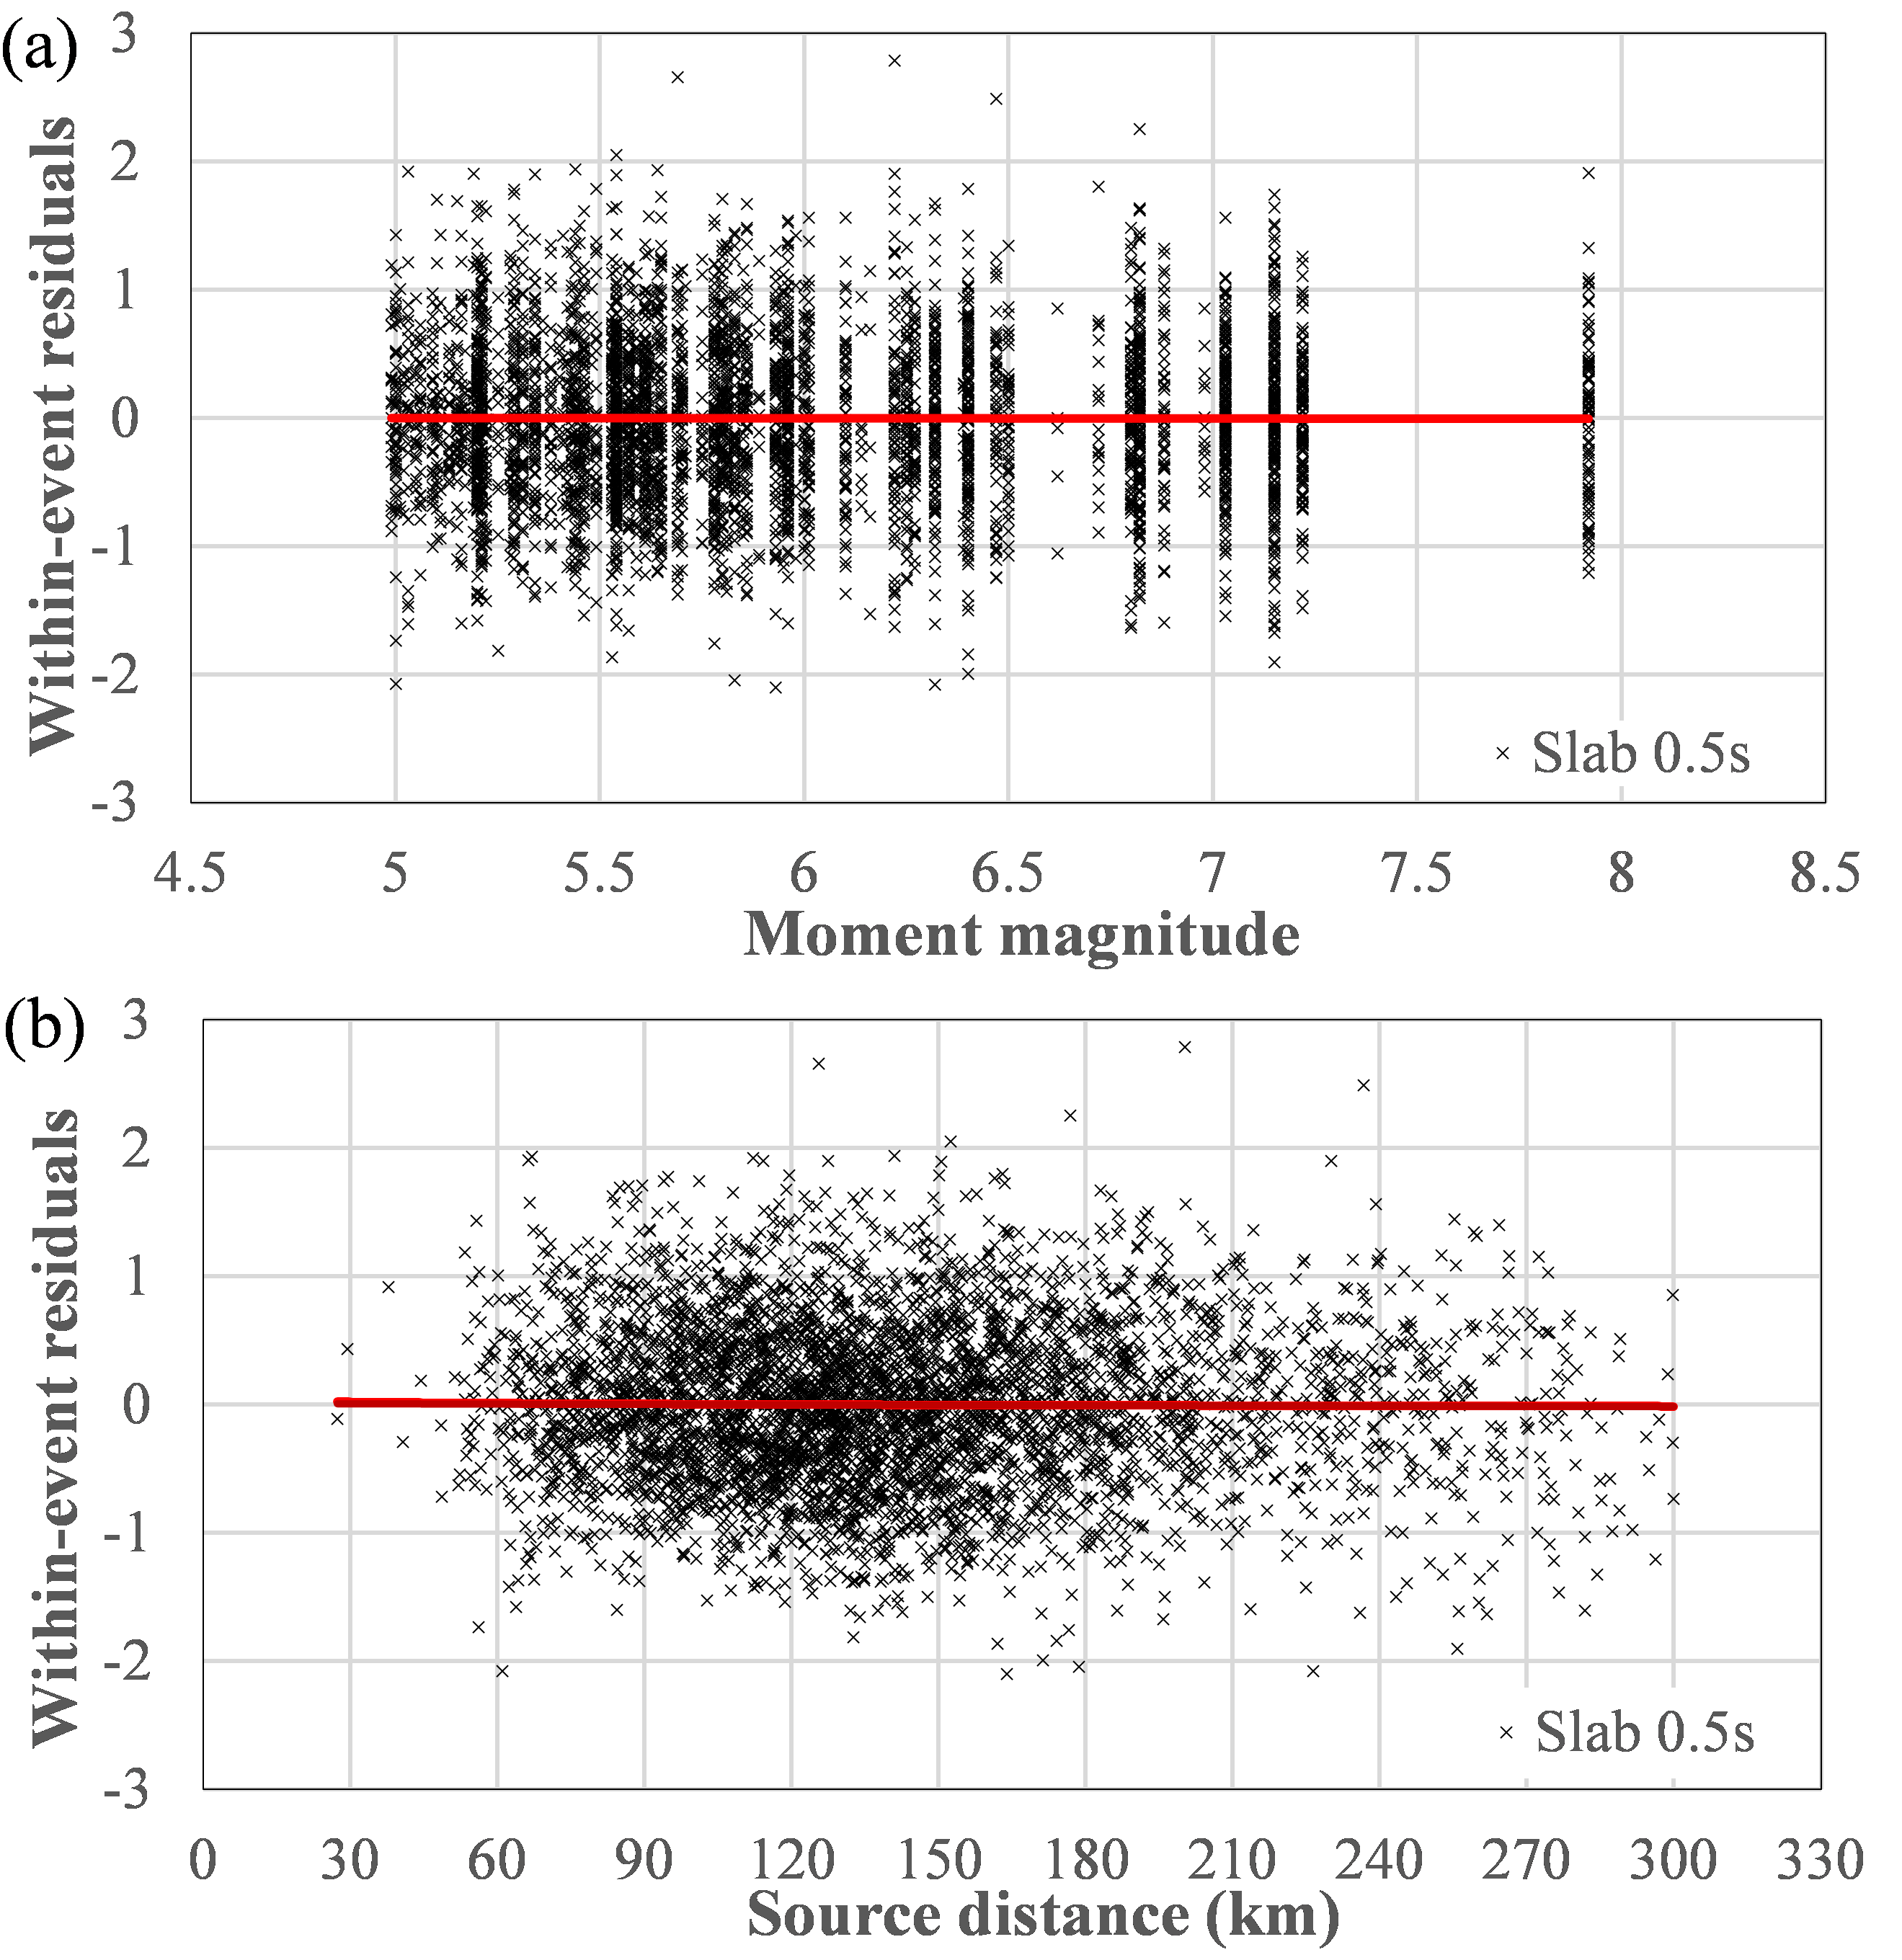
Figure S4. Distribution of within-event residuals for 0.5 s spectral period with respect to (a) magnitude and (b) source distance.
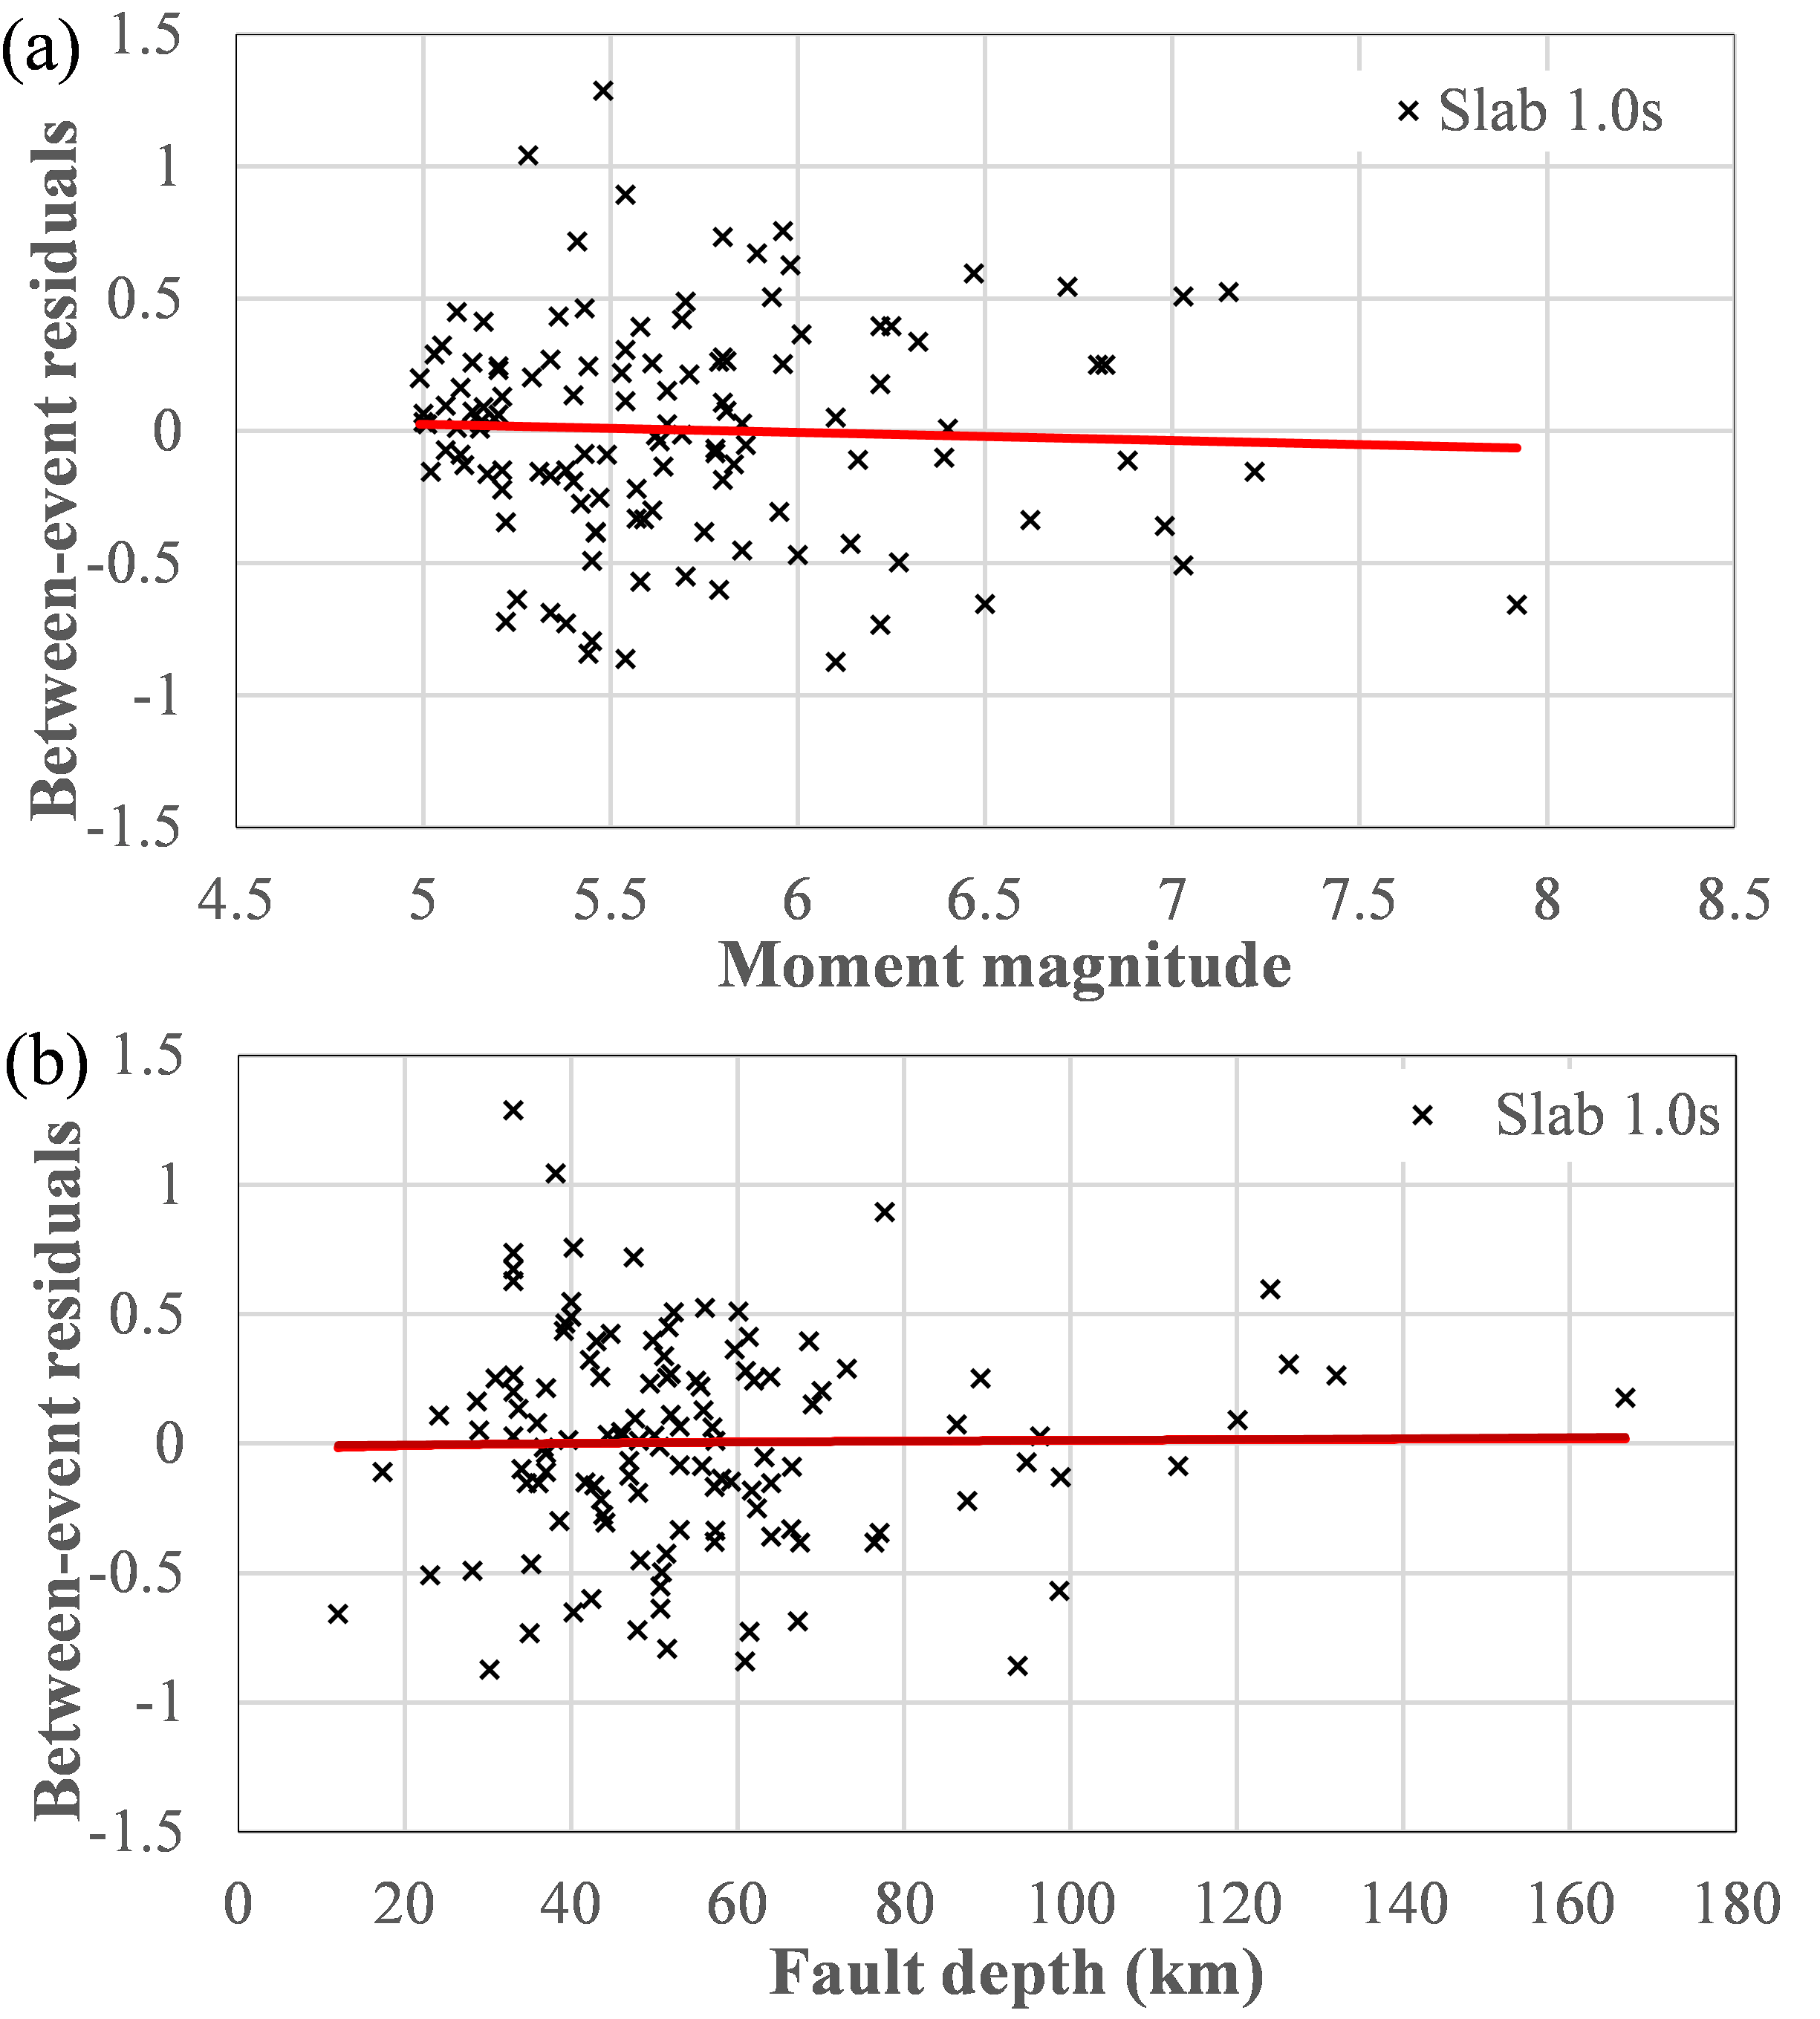
Figure S5. Distribution of between-event residuals for 1.0 s spectral period with respect to (a) magnitude and (b) fault depth.
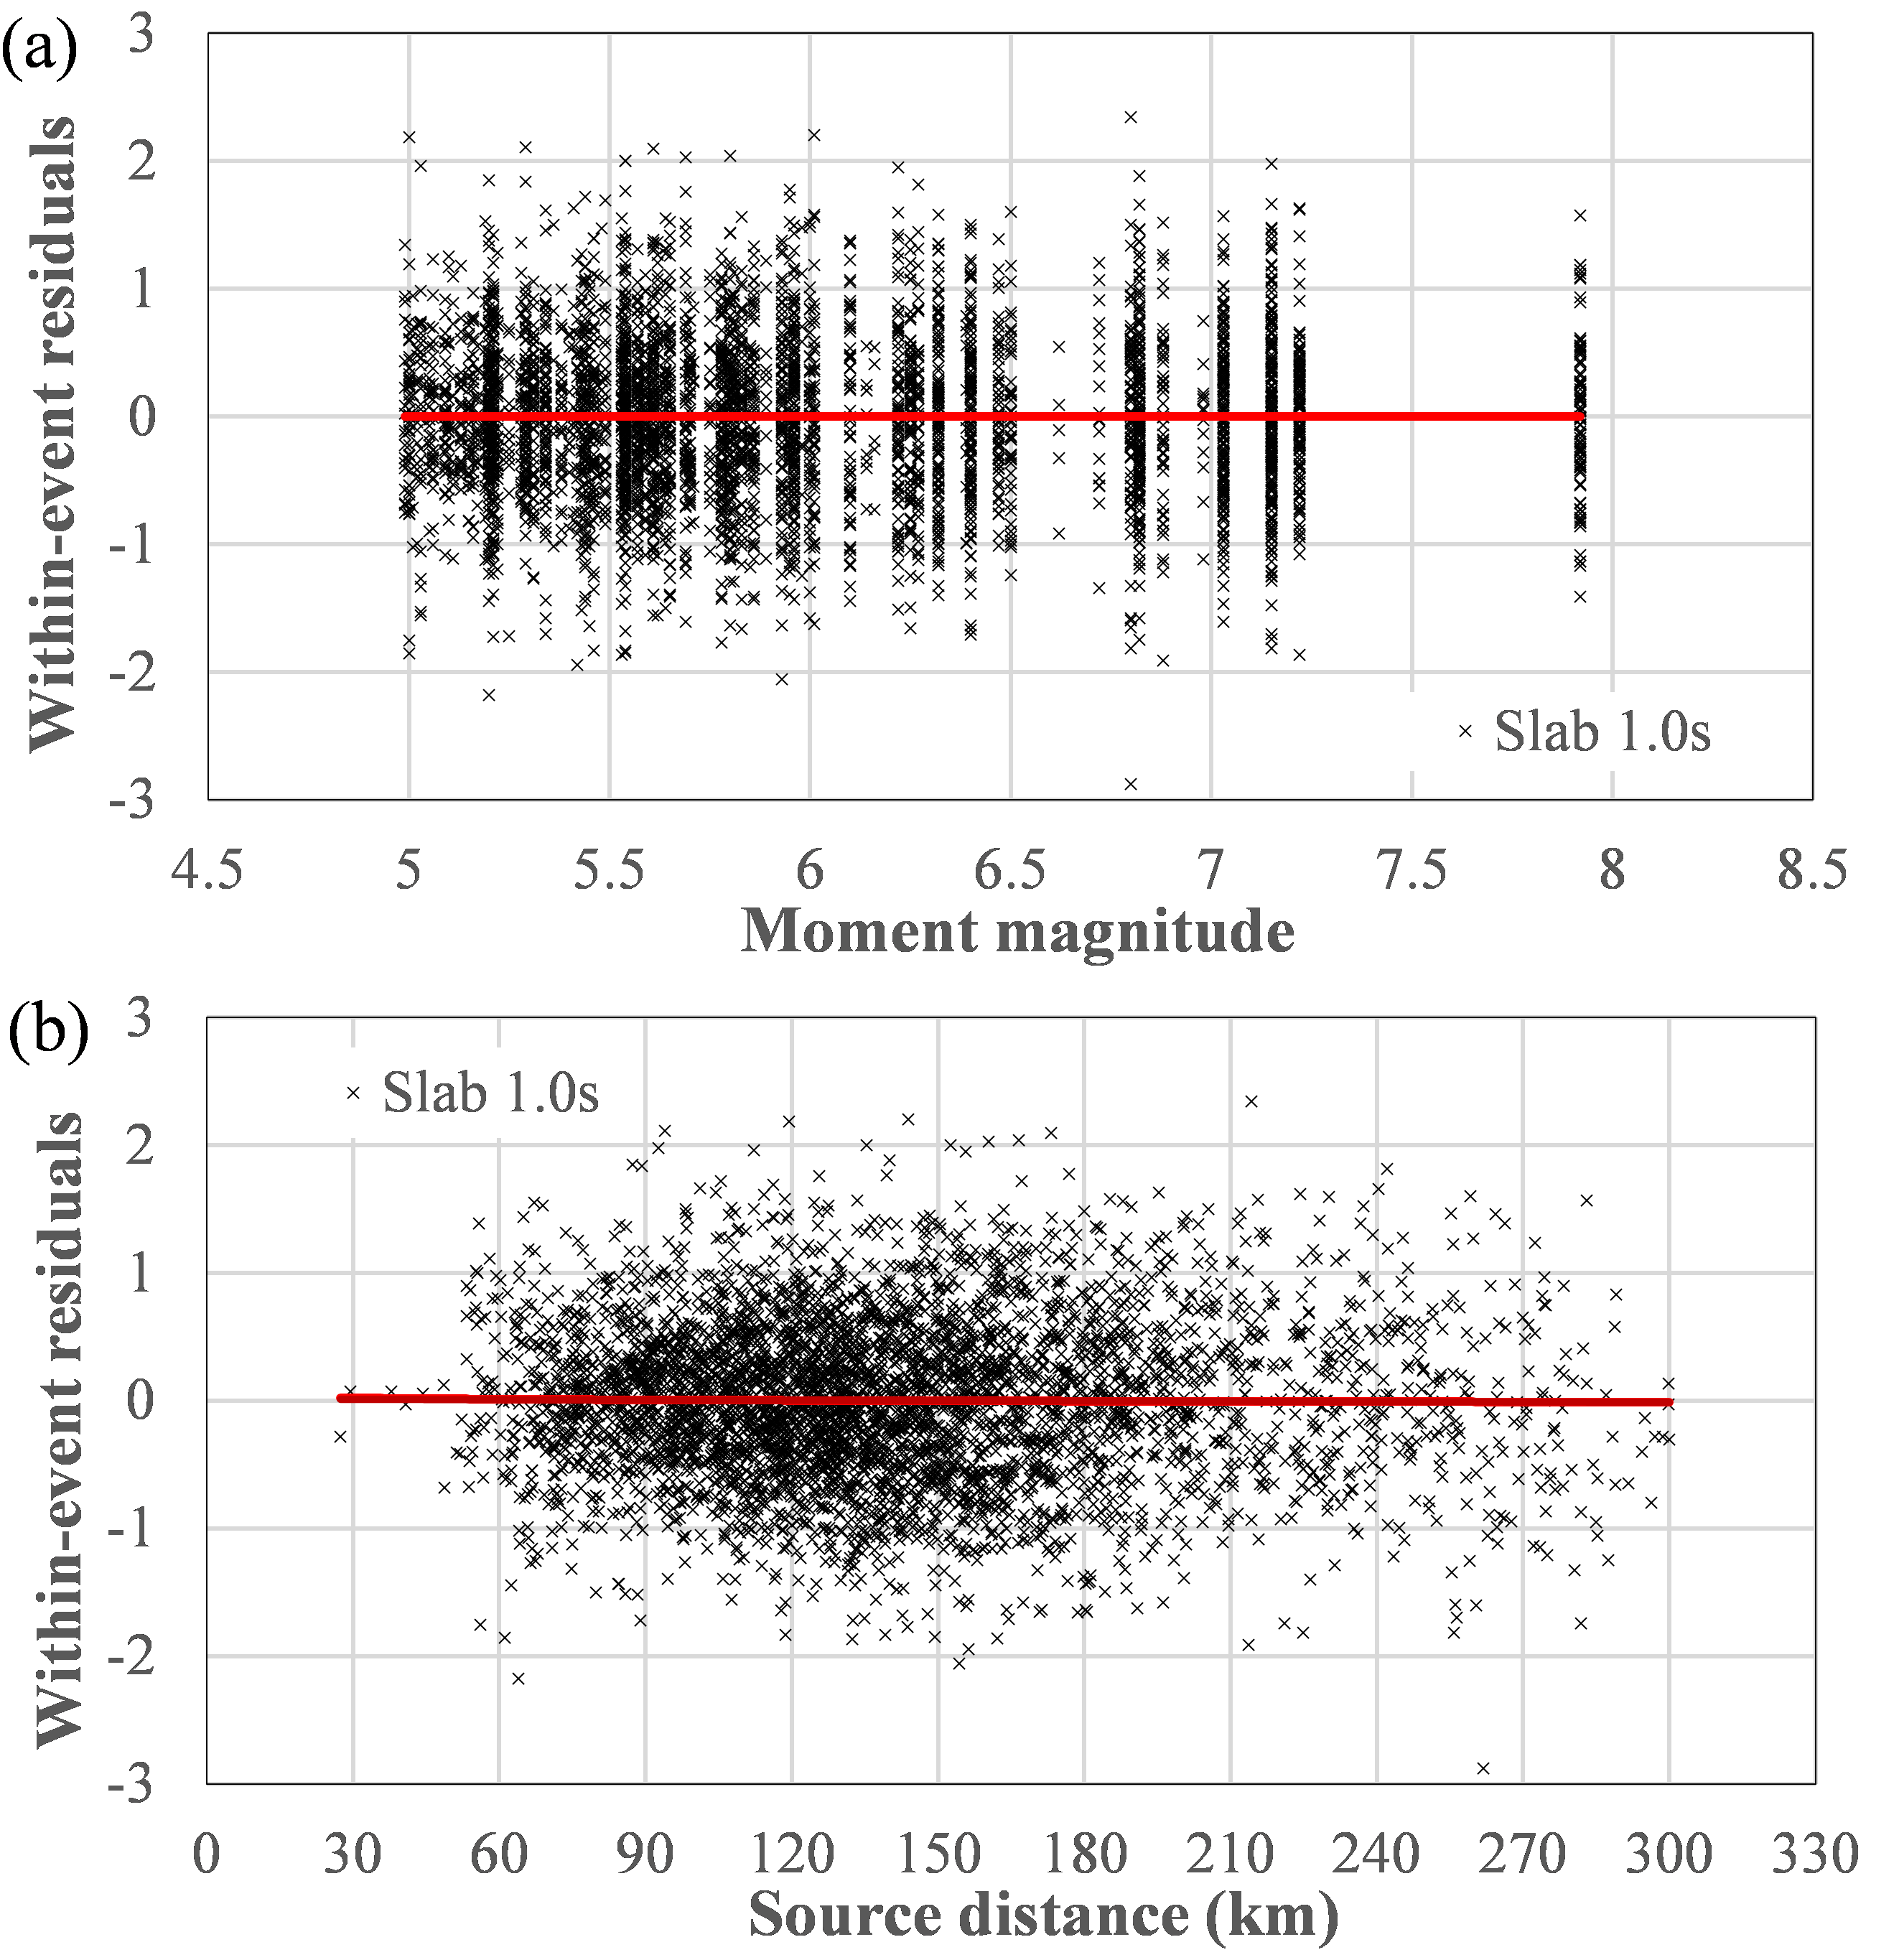
Figure S6. Distribution of within-event residuals for 1.0 s spectral period with respect to (a) magnitude and (b) source distance.
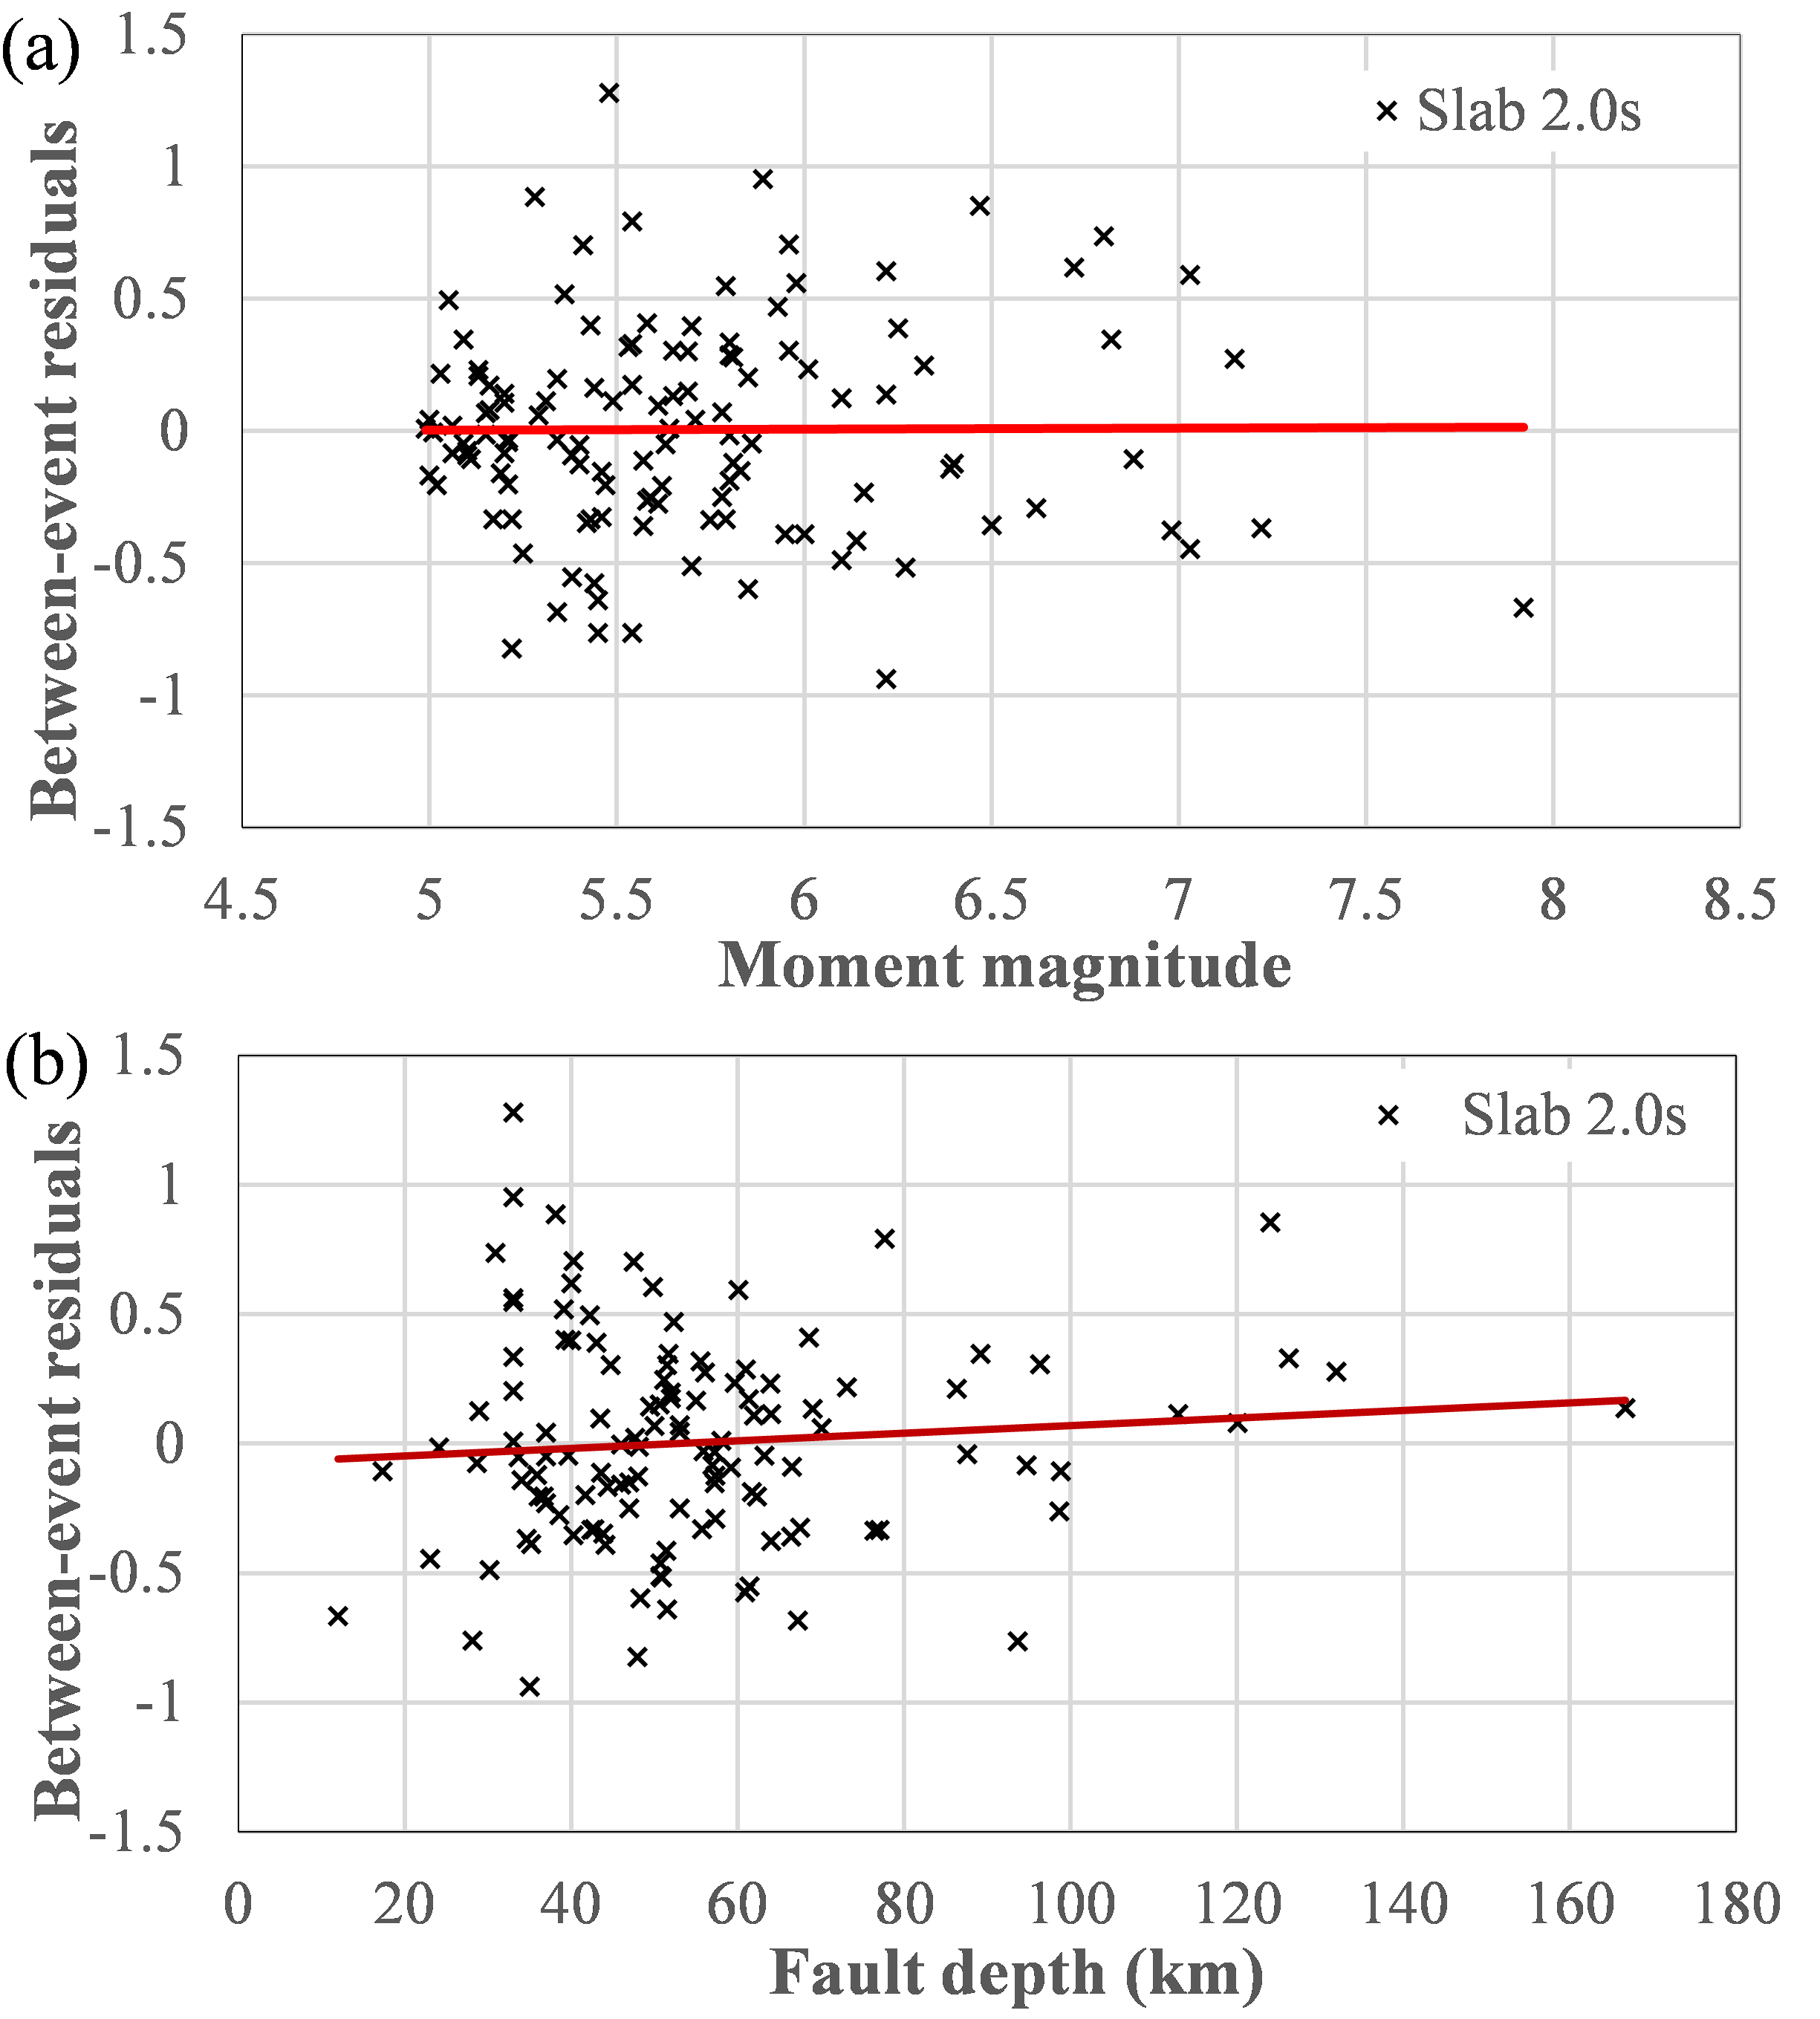
Figure S7. Distribution of between-event residuals for 2.0 s spectral periods with respect to (a) magnitude and (b) fault depth.
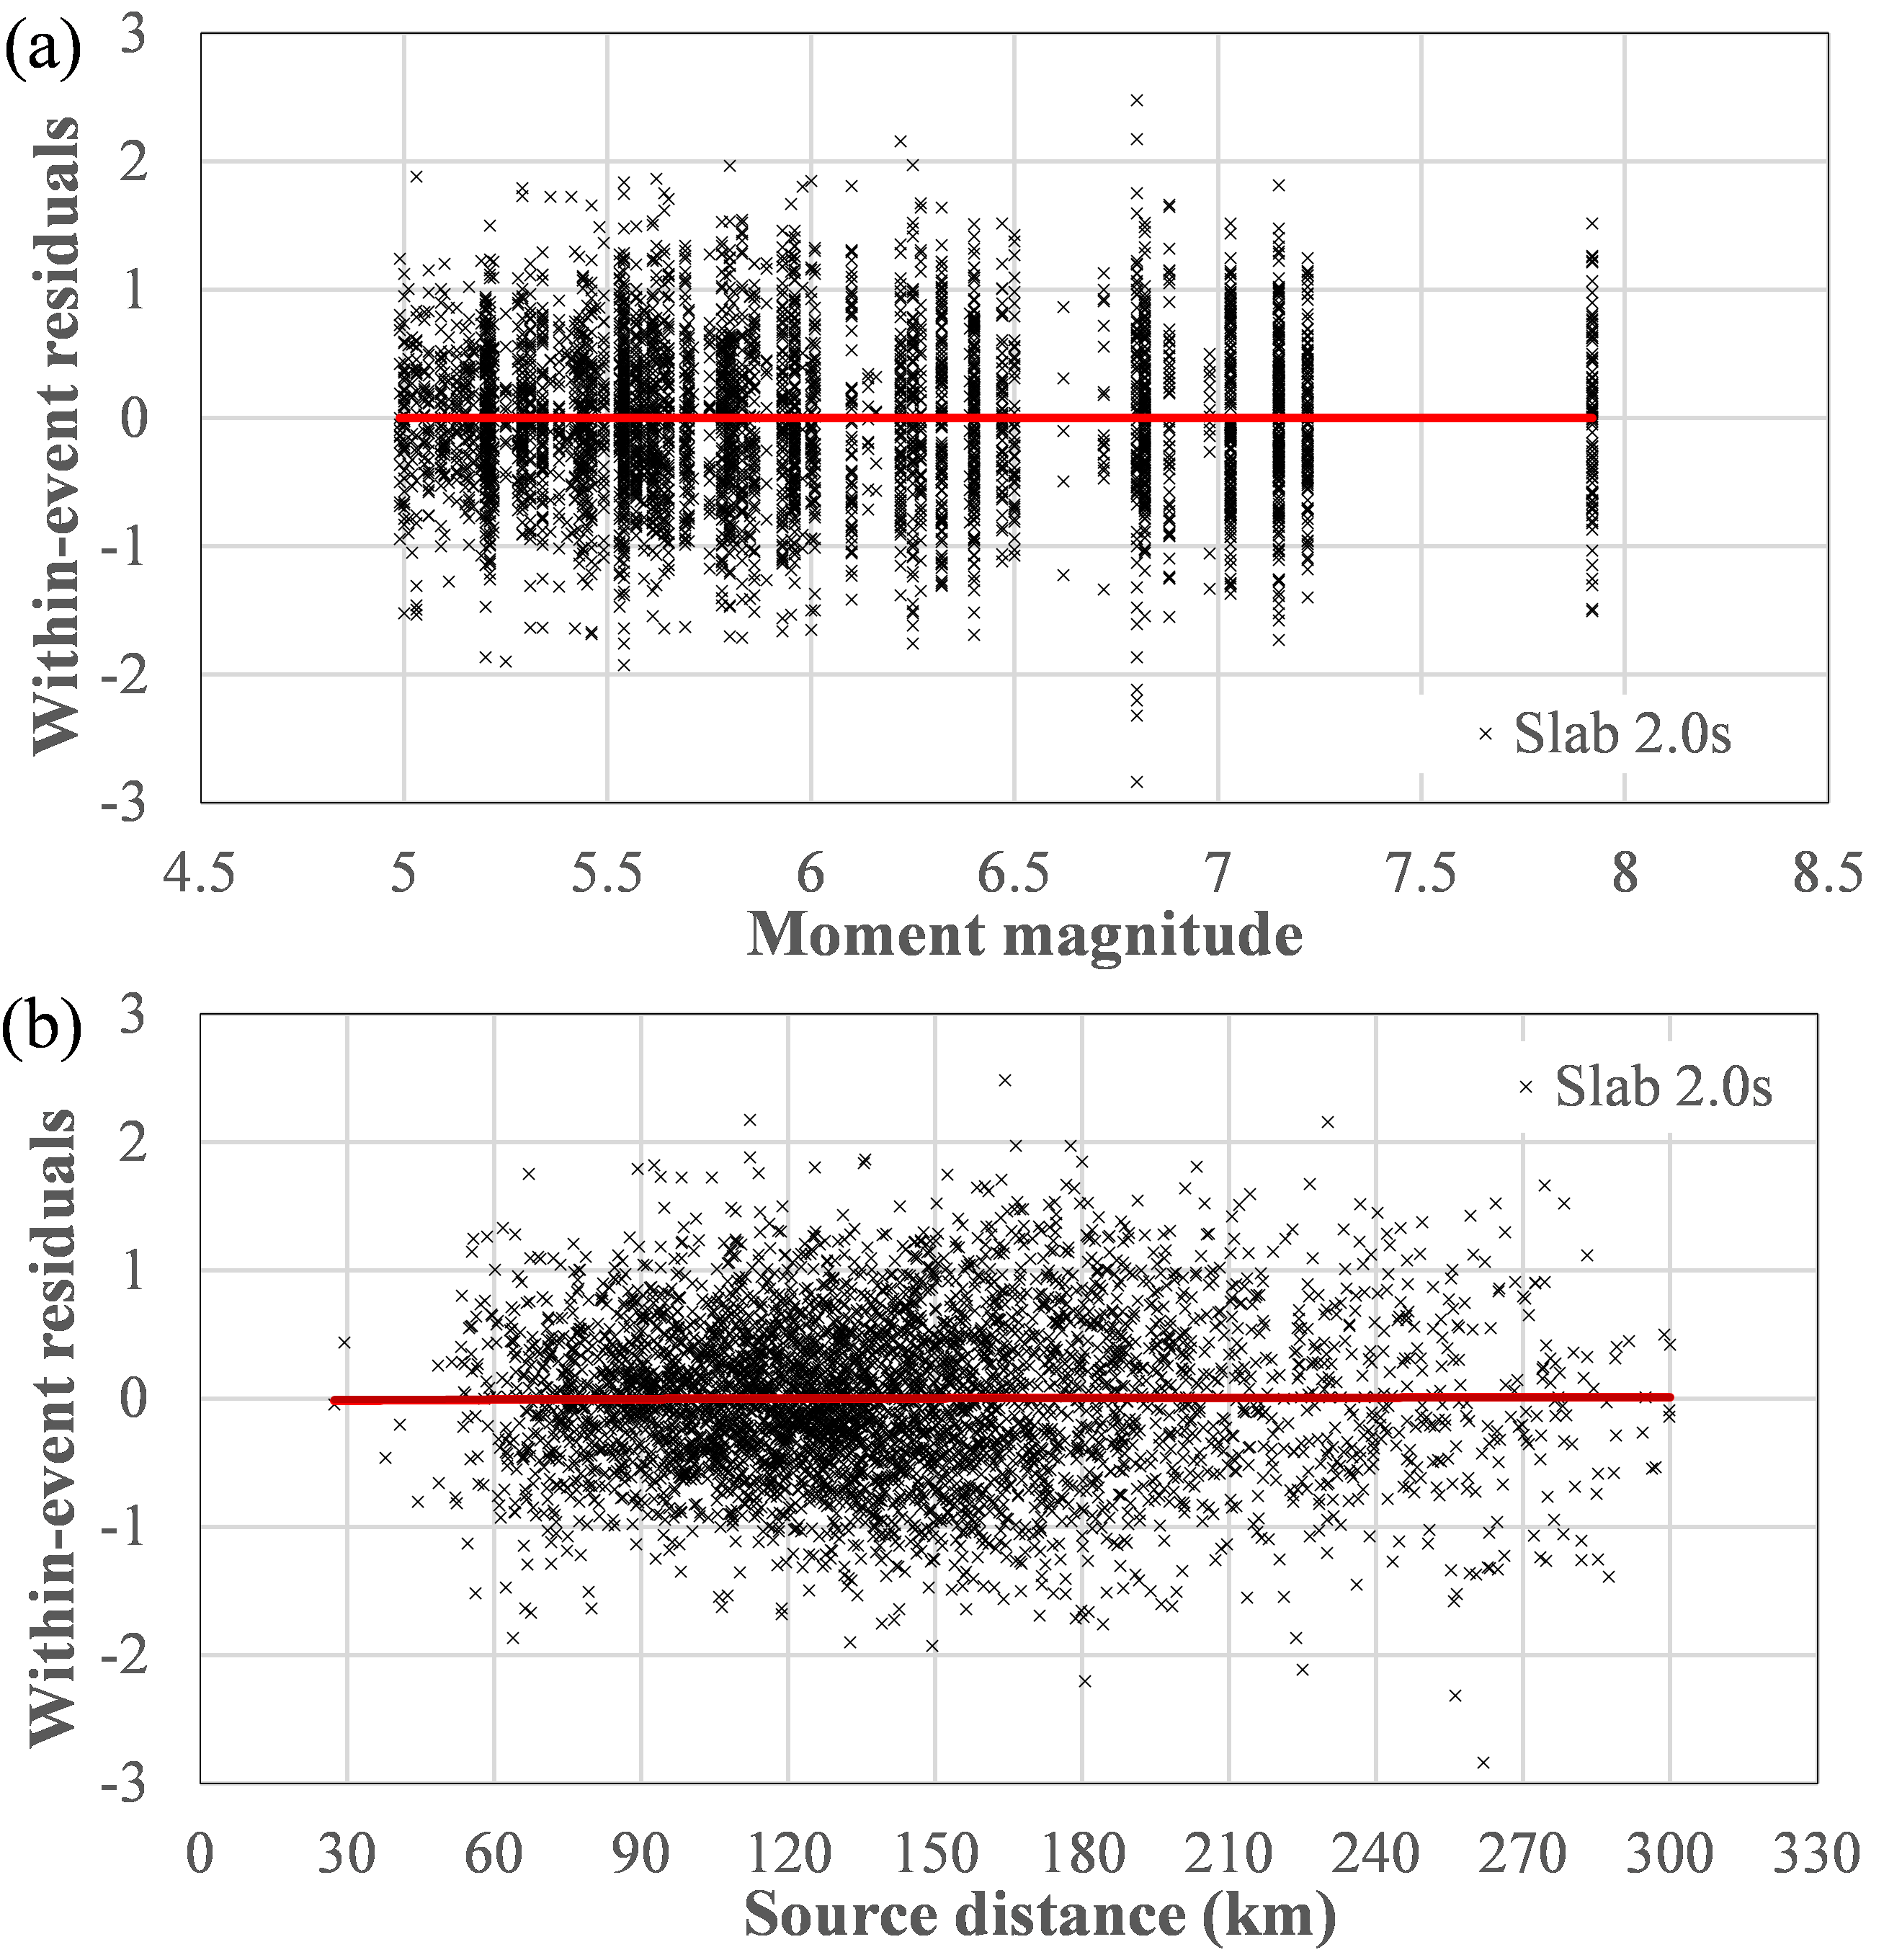
Figure S8. Distribution of within-event residuals for 2.0 s spectral periods, with respect to (a) magnitude and (b) source distance.
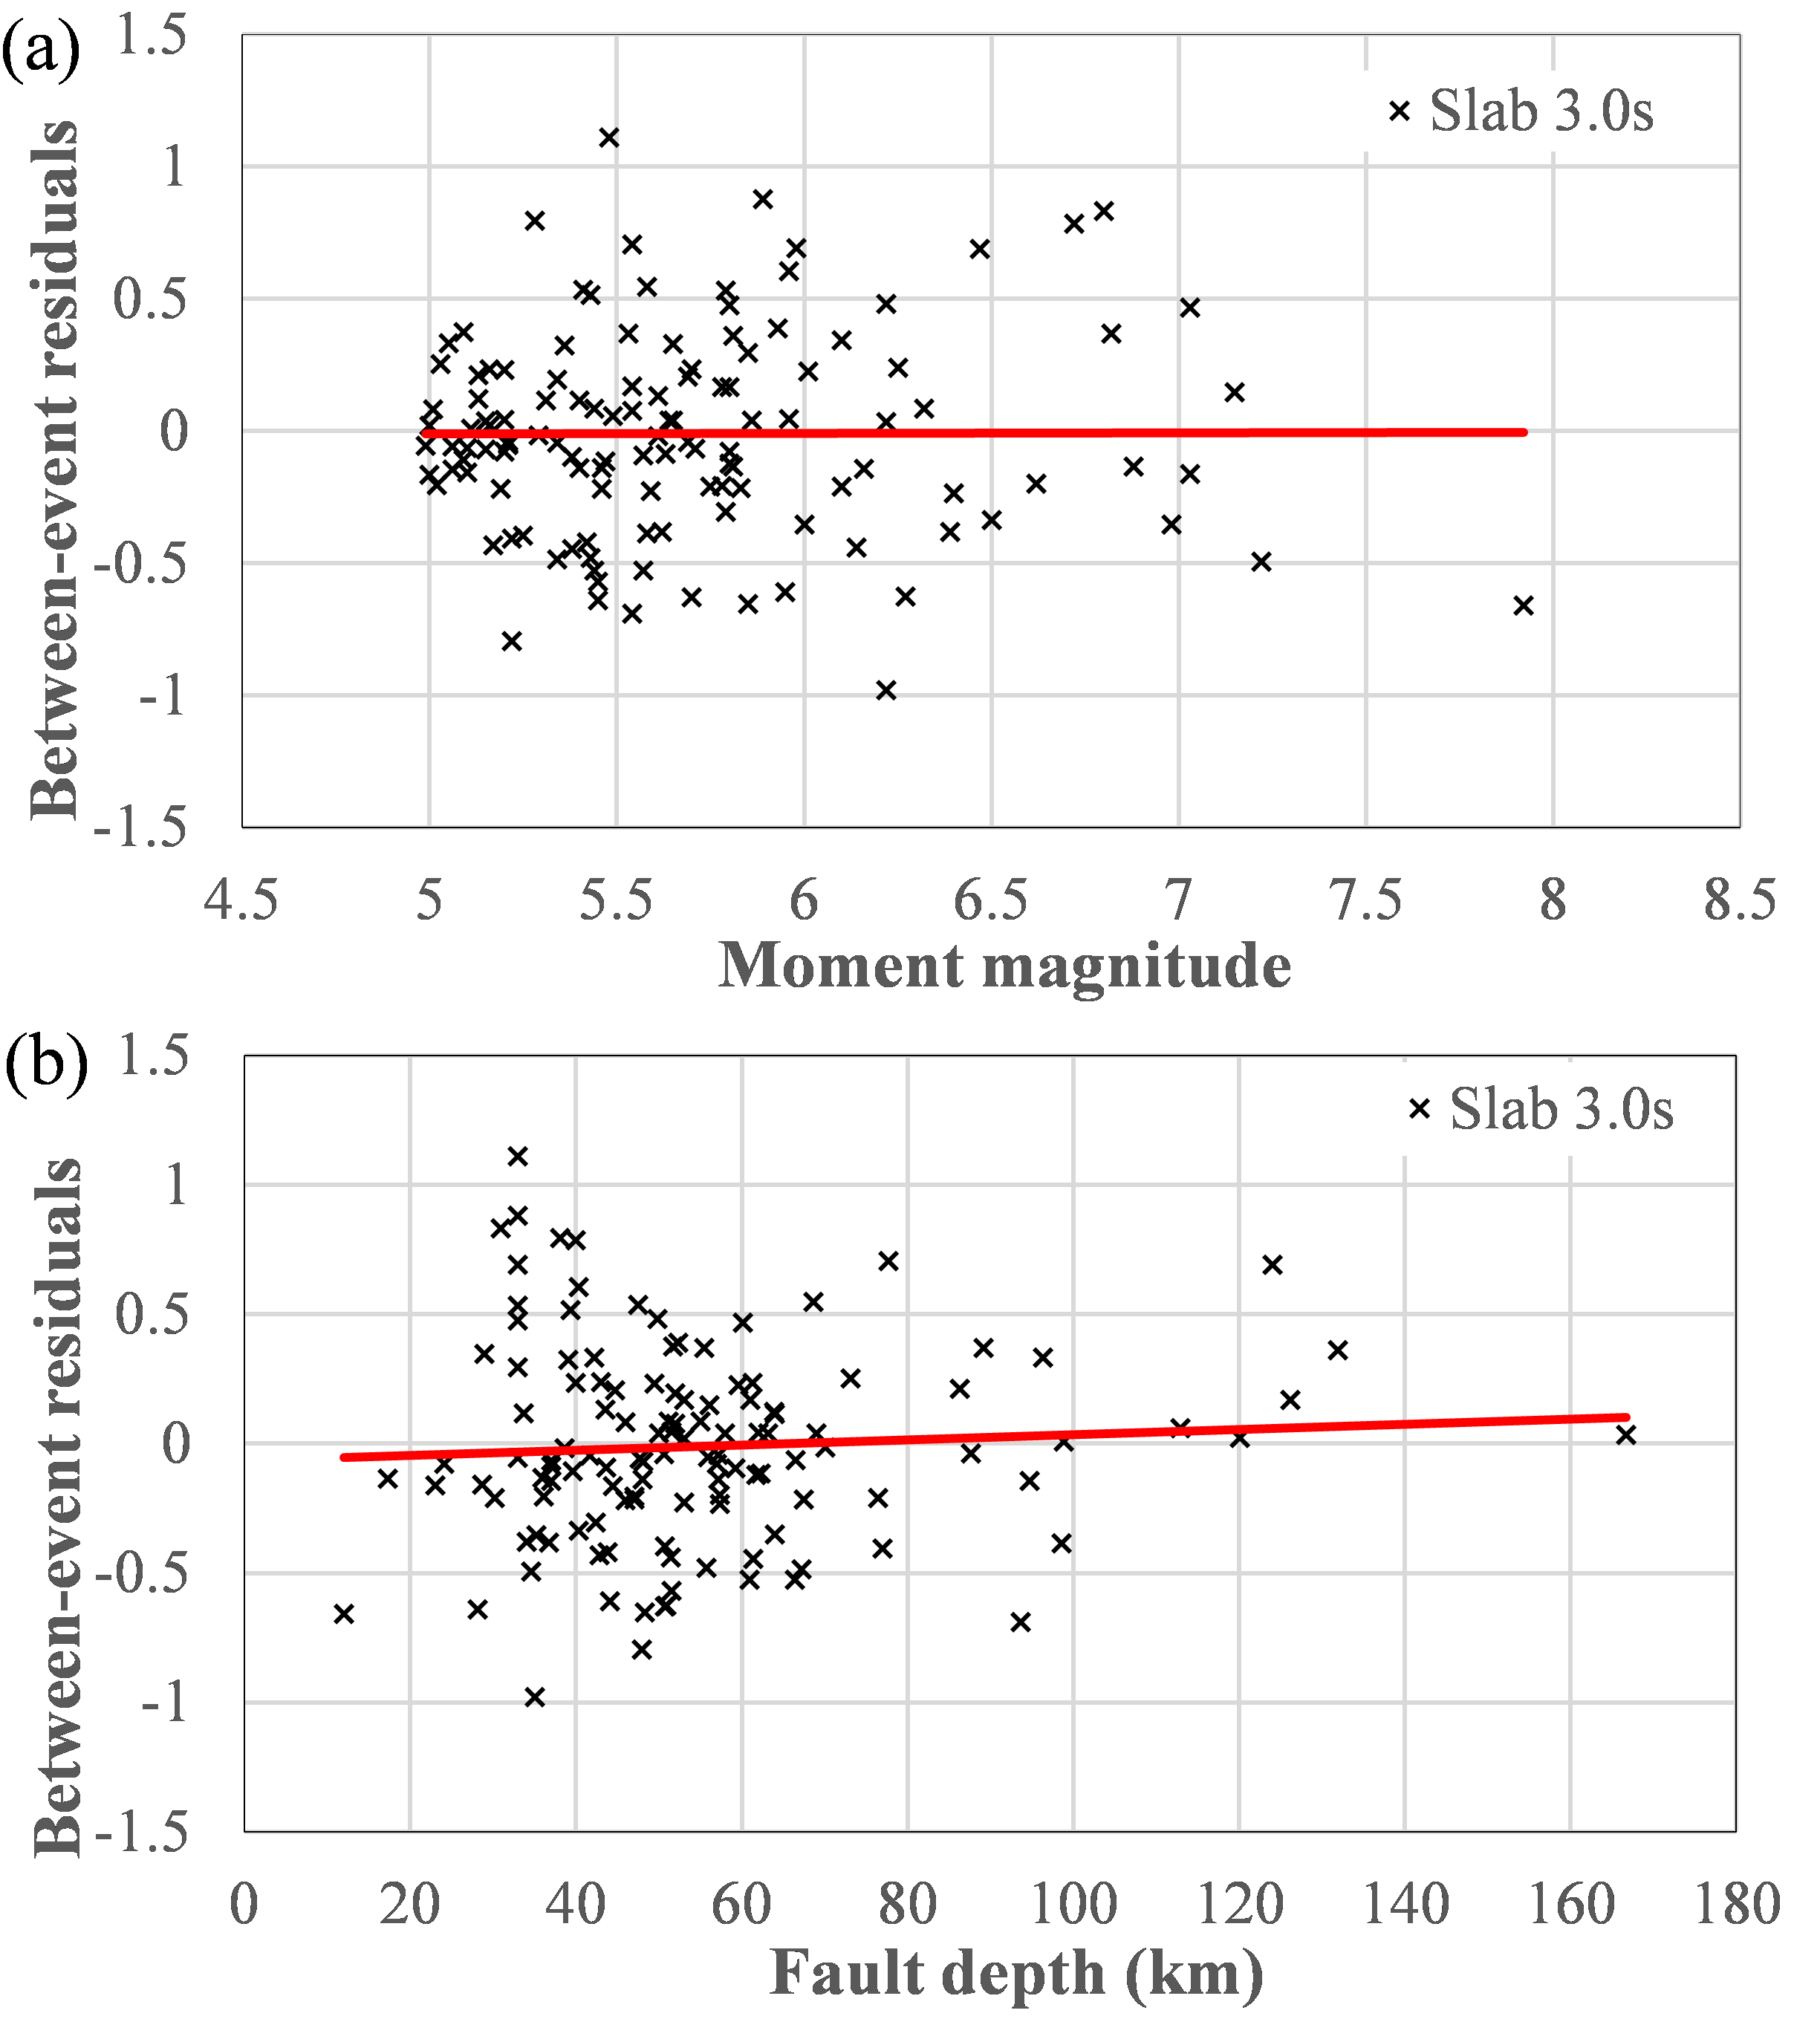
Figure S9. Distribution of between-event residuals for 3.0 s spectral periods with respect to (a) magnitude and (b) fault depth.
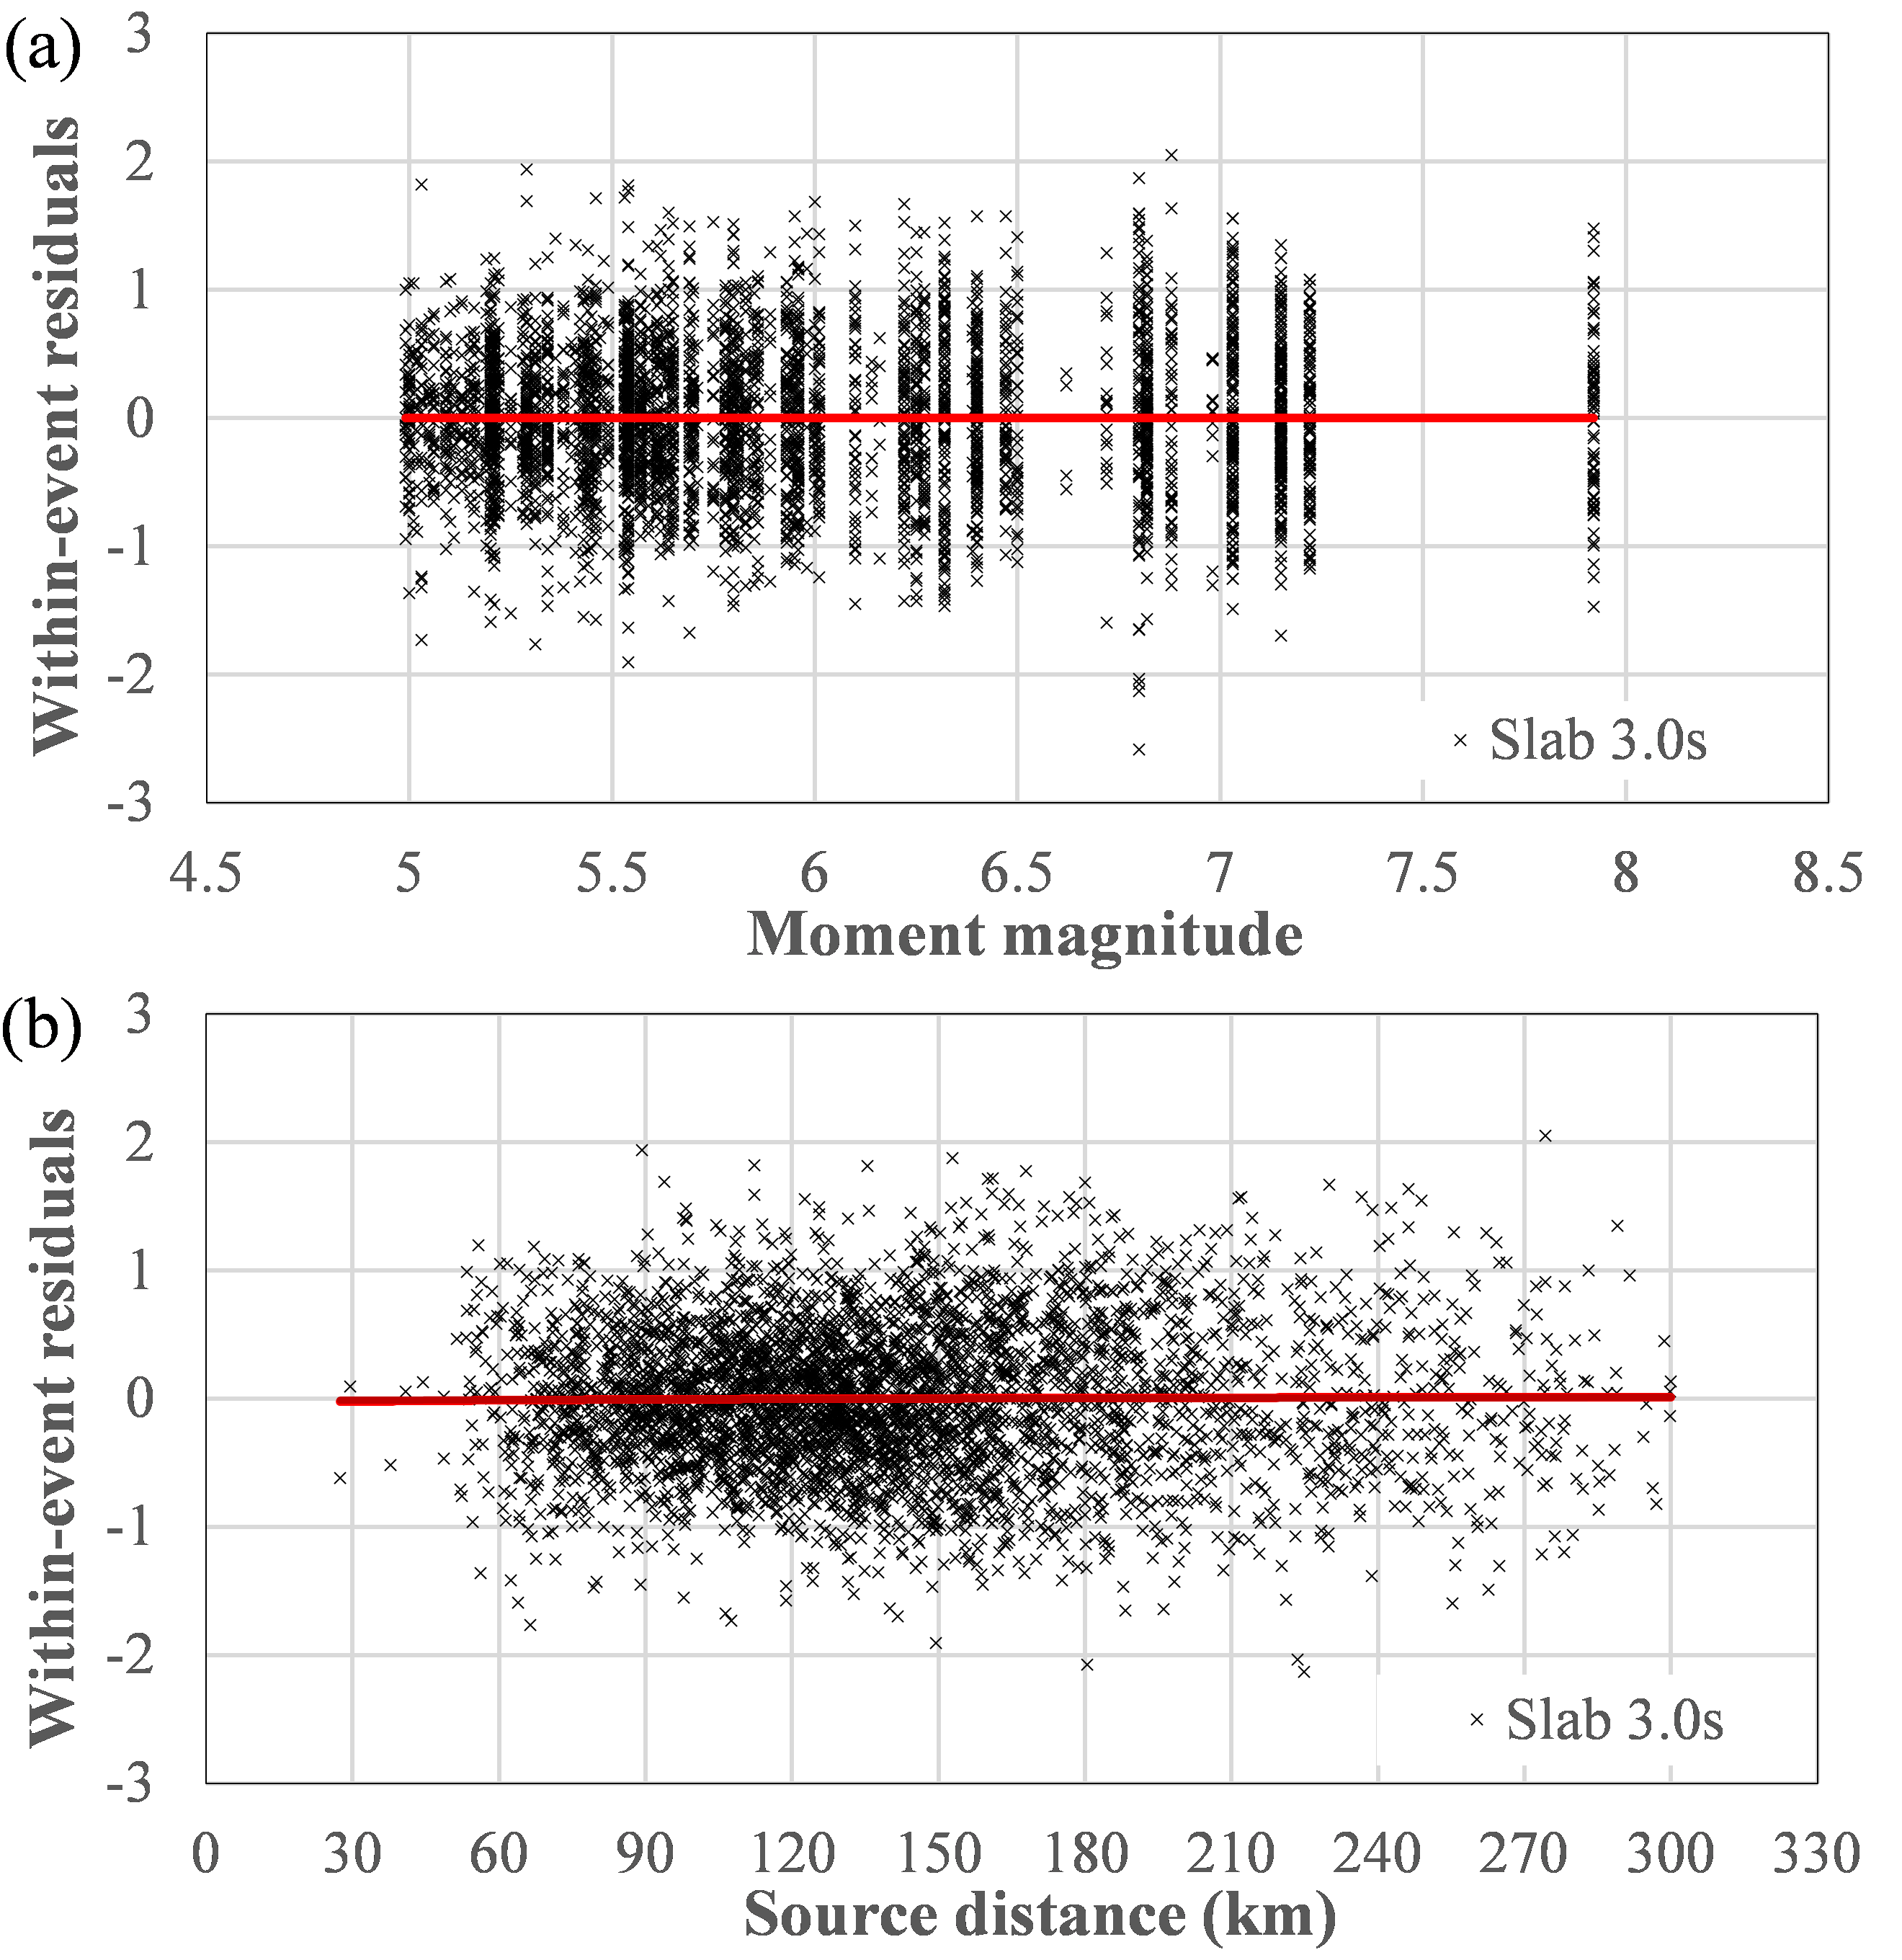
Figure S10. Distribution of within-event residuals for 3.0 s spectral periods with respect to (a) magnitude and (b) source distance.
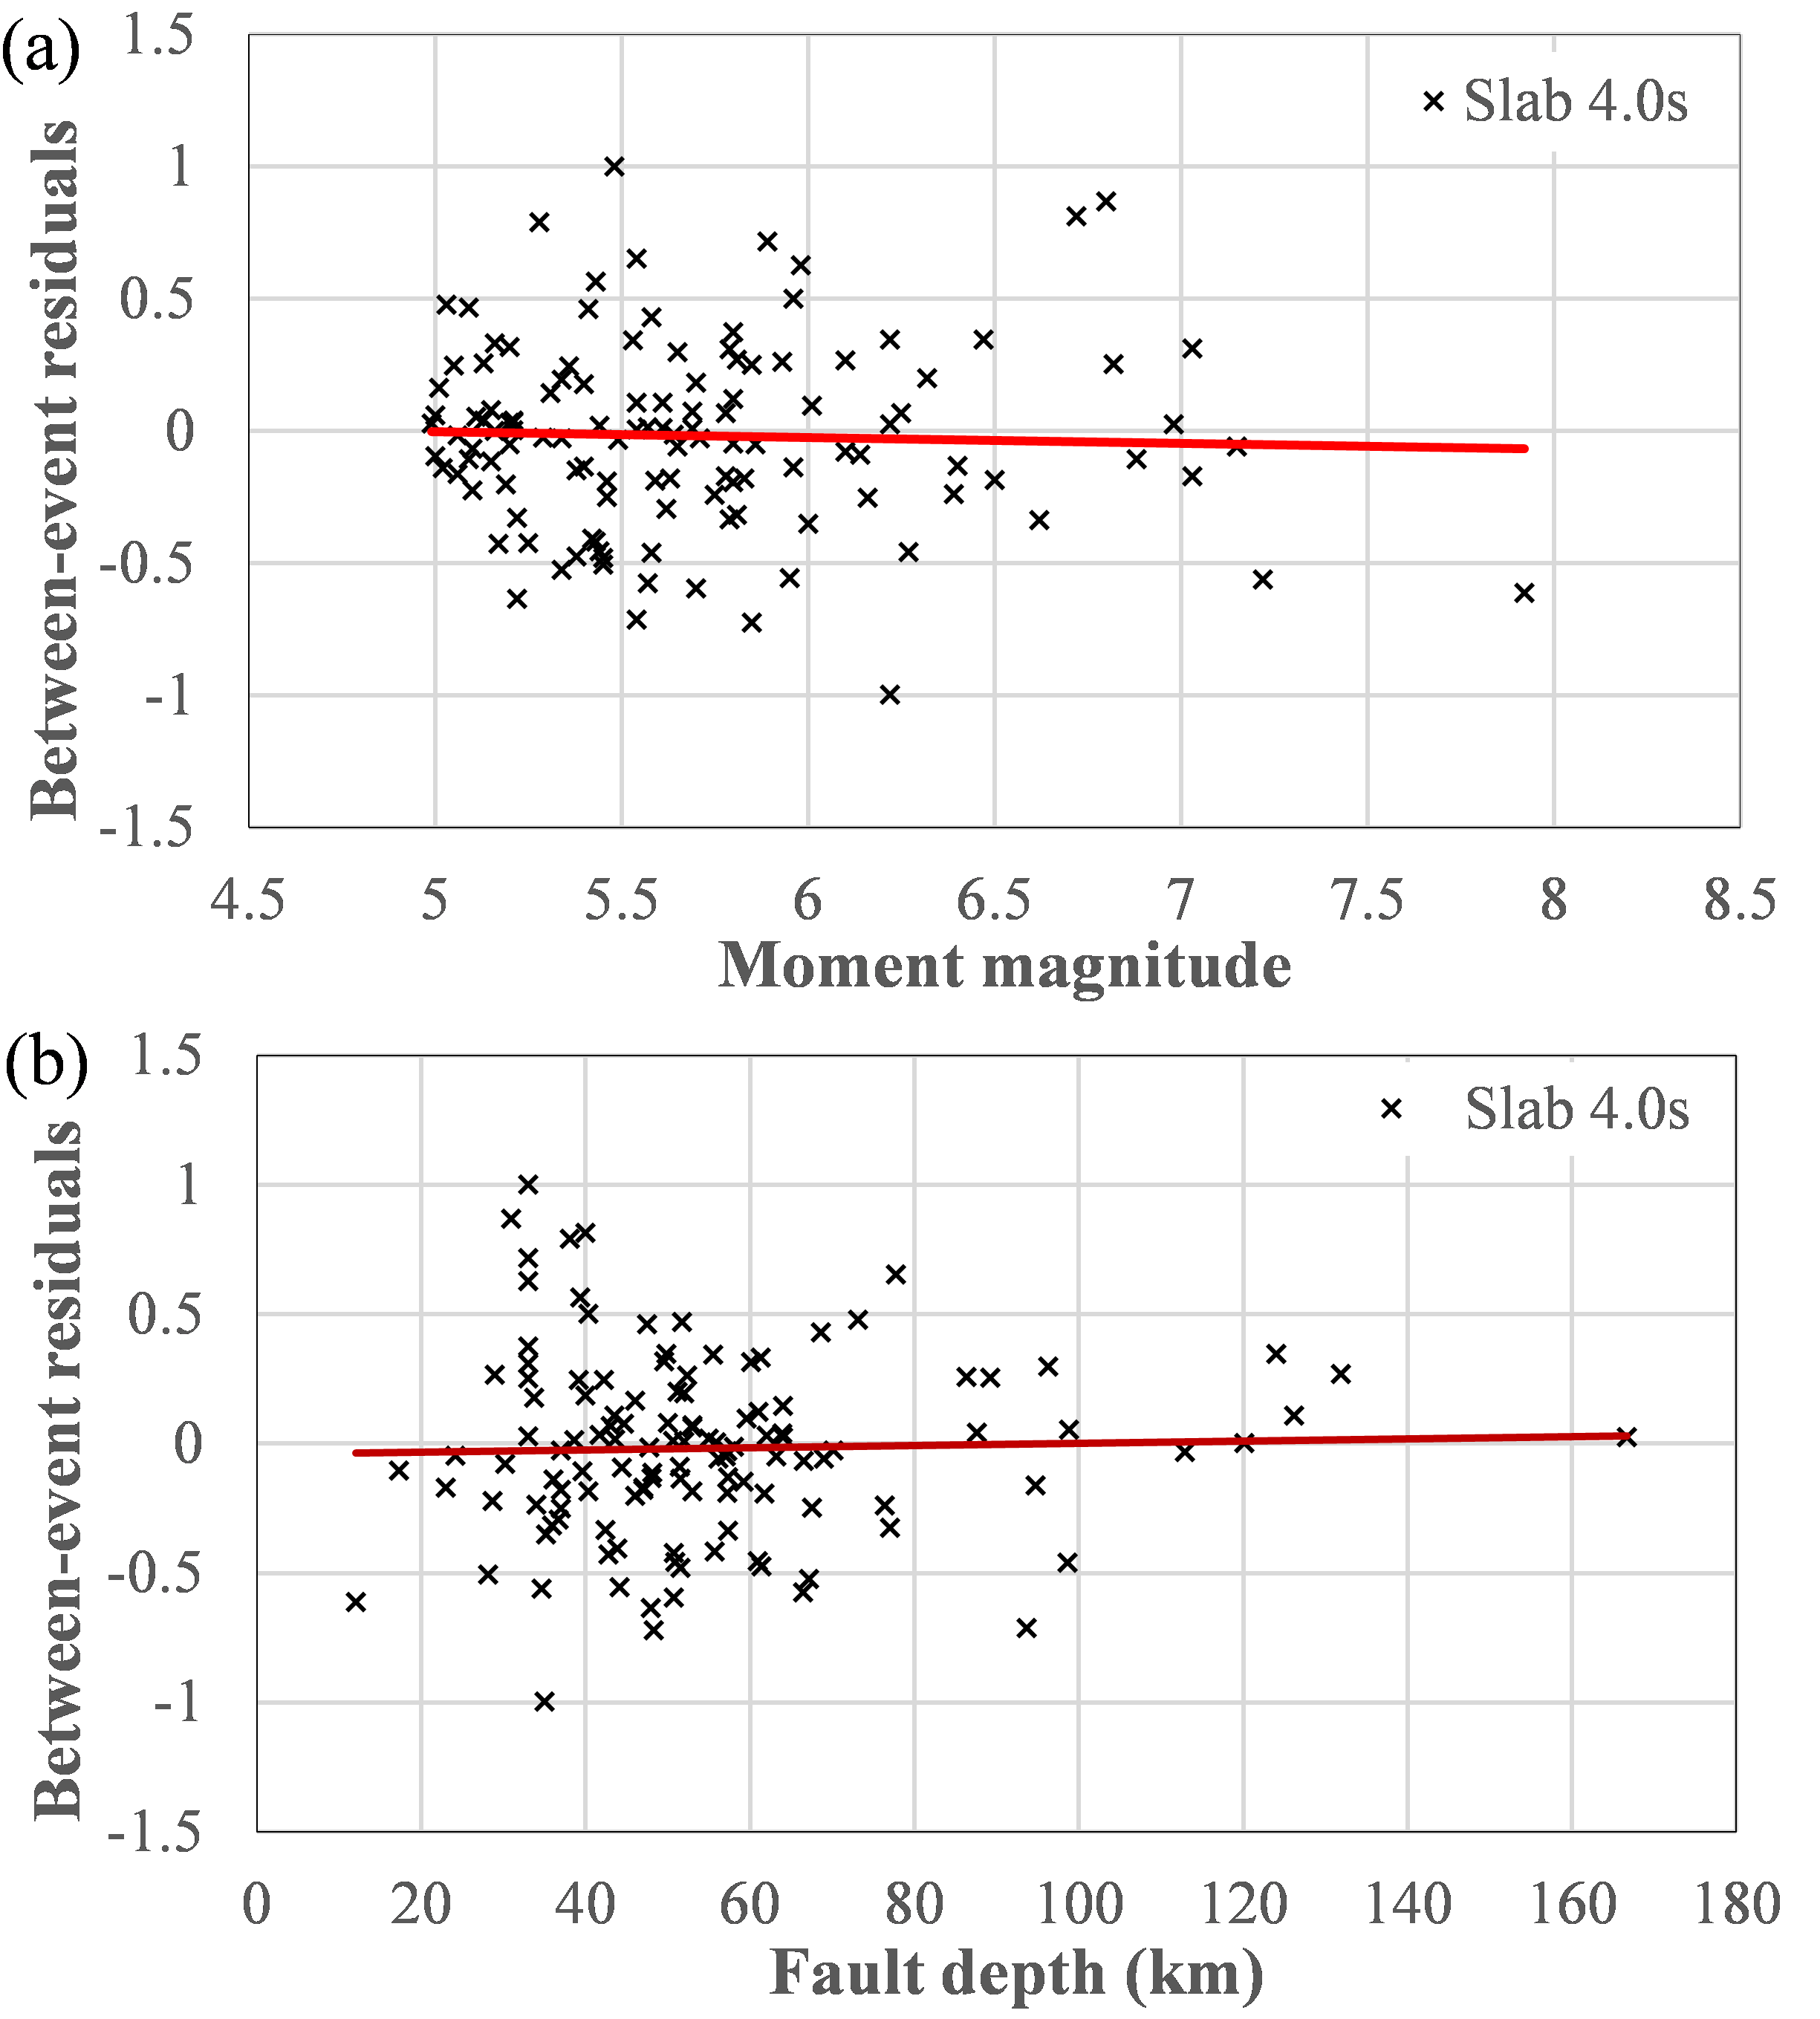
Figure S11. Distribution of between-event residuals for 4.0 s spectral periods with respect to (a) magnitude and (b) fault depth.
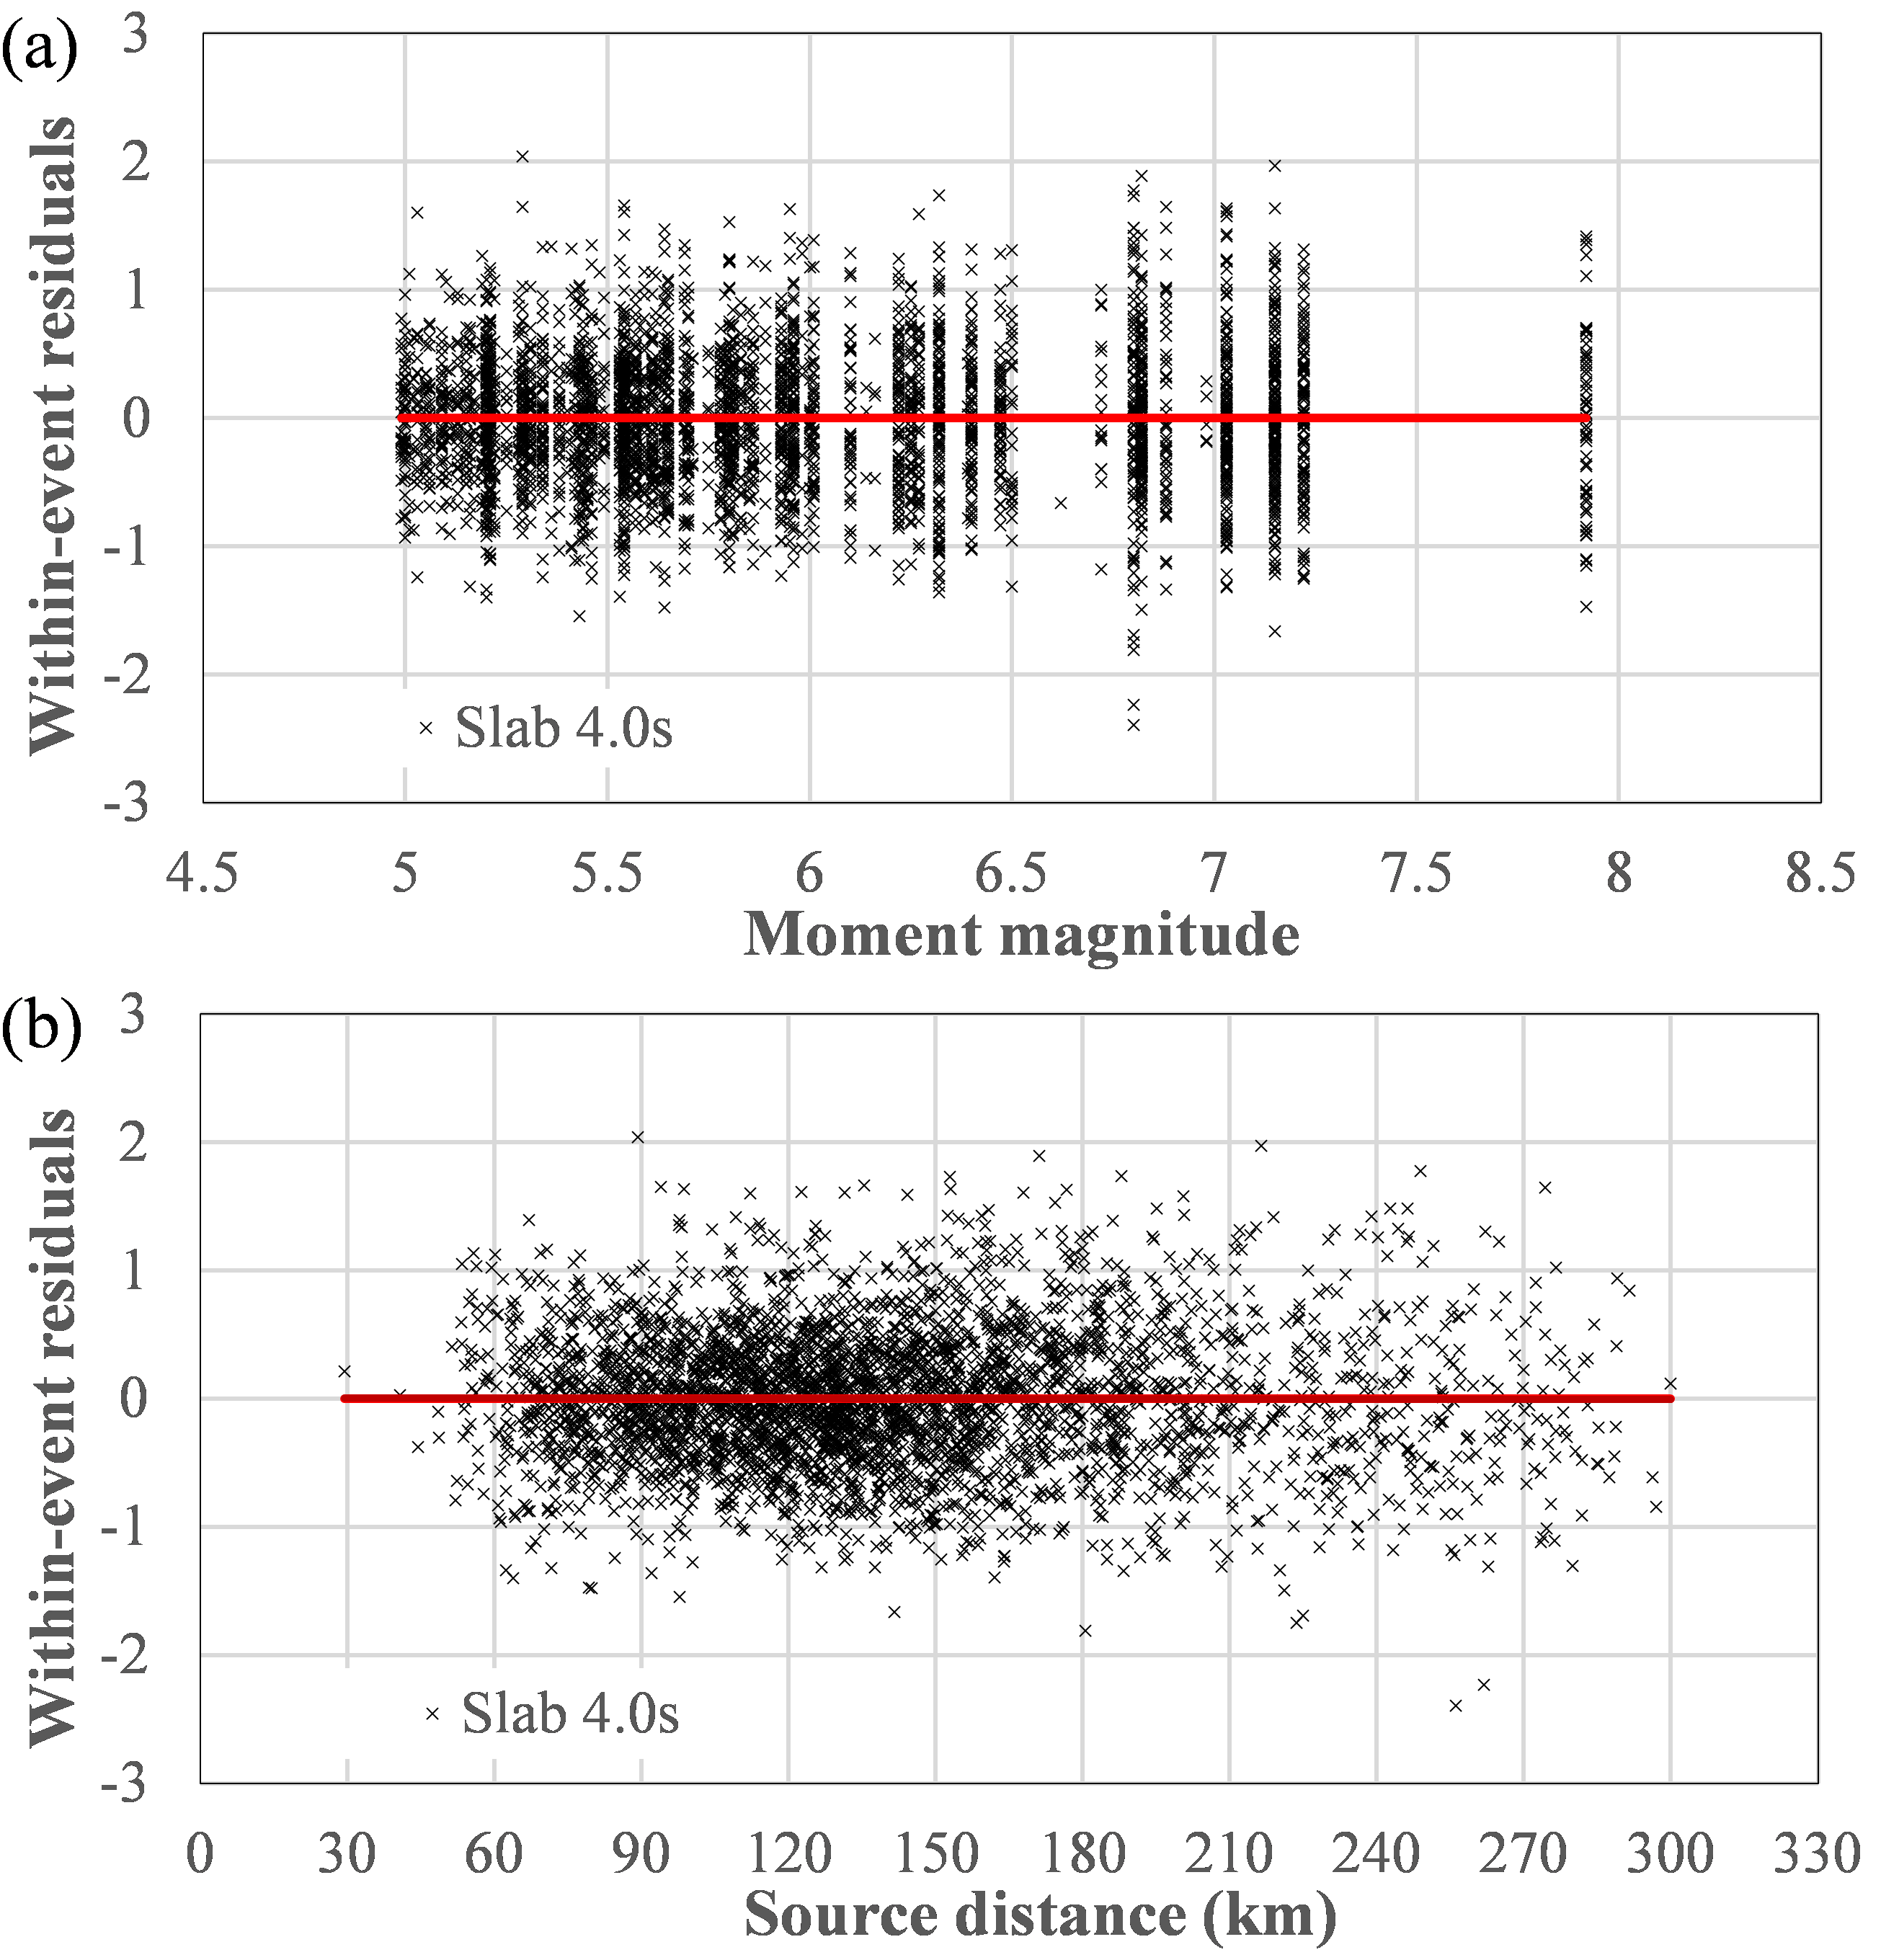
Figure S12. Distribution of within-event residuals for 4.0 s spectral periods with respect to (a) magnitude and (b) source distance.
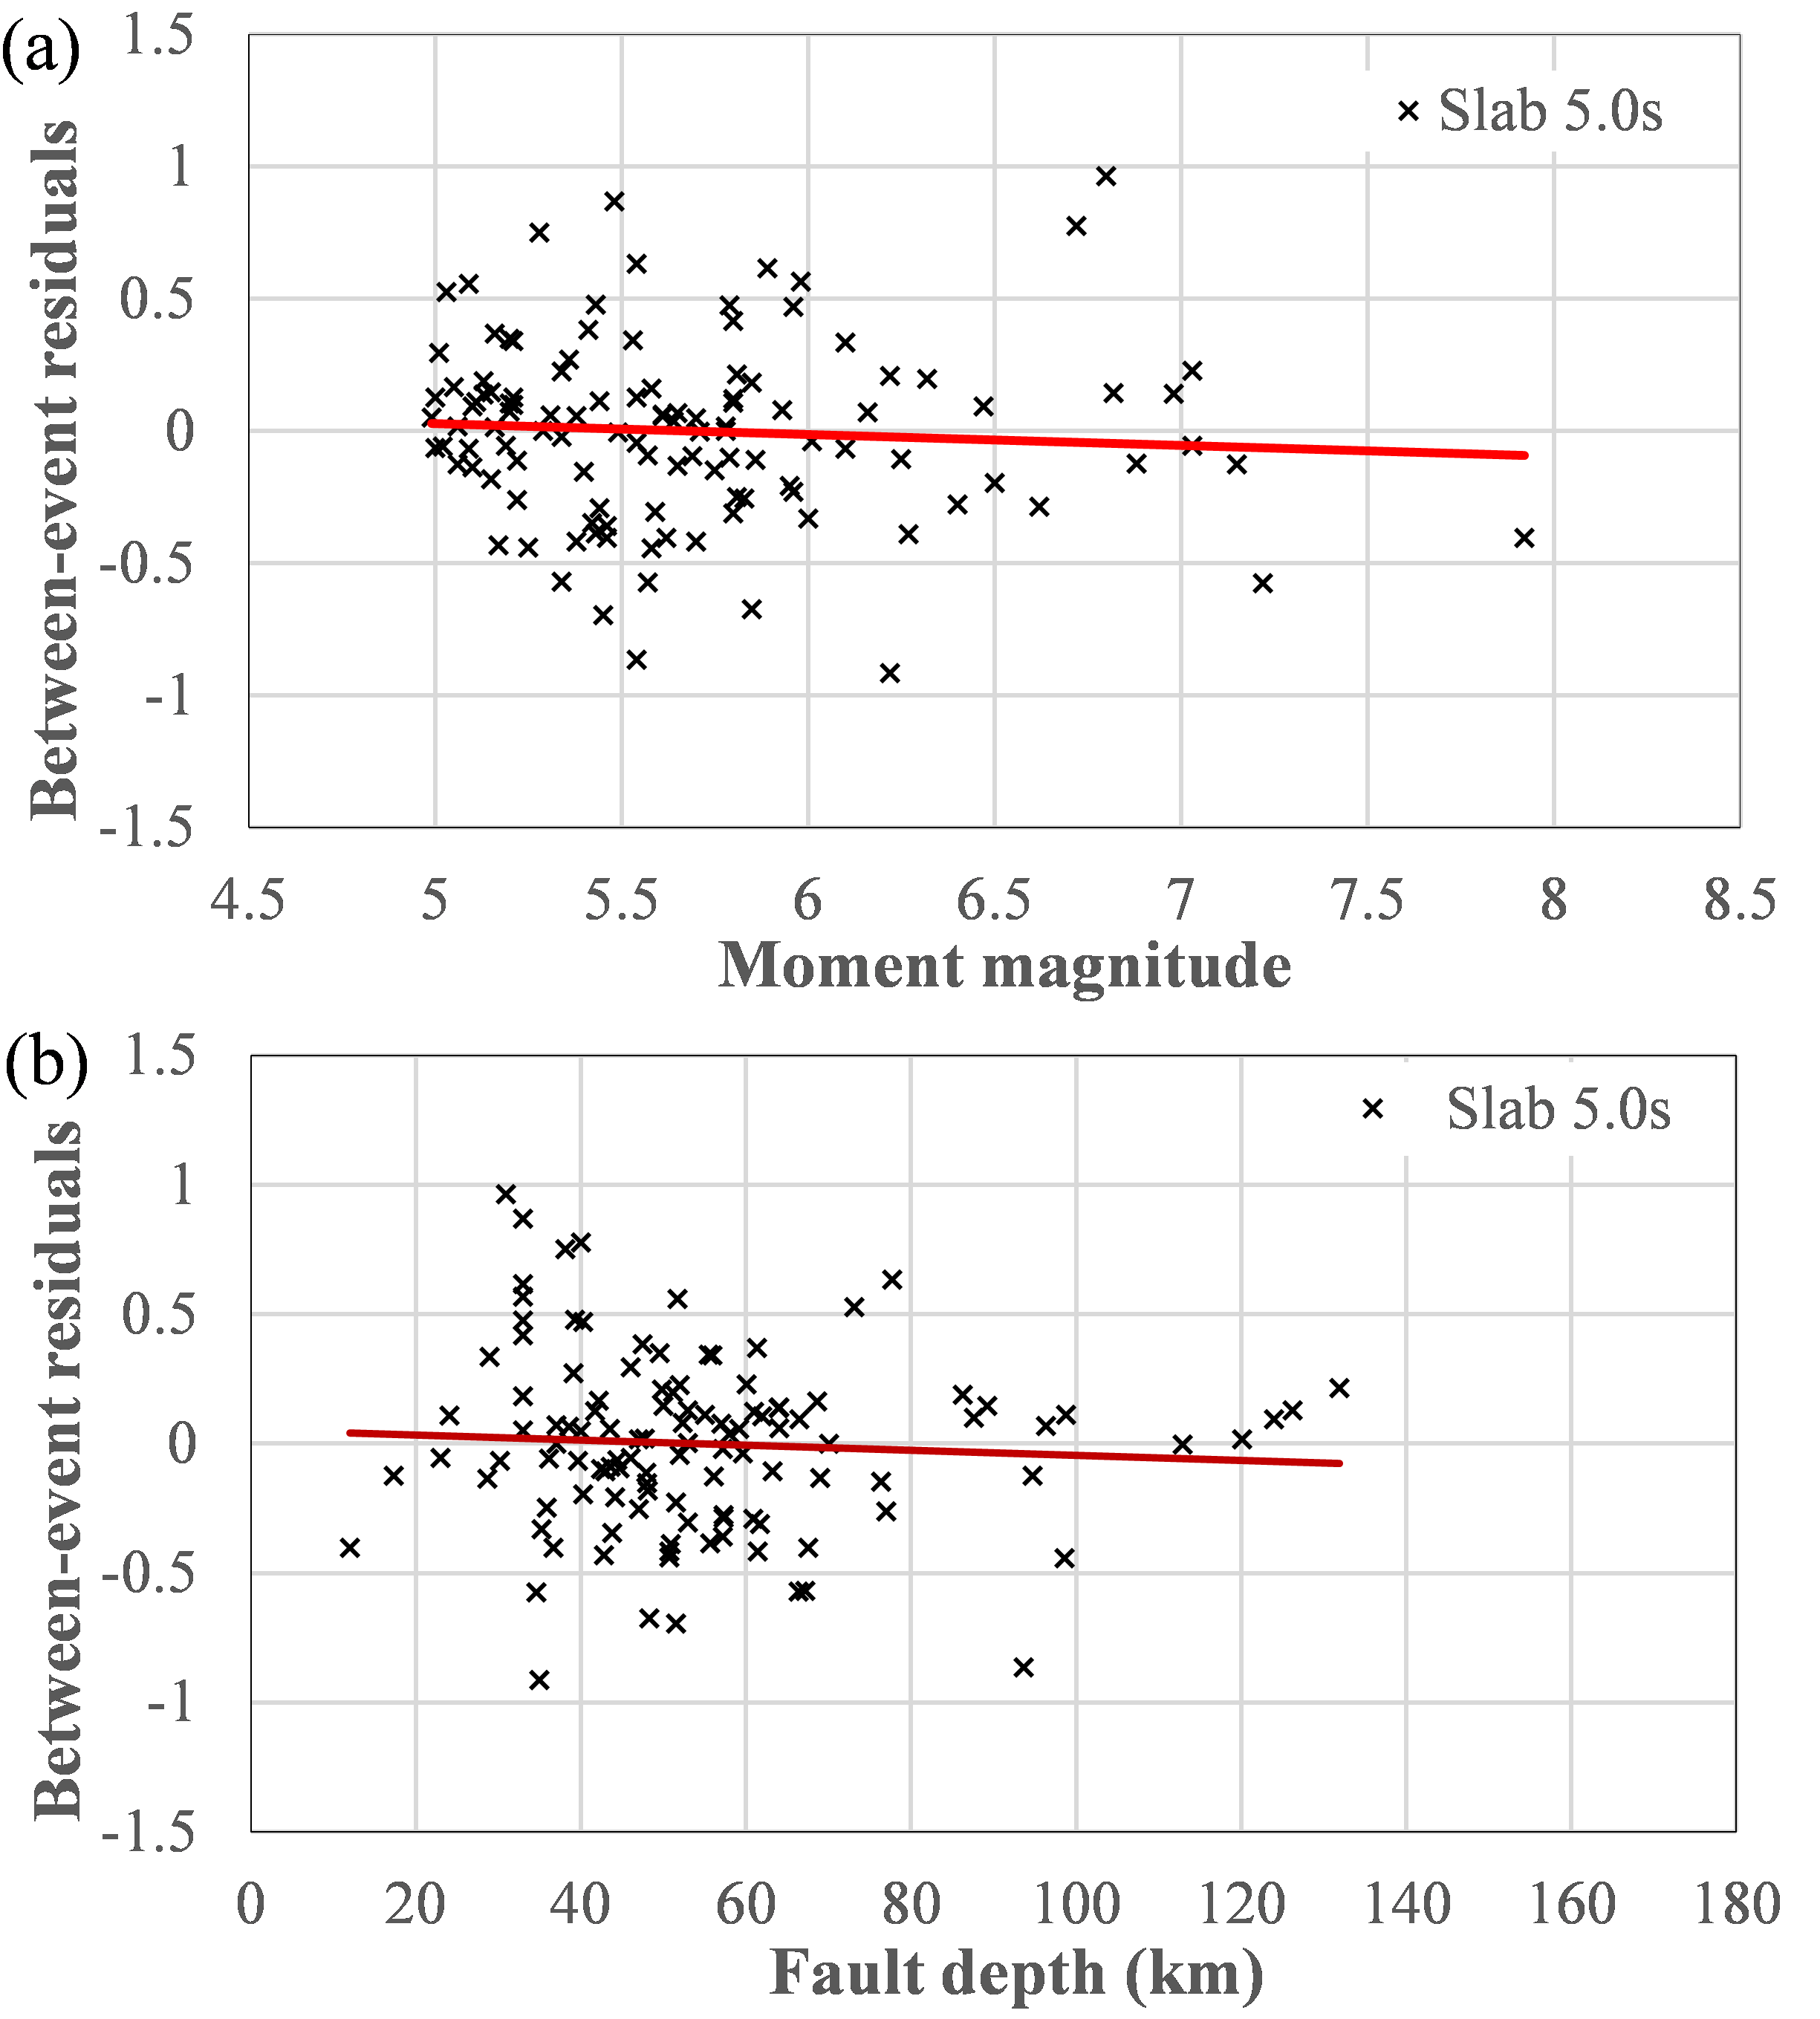
Figure S13. Distribution of between-event residuals for 5.0 s spectral periods with respect to (a) magnitude and (b) fault depth.
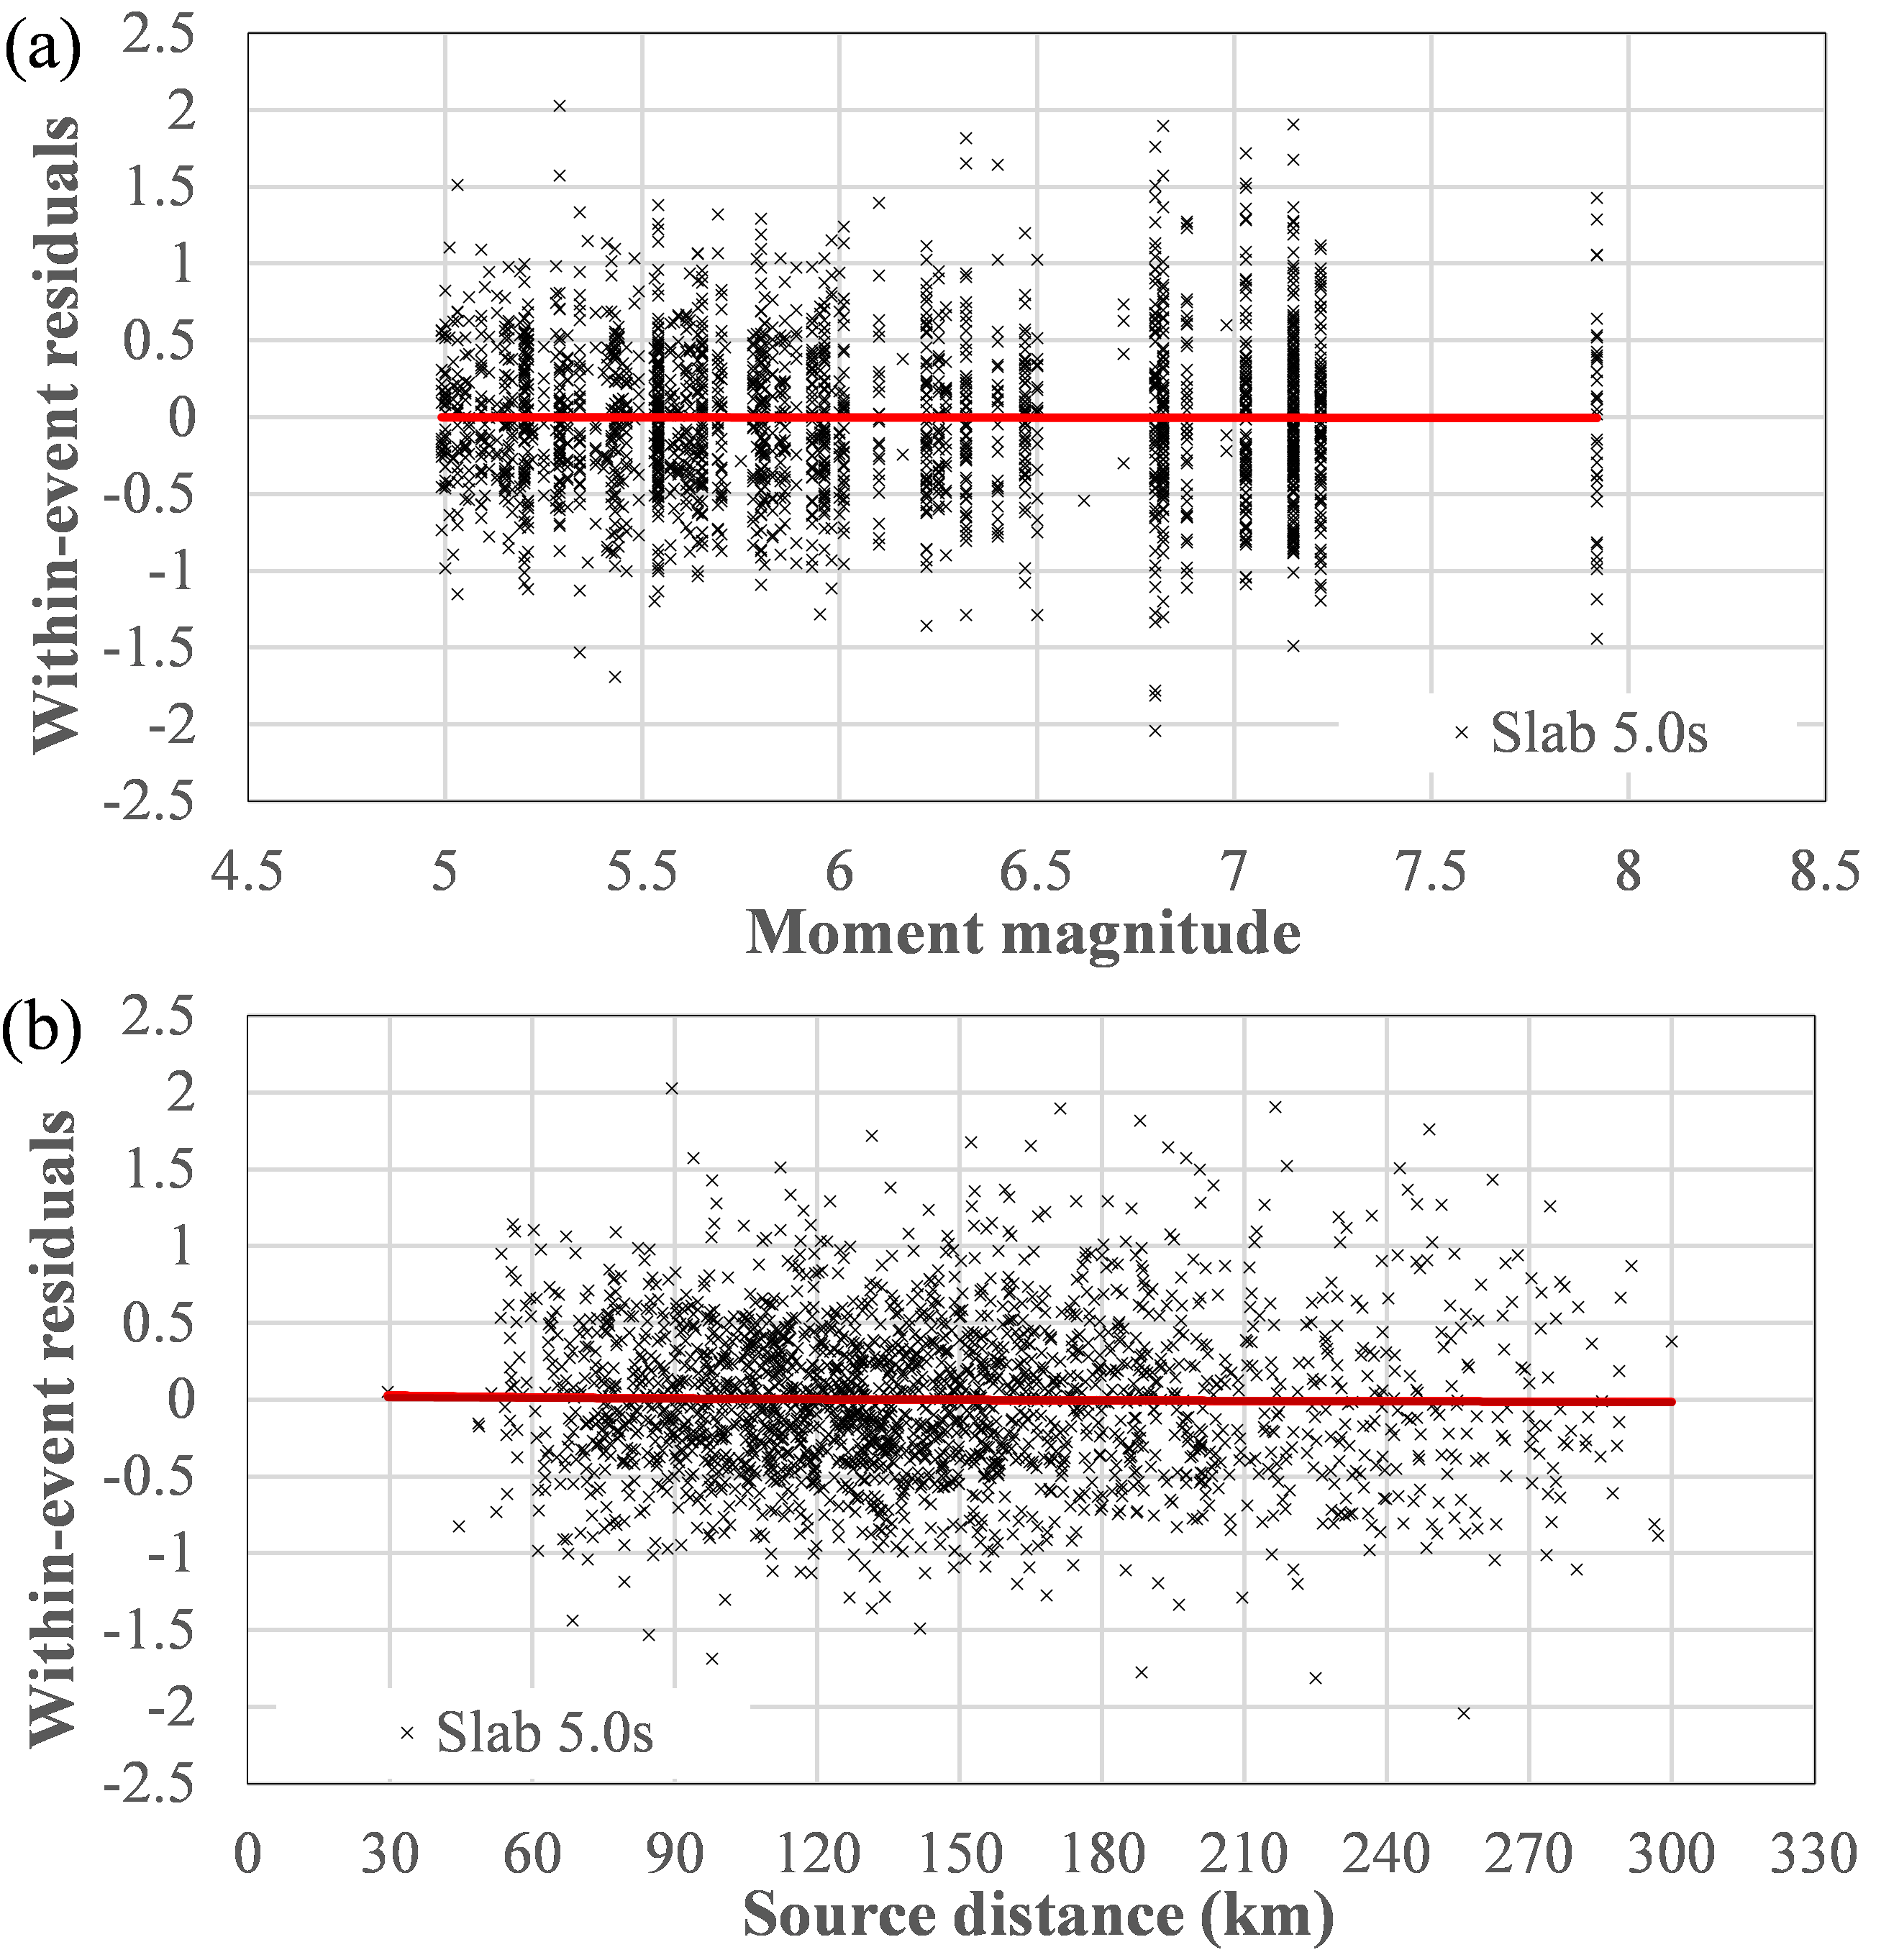
Figure S14. Distribution of within-event residuals for 5.0 s spectral periods with respect to (a) magnitude and (b) source distance.
[ Back ]