This electronic supplement contains nine figures that show the simulated histories of moment release rate and recurrence interval of simulated slip events in the two patches and seismic coupling coefficients. Figure S1 shows the simulated histories of moment release rate defined in equation (4) of the main article on the model fault plane for 0 ≤ x ≤ 12.8 km, including patch 1 (black), and for 12.8 ≤ x ≤ 25.6 km. including patch 2 (red), for D = 0 km and ΔL = 0.02 m. The corresponding slip histories at points 1 and 2 are shown in Figure 2. The peak moment release rates during a simulated earthquake for 0 ≤ x ≤ 12.8 km (black) and for 12.8 ≤ x ≤ 25.6 km (red) are almost the same, and the moment release rate histories for the two regions during interseismic periods are similar to one another. Figures S2–S7 show the simulated histories of moment release rate on the fault for 0 ≤ x ≤ 12.8 km, including patch 1, and for 12.8 ≤ x ≤ 25.6 km, including patch 2, for D = 0 km and ΔL = 0.0675, 0.20, 0.325, 0.36, 0.46, and 0.78 m, respectively; the time intervals shown correspond to those in Figures 3–8 of the main article. The moment release rate during slip events can be used to infer whether slip in patch 2 is seismic or aseismic. Aseismic slip behavior during interseismic periods is inferred also from the simulated histories of moment release rate. Figures S8 and S9 show the recurrence interval T of simulated slip events in patch 1 and the seismic coupling coefficients χ1 and χ2 within patches 1 and 2, respectively, plotted against ΔL on expanded scale of ΔL for D = 0 and 2.4 km, respectively.
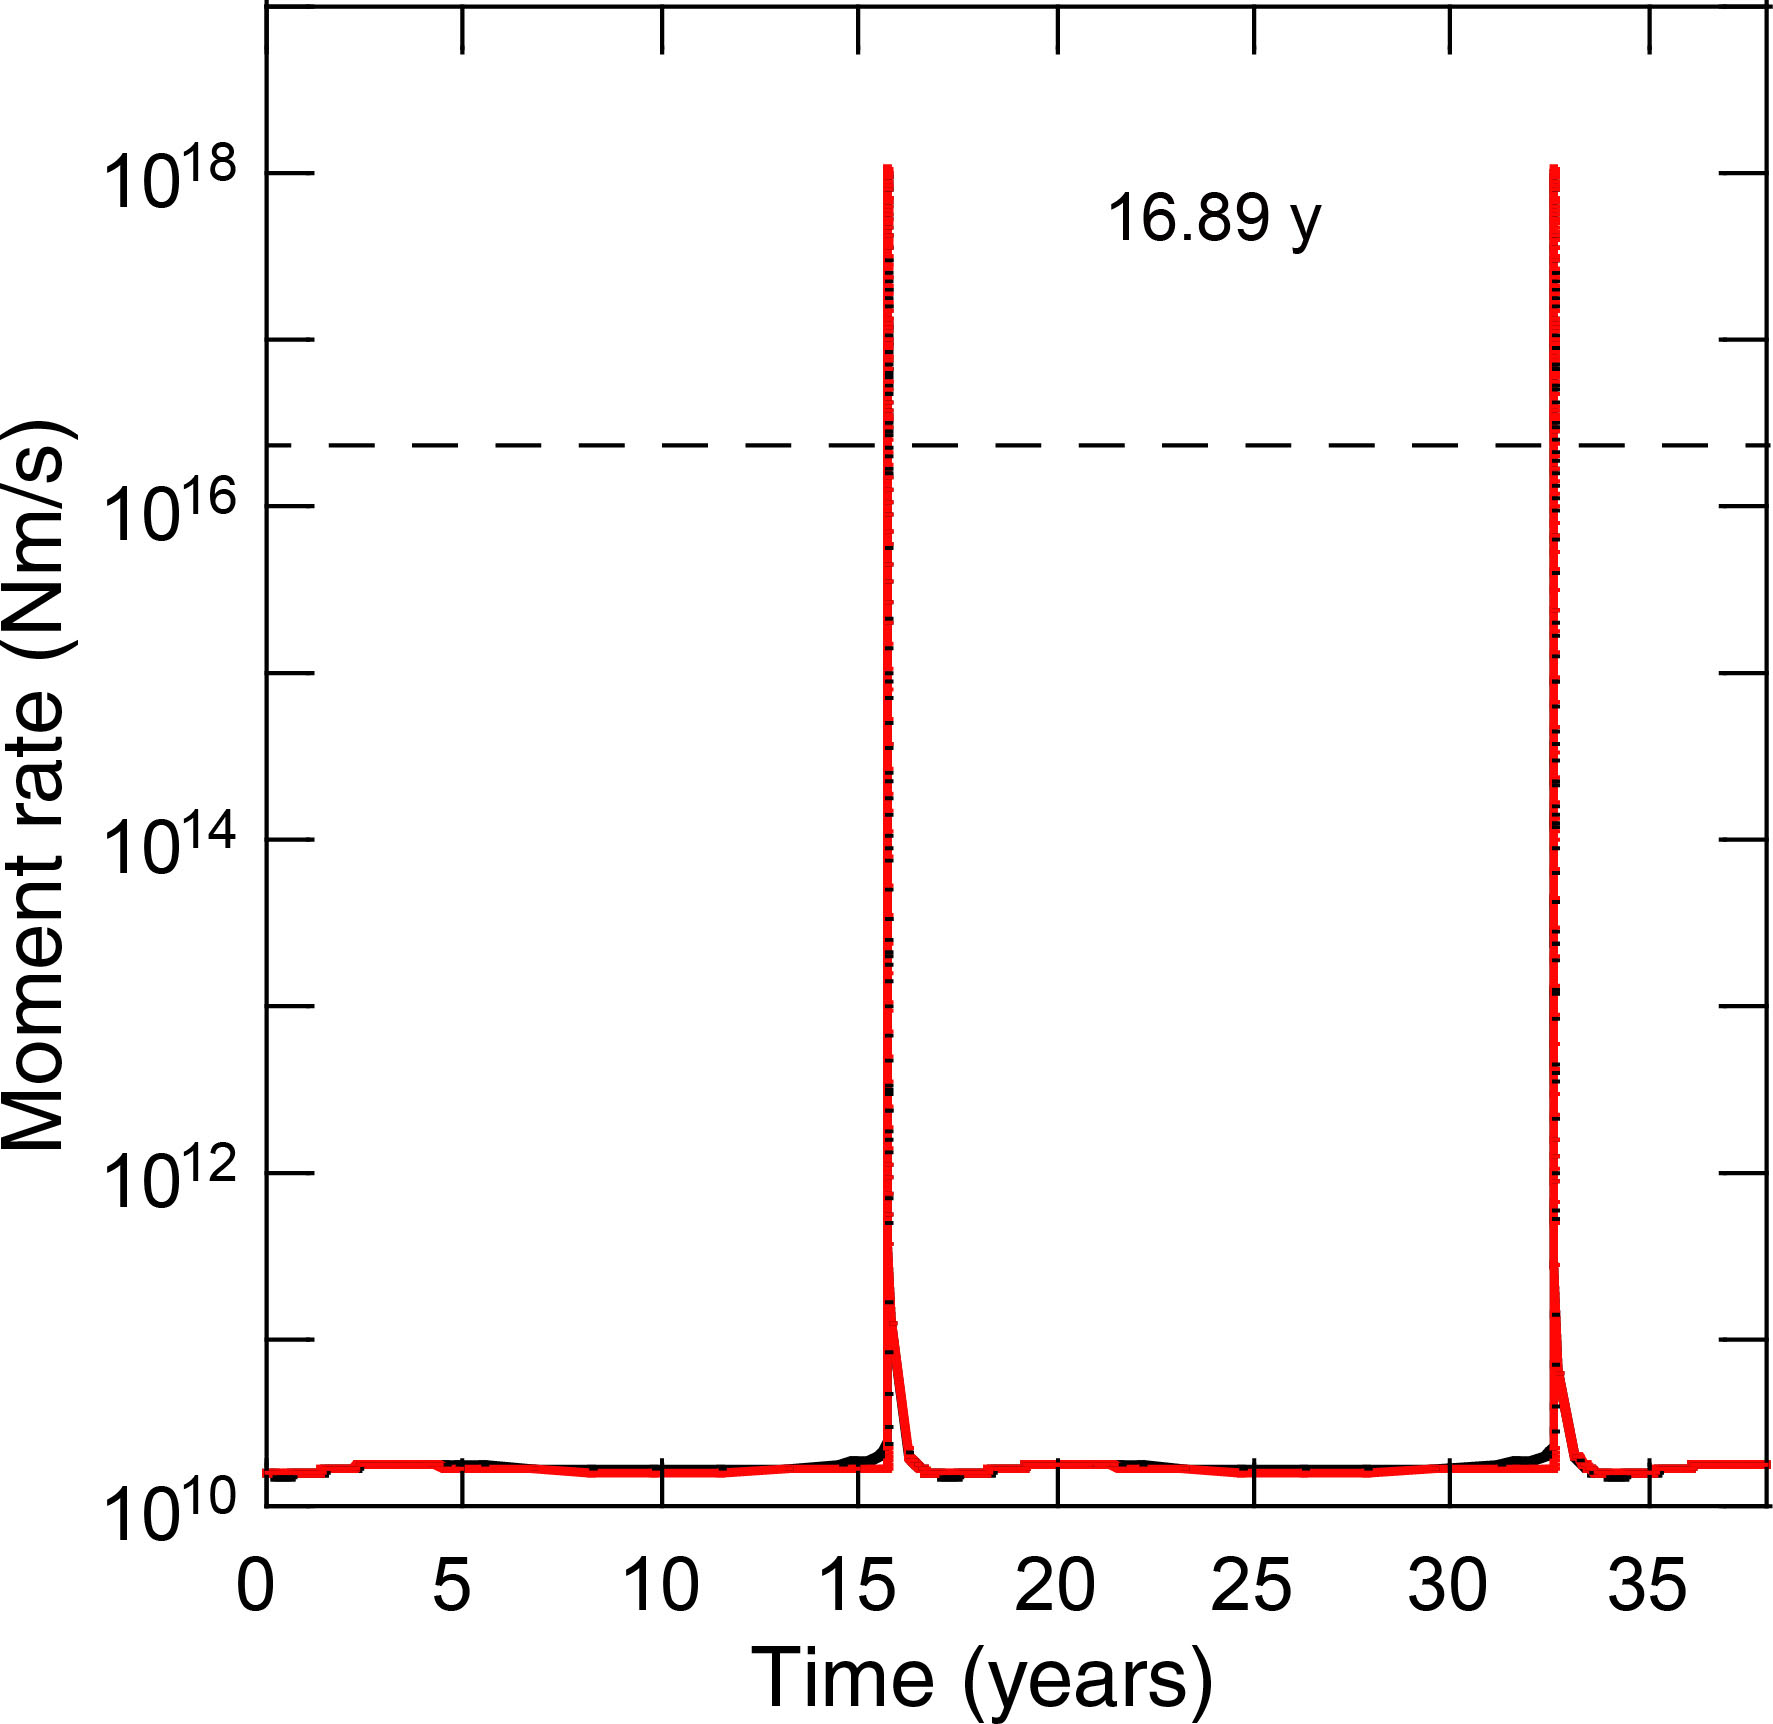
Figure S1. Simulated histories of moment release rate on the model fault plane for 0 ≤ x ≤ 12.8 km, including patch 1 (black), and for 12.8 ≤ x ≤ 25.6 km, including patch 2 (red), for D = 0 km and ΔL = 0.02 m. The time interval between successive slip events is shown. For reference, the dashed line indicates the seismic moment rate at which the slip rate in the velocity-weakening patch is 0.01 m/s and that in the velocity-strengthening region is 0.1 m/y (=Vpl).
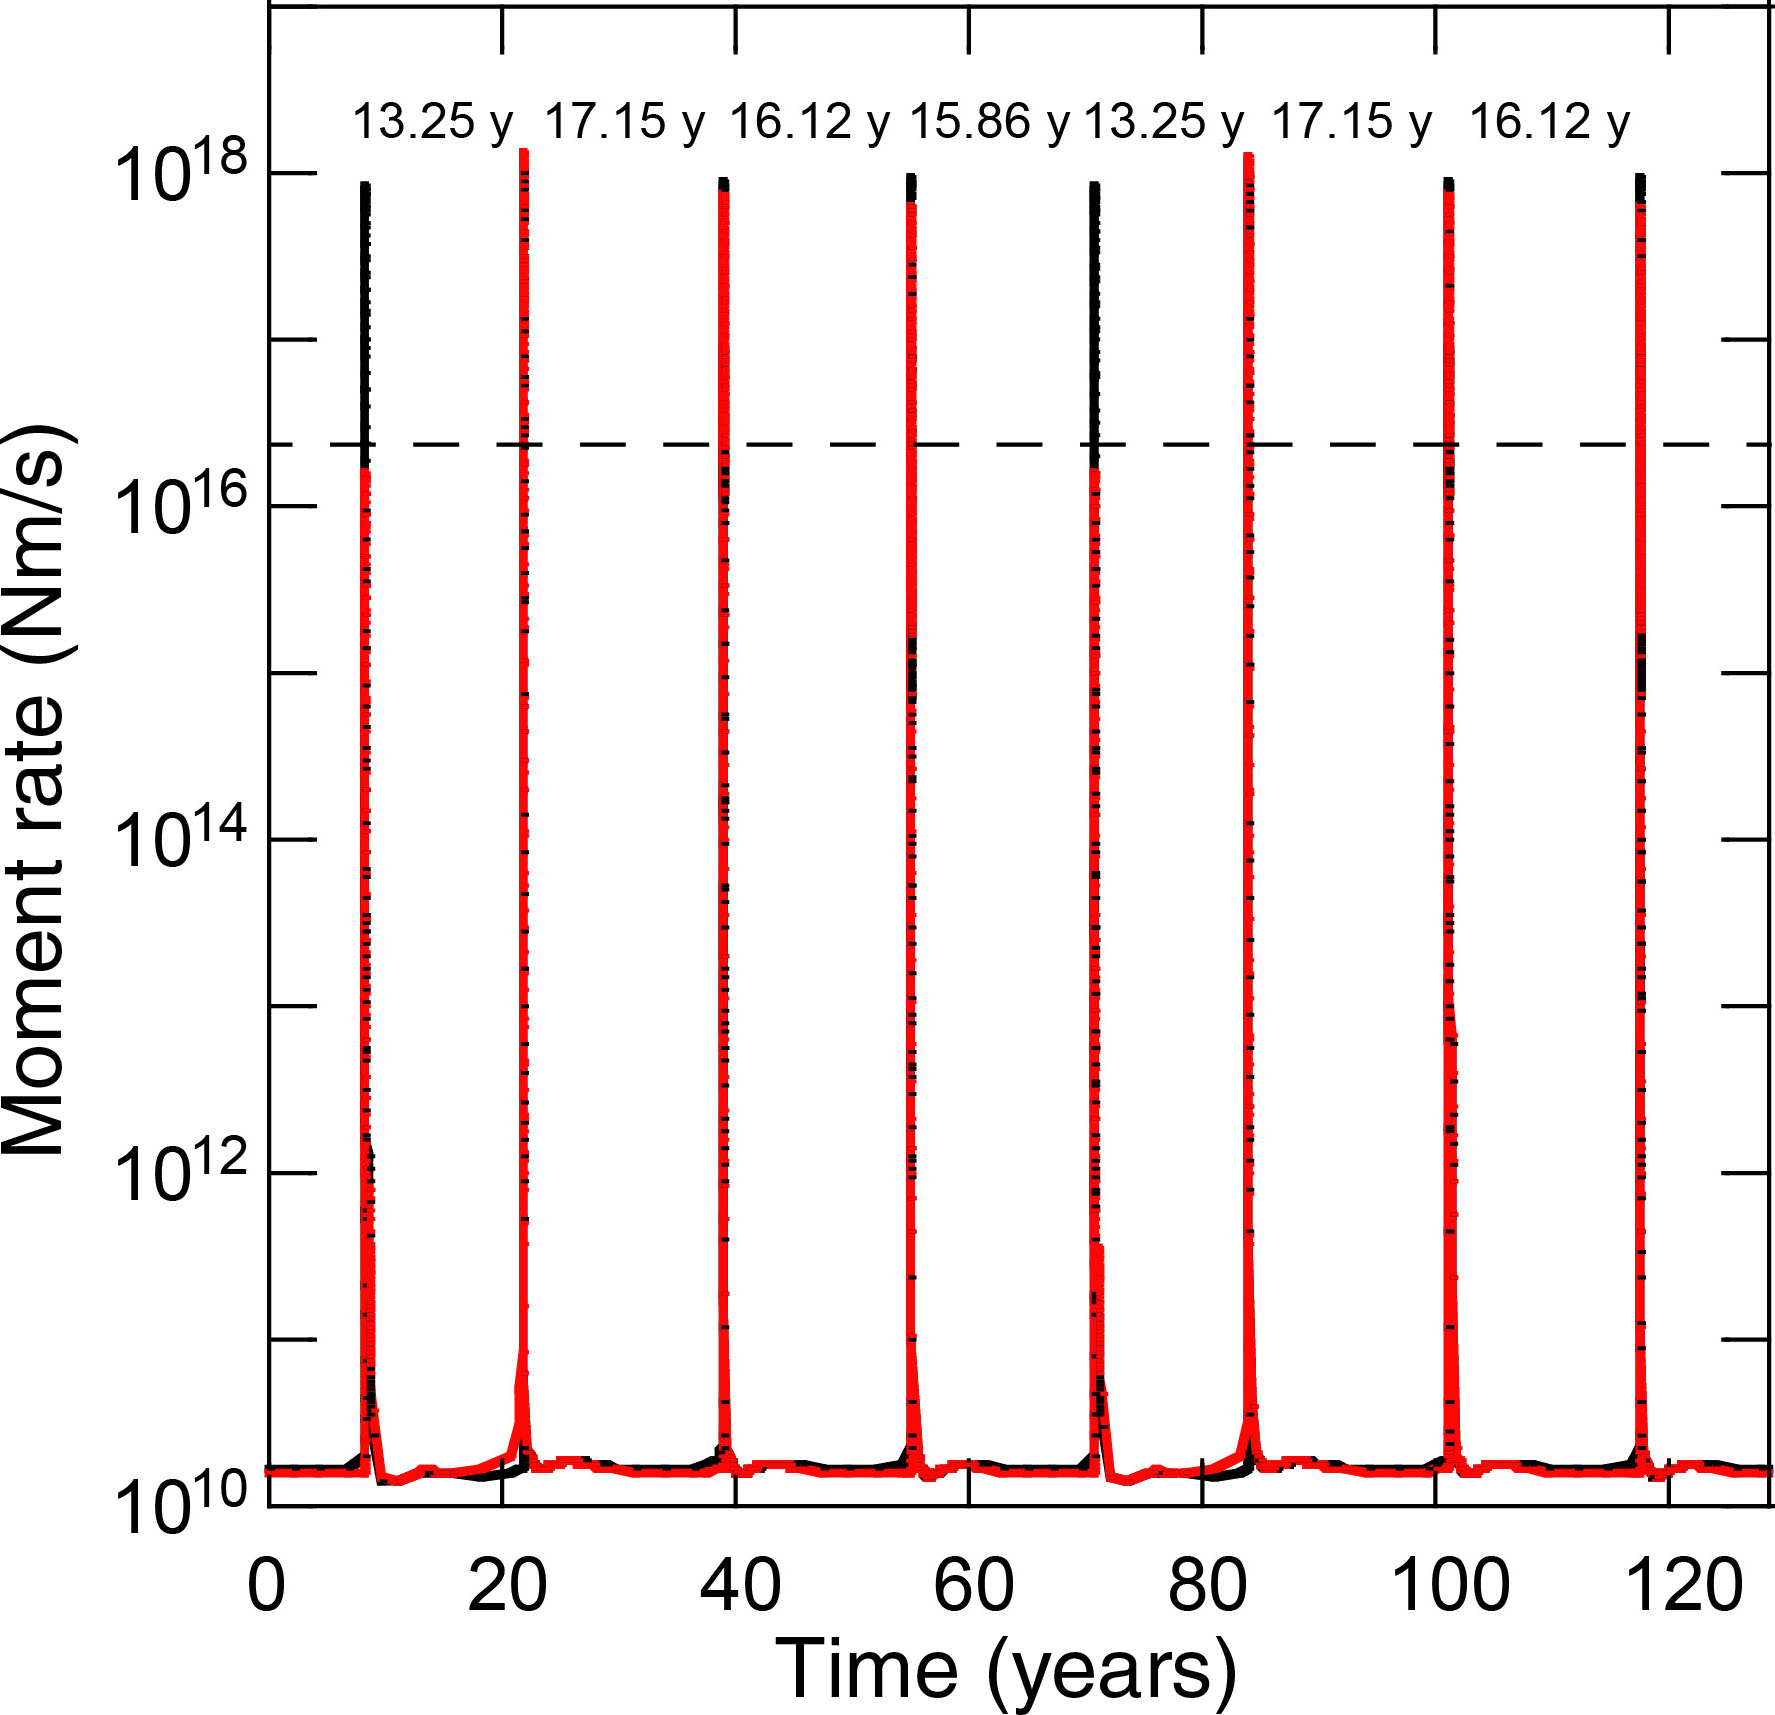
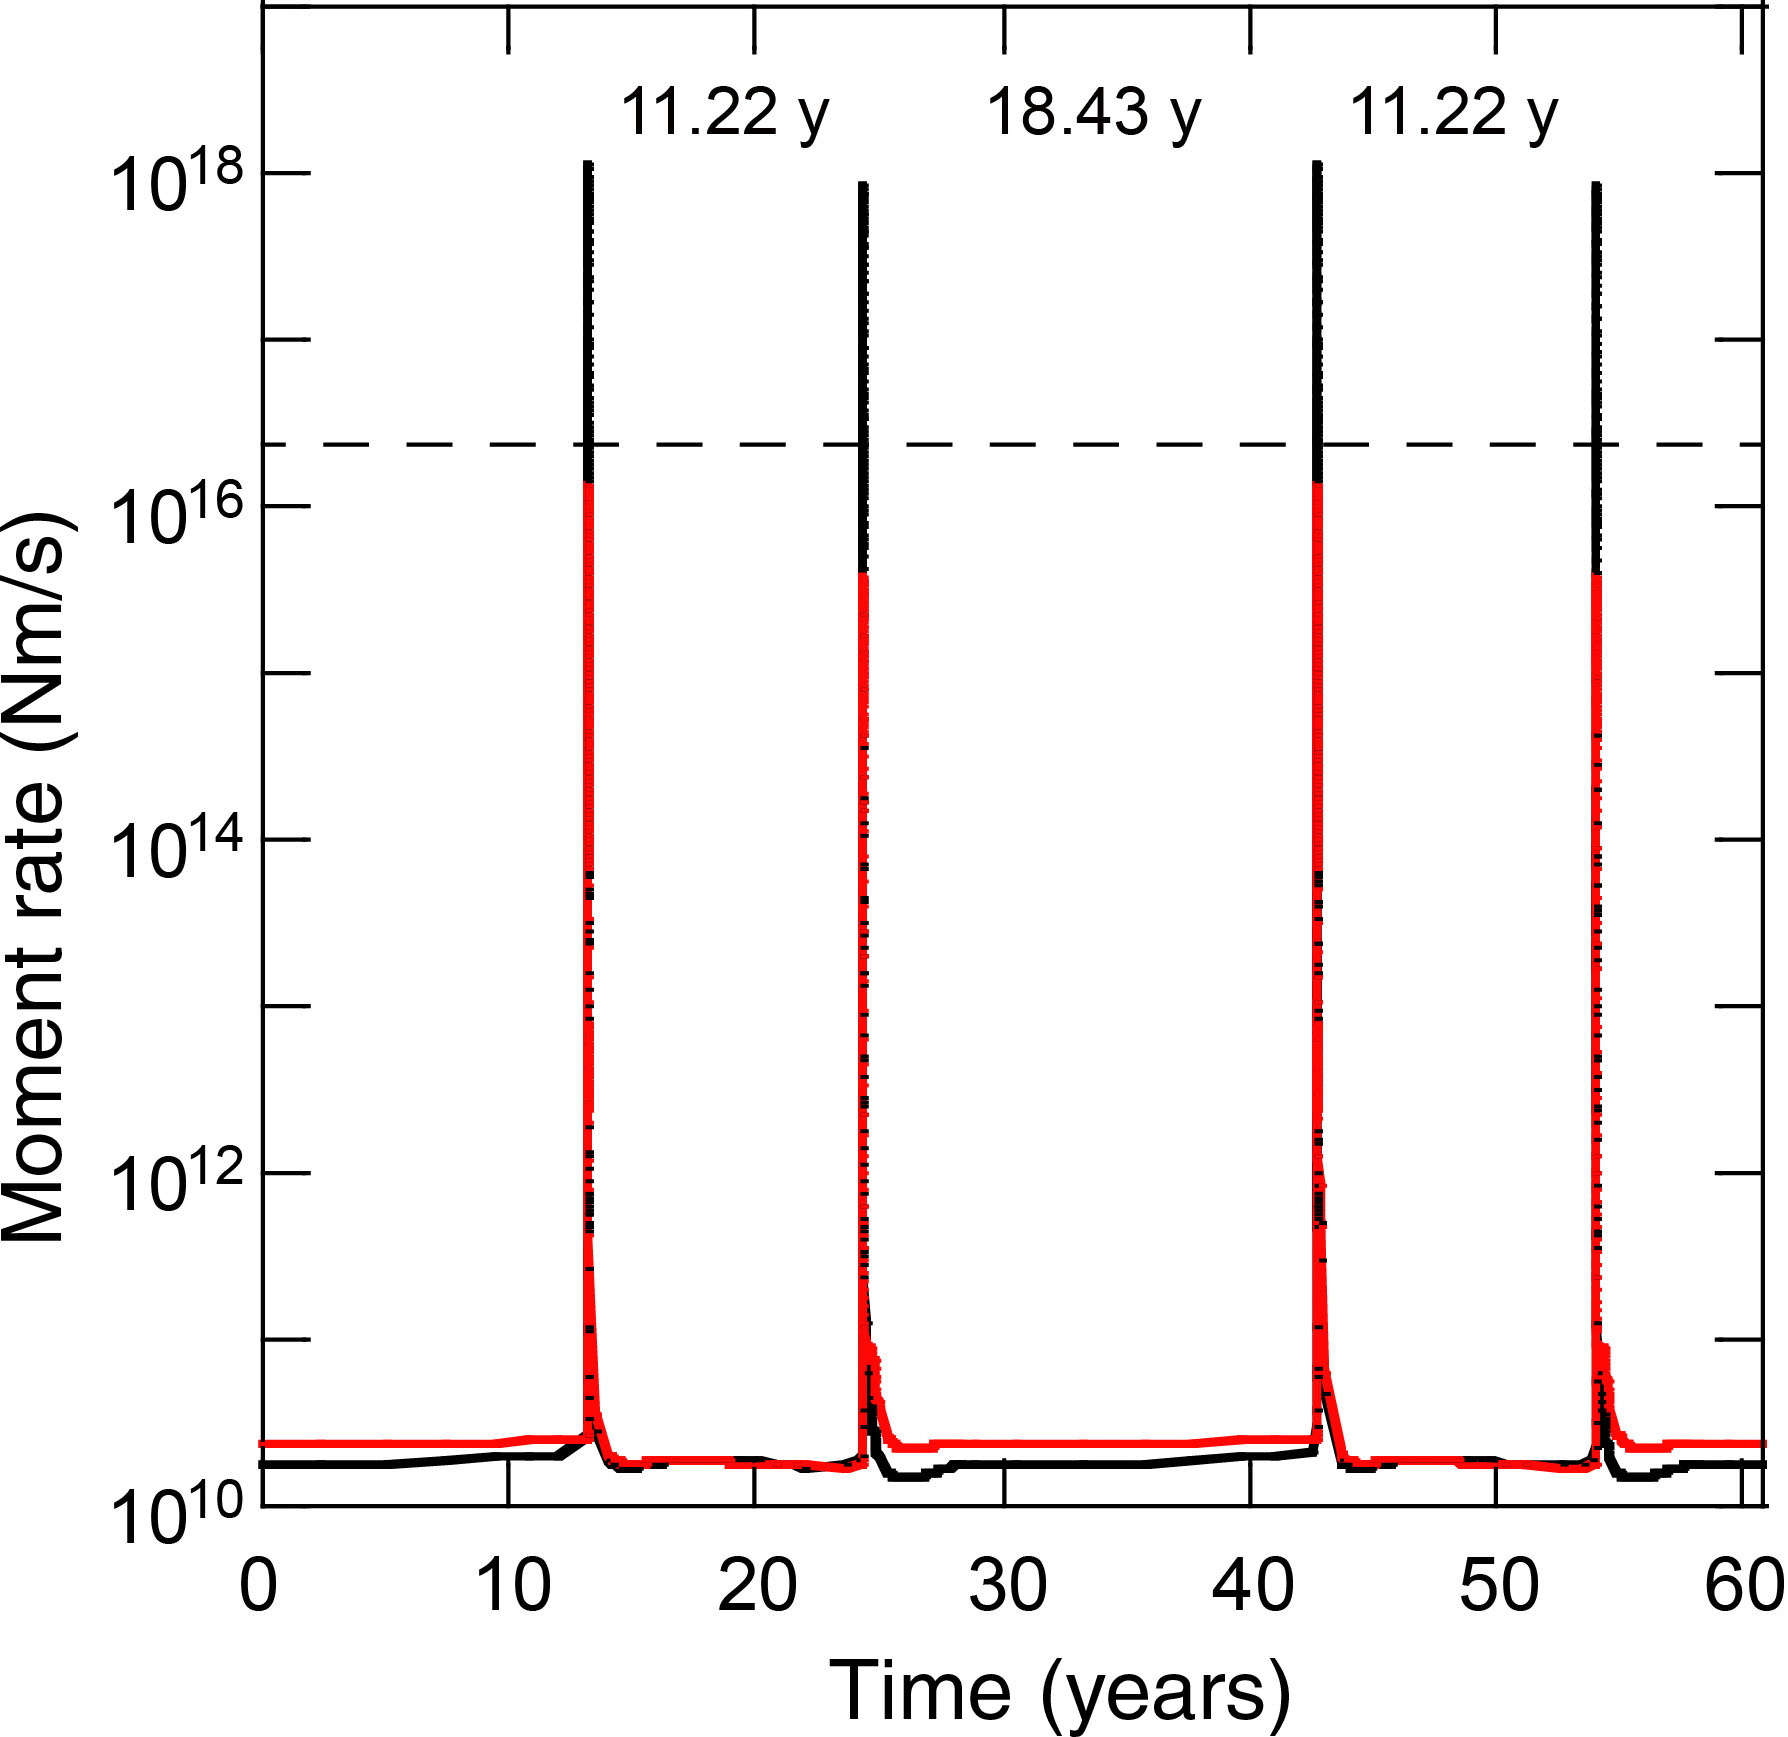
Figure S2. Simulated histories of moment release rate on the model fault plane for 0 ≤ x ≤ 12.8 km, including patch 1 (black), and for 12.8 ≤ x ≤ 25.6 km, including patch 2 (red), for D = 0 km and ΔL = 0.0675 m. The time intervals between successive slip events are shown. For reference, the dashed line indicates the seismic moment rate at which the slip rate in the velocity-weakening patch is 0.01 m/s and that in the velocity-strengthening region is 0.1 m/y (=Vpl).
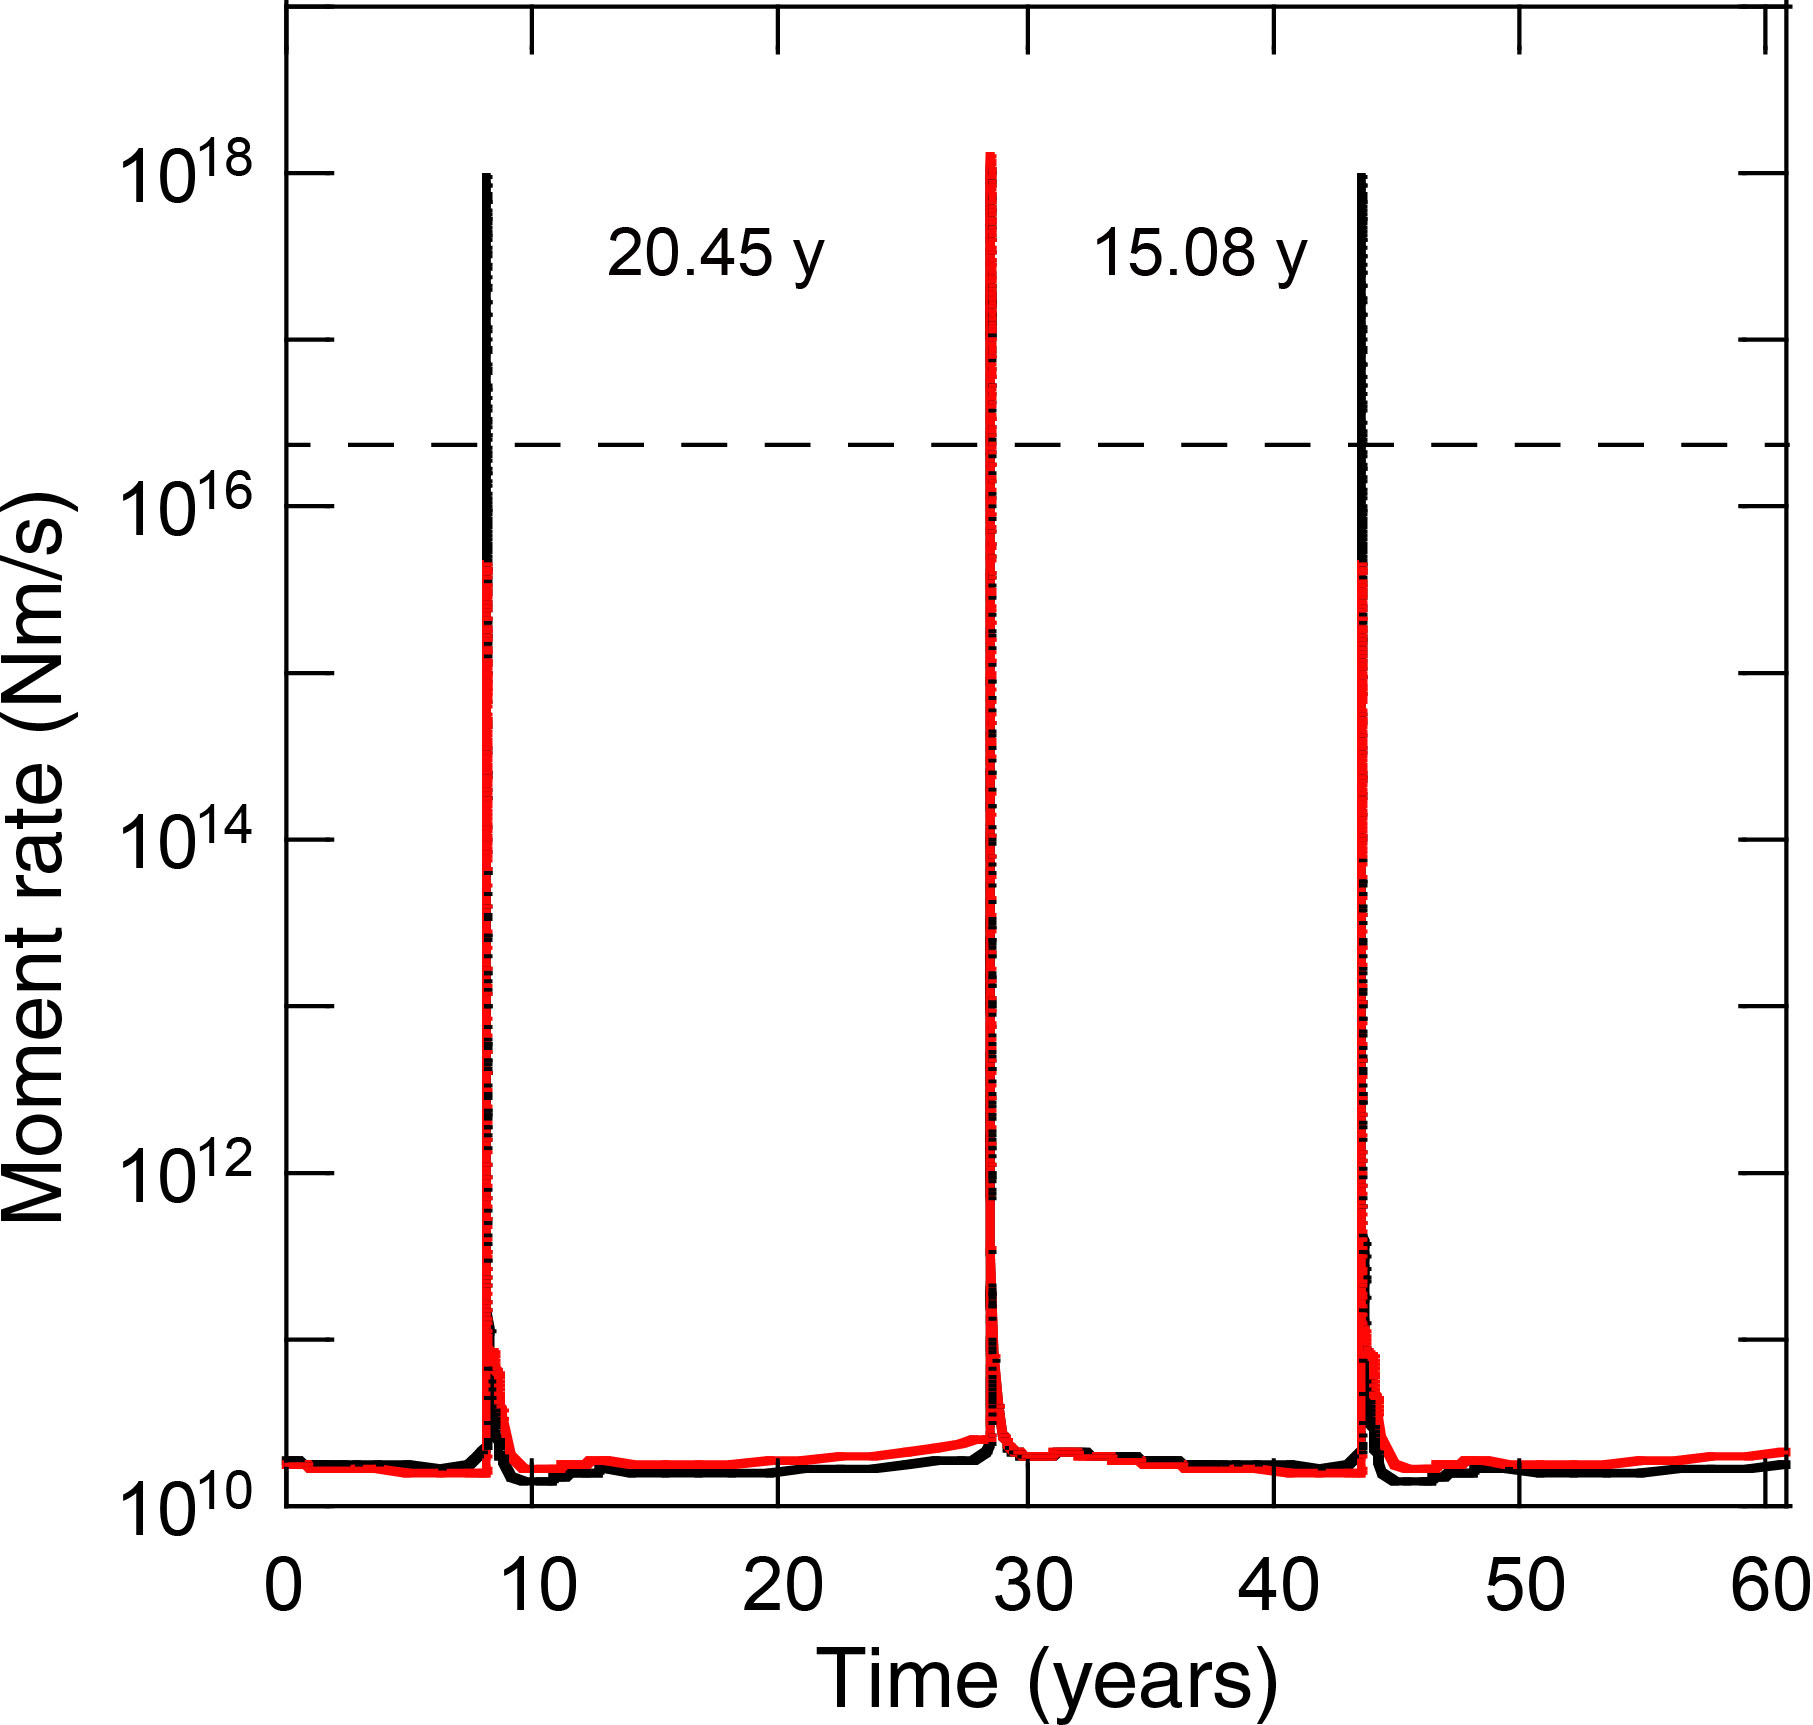
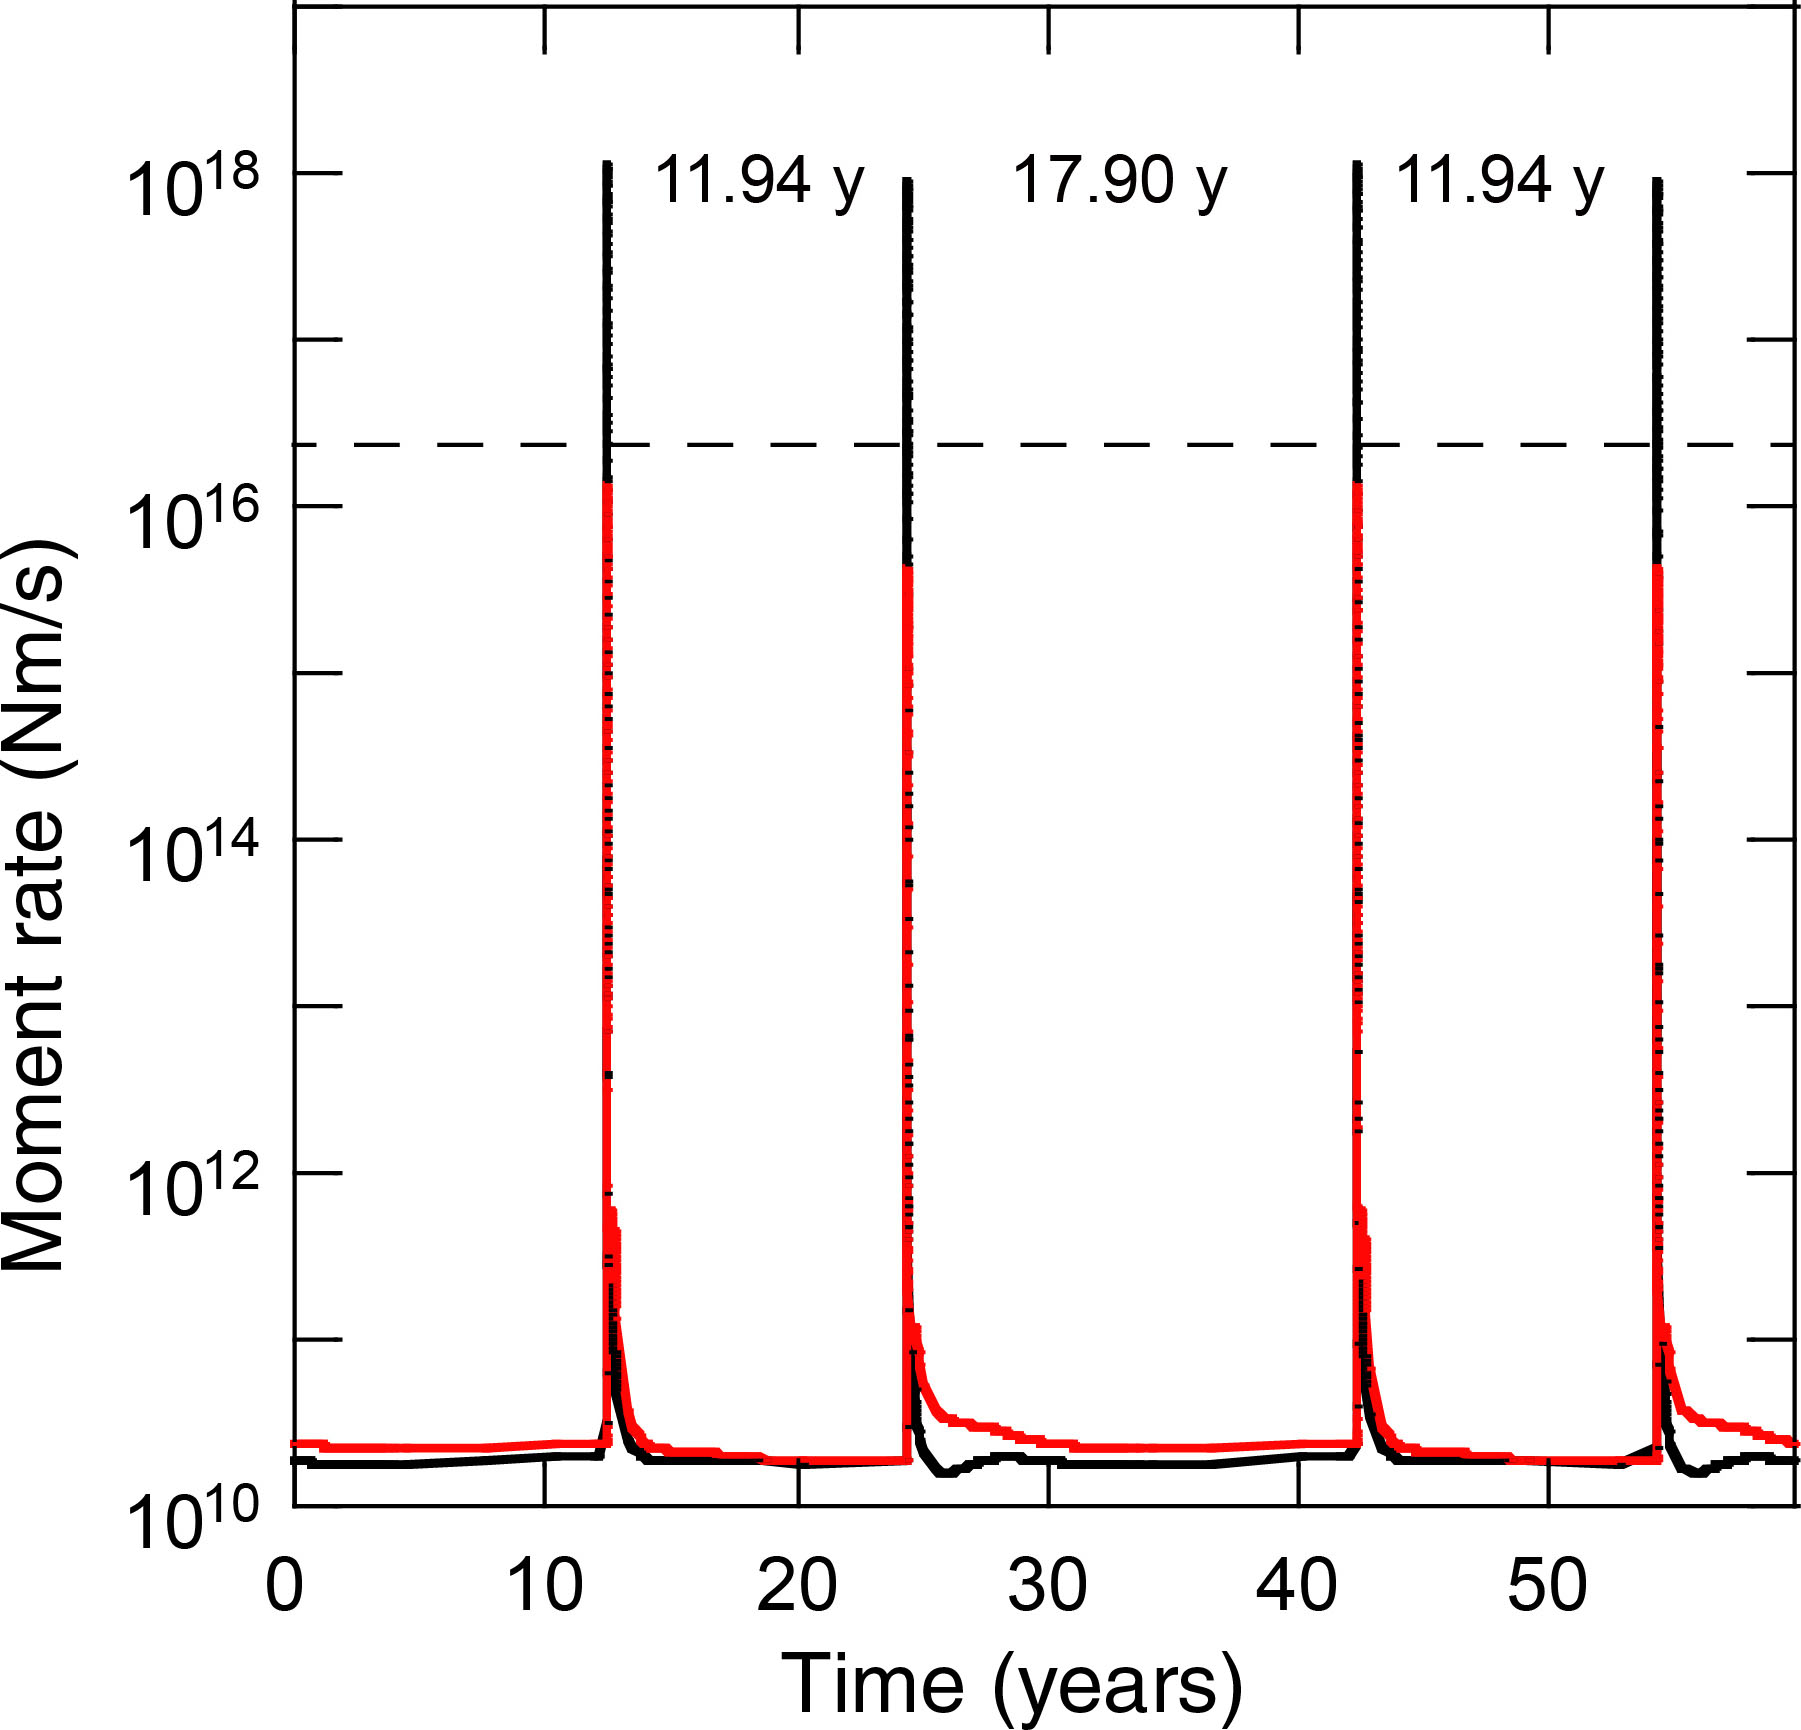
Figure S3. Simulated histories of moment release rate on the model fault plane for 0 ≤ x ≤ 12.8 km, including patch 1 (black), and for 12.8 ≤ x ≤ 25.6 km, including patch 2 (red), for D = 0 km and ΔL = 0.20 m. The time intervals between successive slip events are shown. For reference, the dashed line indicates the seismic moment rate at which the slip rate in the velocity-weakening patch is 0.01 m/s and that in the velocity-strengthening region is 0.1 m/y (=Vpl).
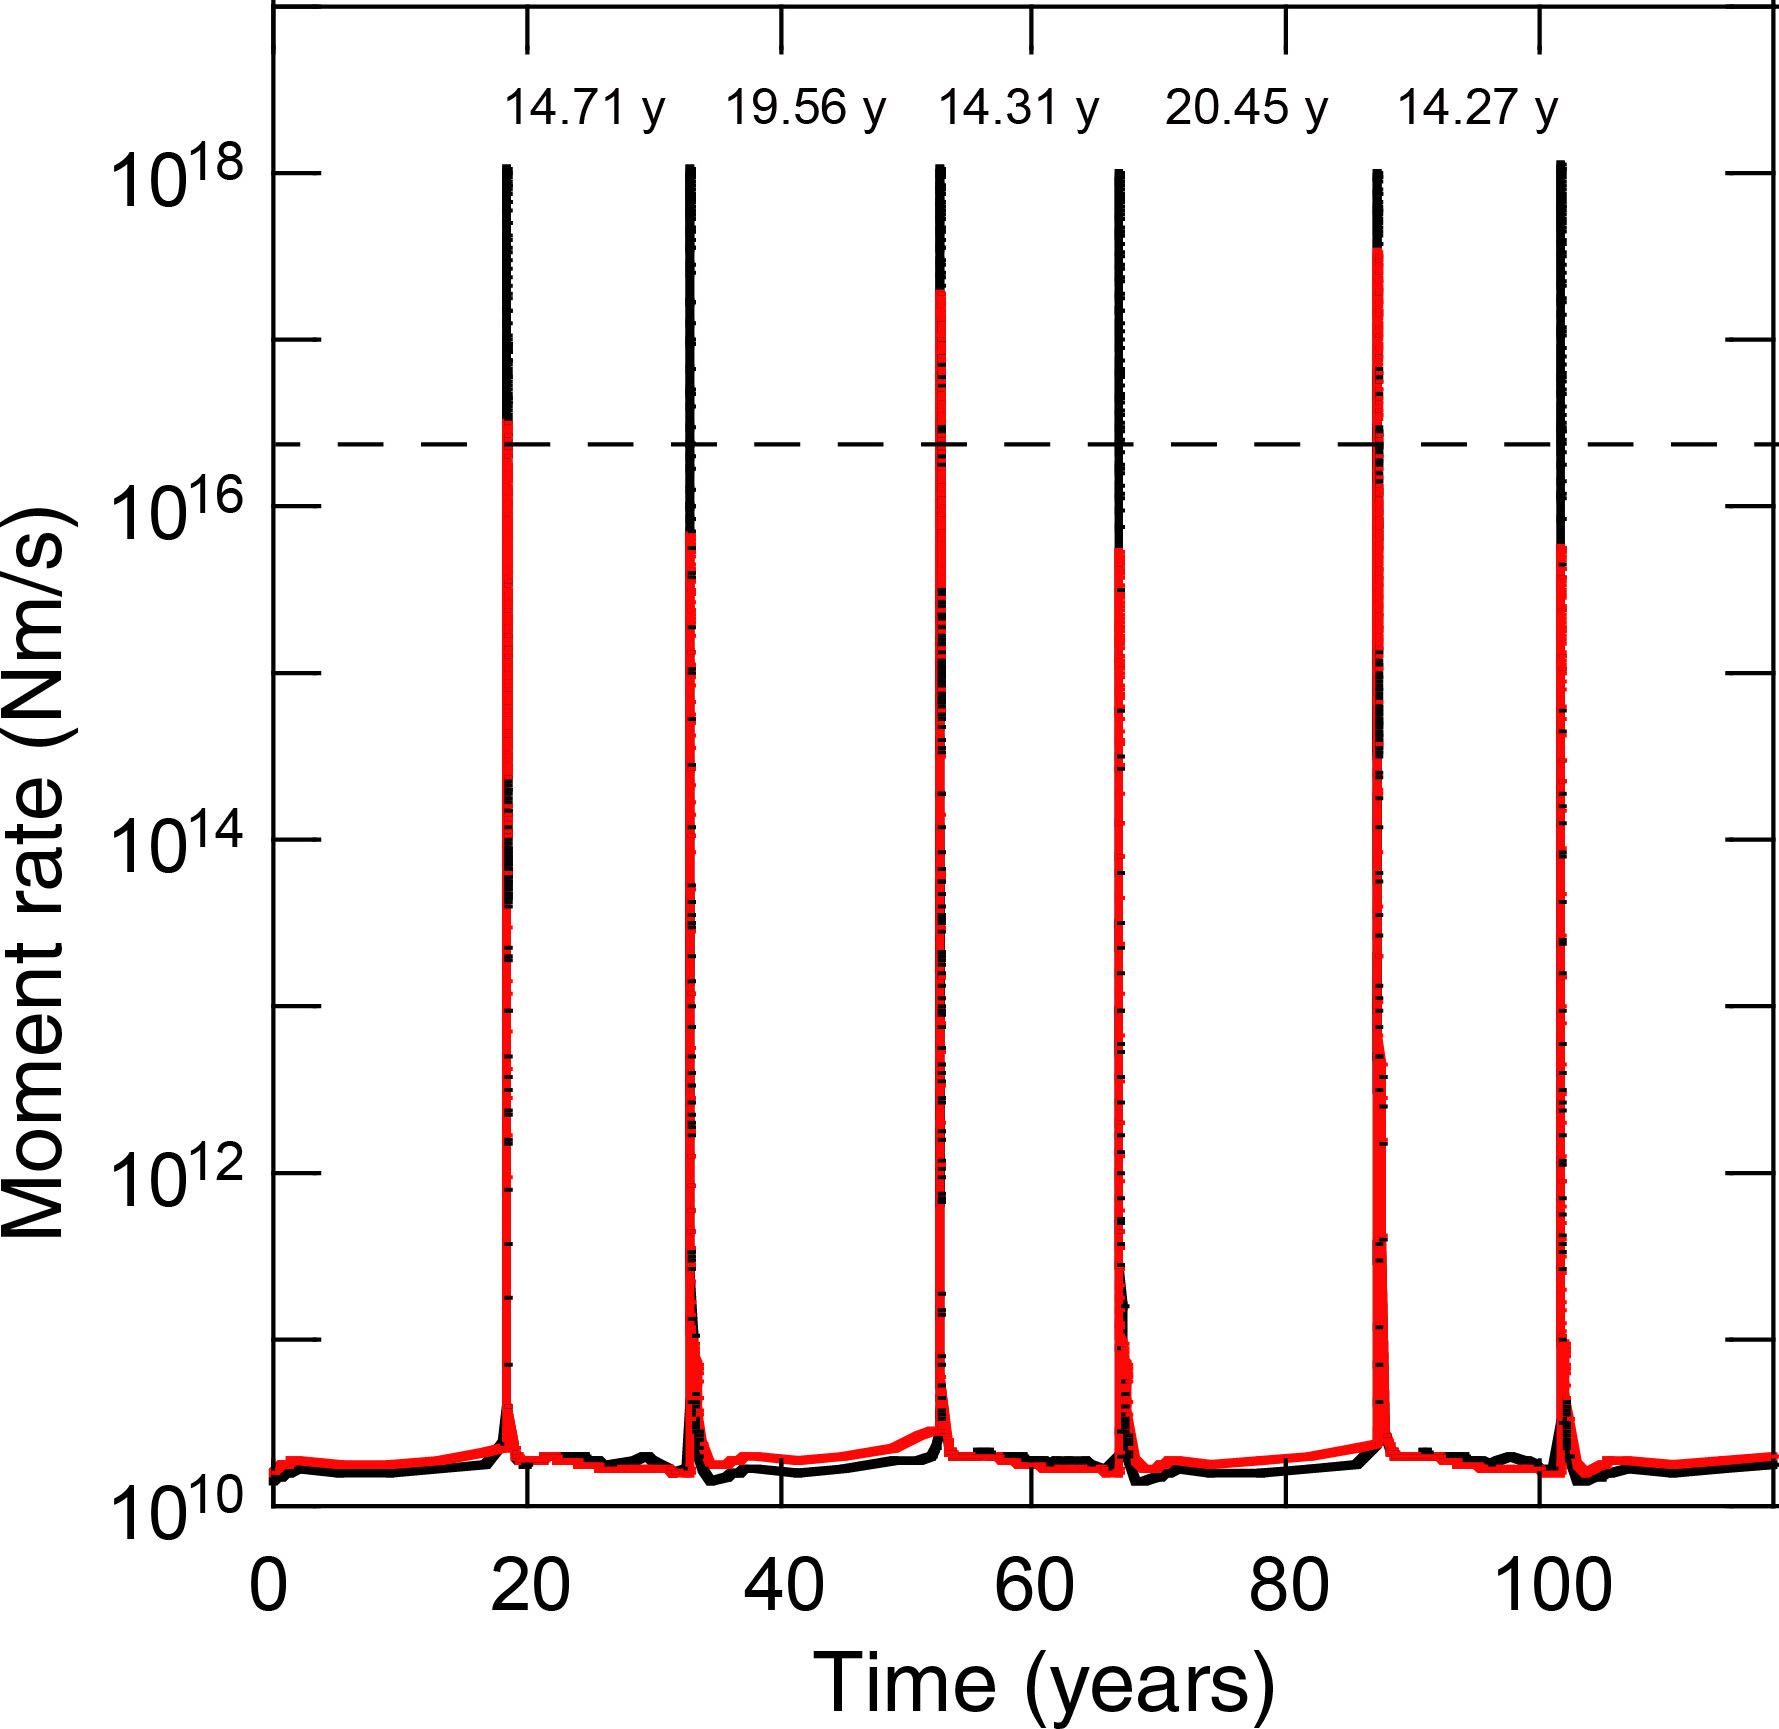
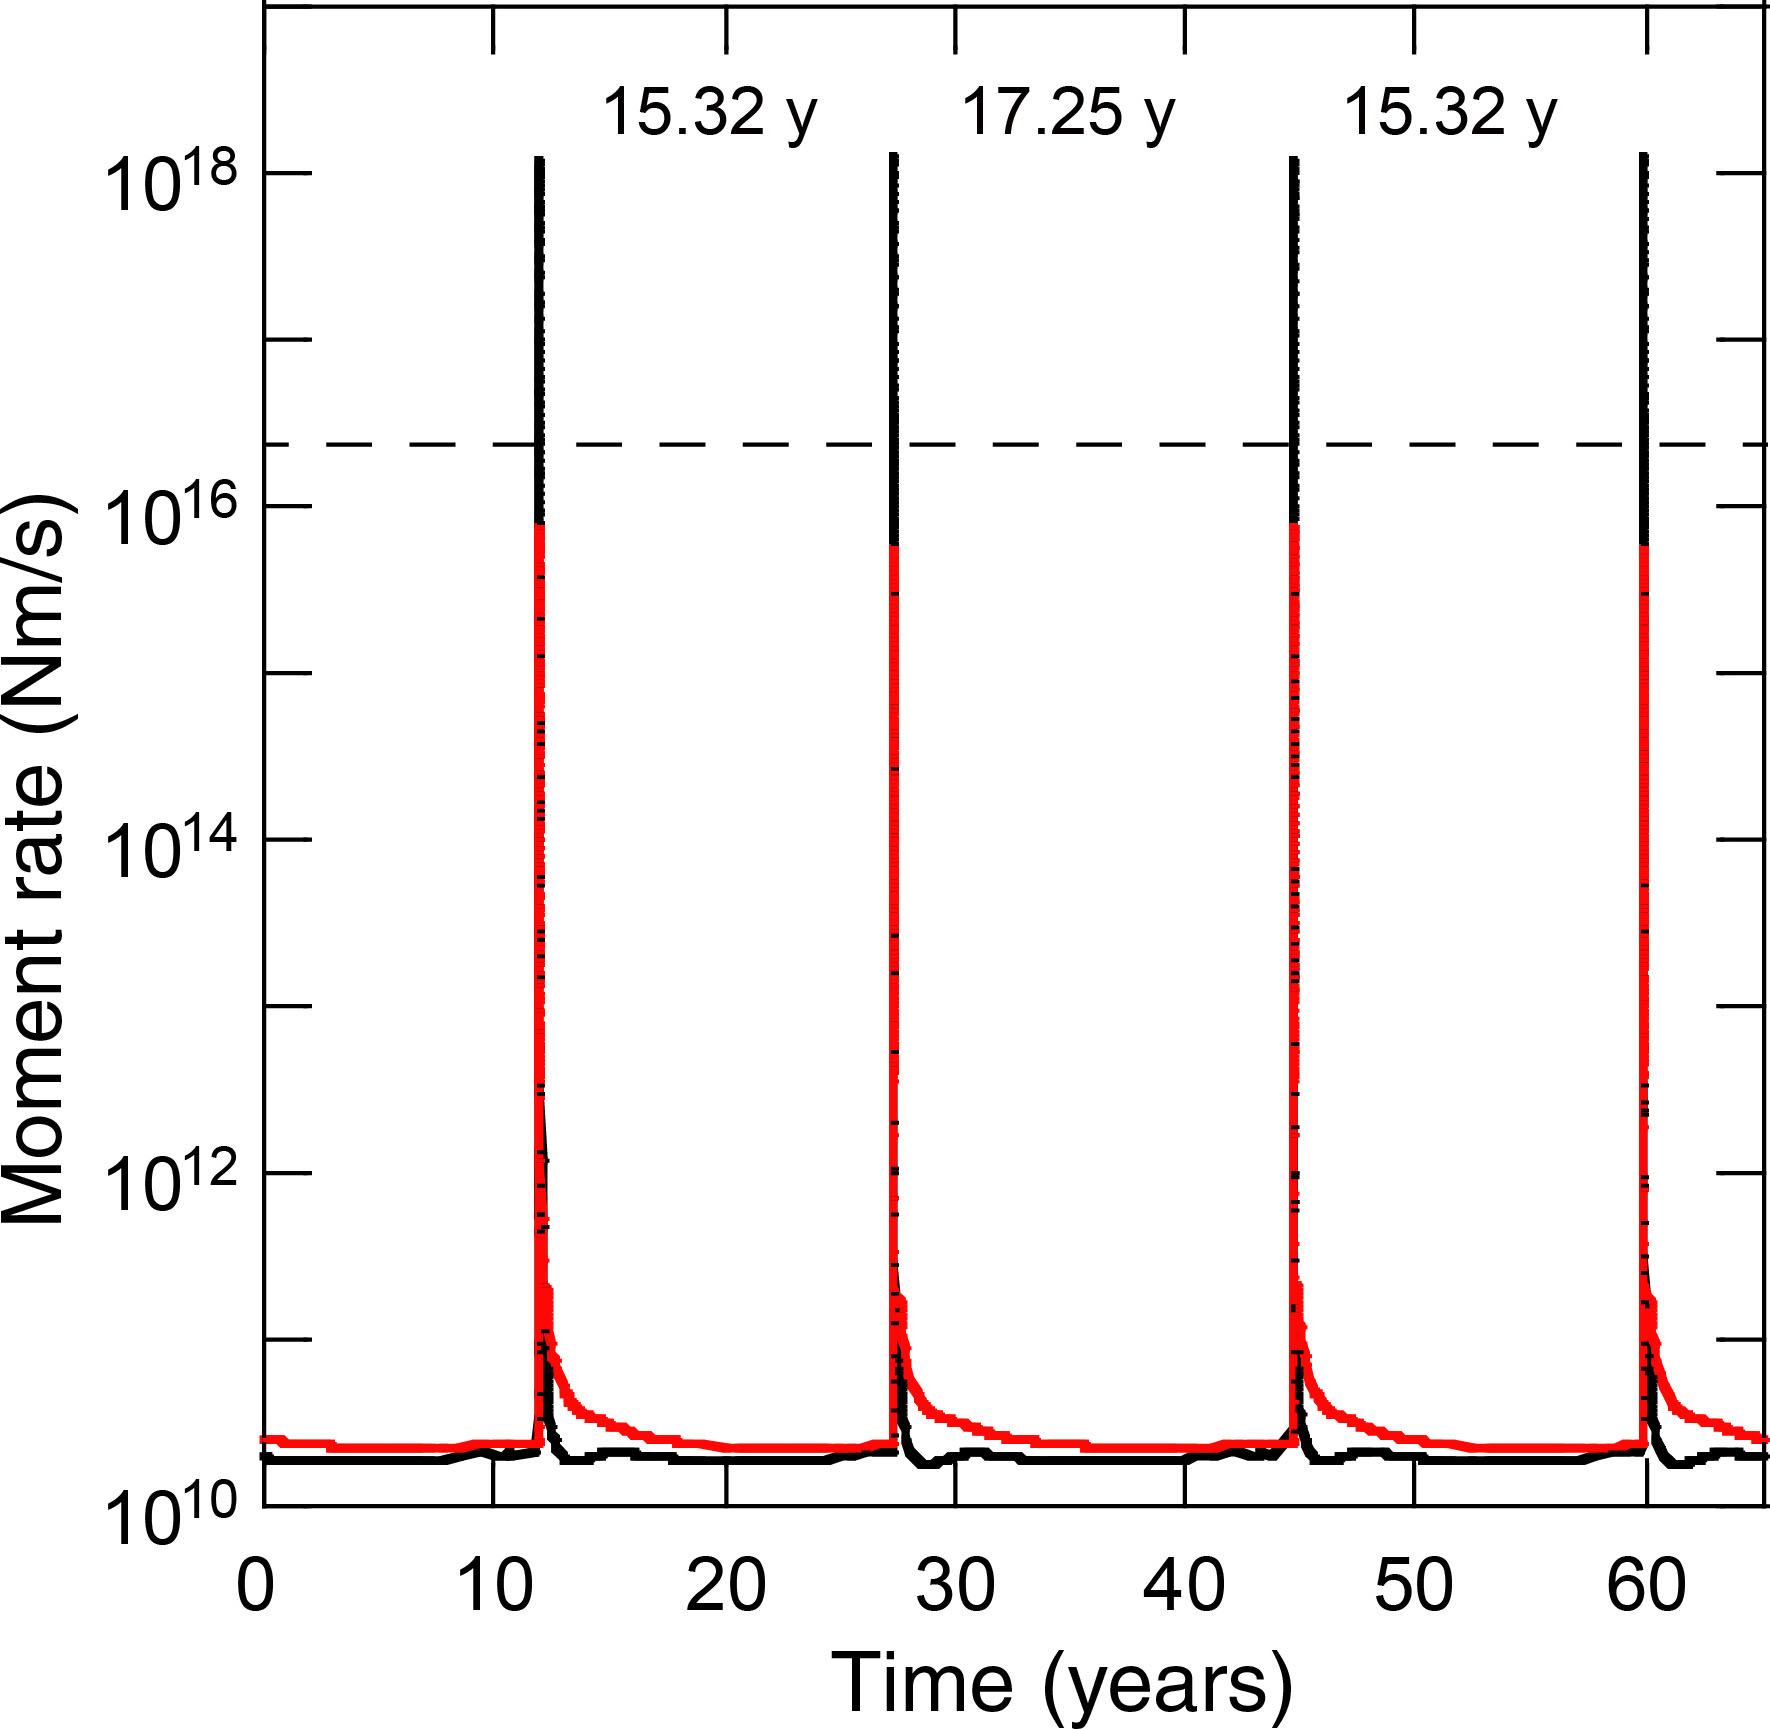
Figure S4. Simulated histories of moment release rate on the model fault plane for 0 ≤ x ≤ 12.8 km, including patch 1 (black), and for 12.8 ≤ x ≤ 25.6 km, including patch 2 (red), for D = 0 km and ΔL = 0.325 m. The time intervals between successive slip events are shown. For reference, the dashed line indicates the seismic moment rate at which the slip rate in the velocity-weakening patch is 0.01 m/s and that in the velocity-strengthening region is 0.1 m/y (=Vpl).
Figure S5. Simulated histories of moment release rate on the model fault plane for 0 ≤ x ≤ 12.8 km, including patch 1 (black), and for 12.8 ≤ x ≤ 25.6 km, including patch 2 (red), for D = 0 km and ΔL = 0.36 m. The time intervals between successive slip events are shown. For reference, the dashed line indicates the seismic moment rate at which the slip rate in the velocity-weakening patch is 0.01 m/s and that in the velocity-strengthening region is 0.1 m/y (=Vpl).
Figure S6. Simulated histories of moment release rate on the model fault plane for 0 ≤ x ≤ 12.8 km, including patch 1 (black), and for 12.8 ≤ x ≤ 25.6 km, including patch 2 (red), for D = 0 km and ΔL = 0.46 m. The time intervals between successive slip events are shown. For reference, the dashed line indicates the seismic moment rate at which the slip rate in the velocity-weakening patch is 0.01 m/s and that in the velocity-strengthening region is 0.1 m/y (=Vpl).
Figure S7. Simulated histories of moment release rate on the model fault plane for 0 ≤ x ≤ 12.8 km, including patch 1 (black), and for 12.8 ≤ x ≤ 25.6 km, including patch 2 (red), for D = 0 km and ΔL = 0.78 m. The time intervals between successive slip events are shown. For reference, the dashed line indicates the seismic moment rate at which the slip rate in the velocity-weakening patch is 0.01 m/s and that in the velocity-strengthening region is 0.1 m/y (=Vpl).
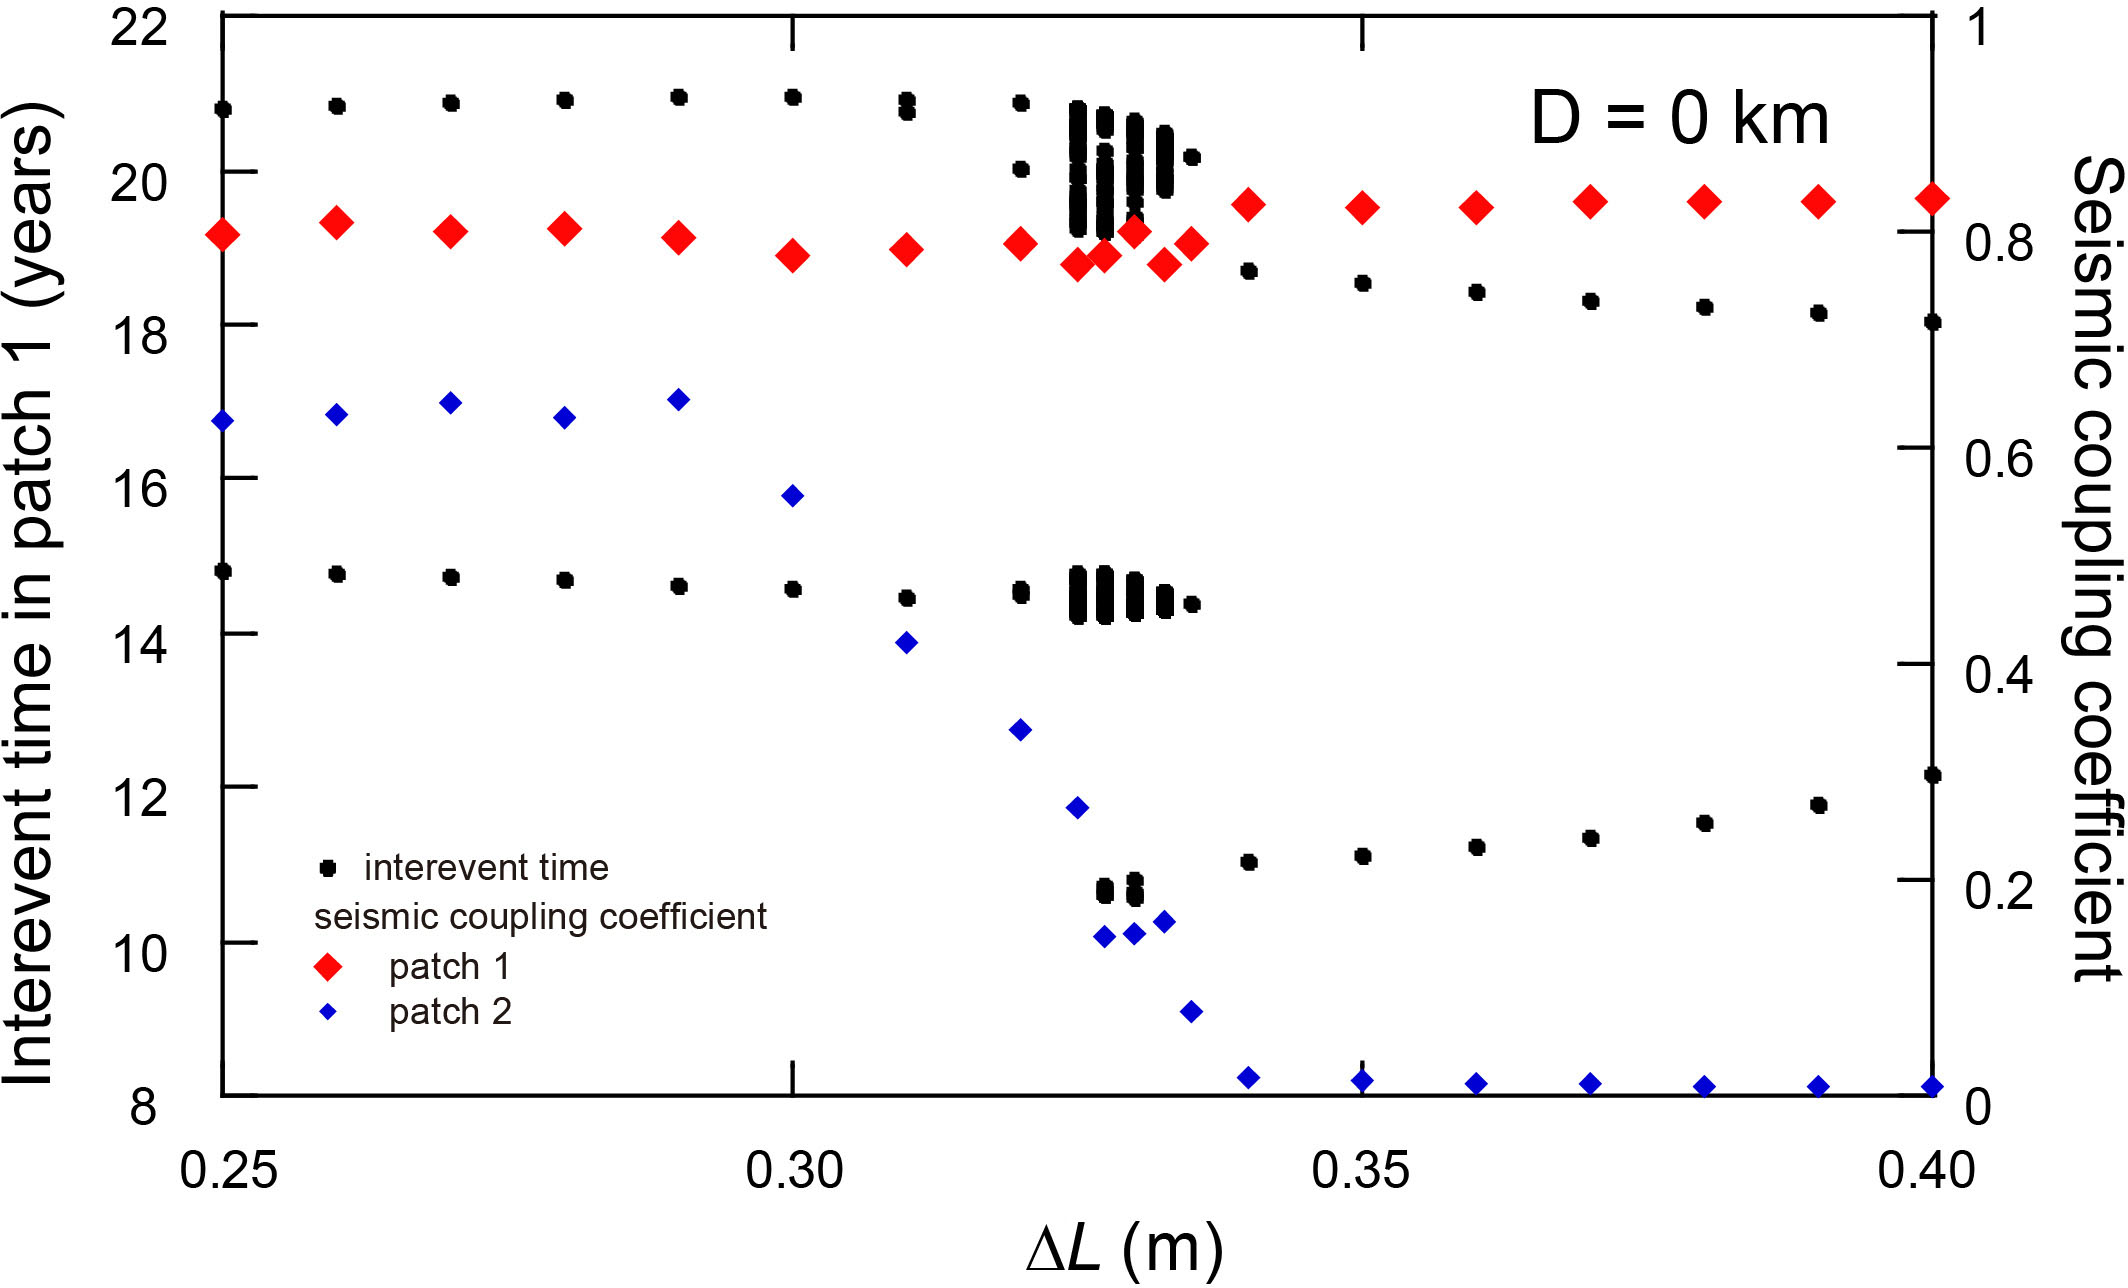
Figure S8. Recurrence interval T of simulated slip events in patch 1 (solid circles) versus ΔL, the difference in characteristic slip distance between the two patches, together with seismic coupling coefficients in patches 1 and 2 (large and small diamonds) for 0.25 ≤ ΔL ≤ 0.40 m for D = 0 km.
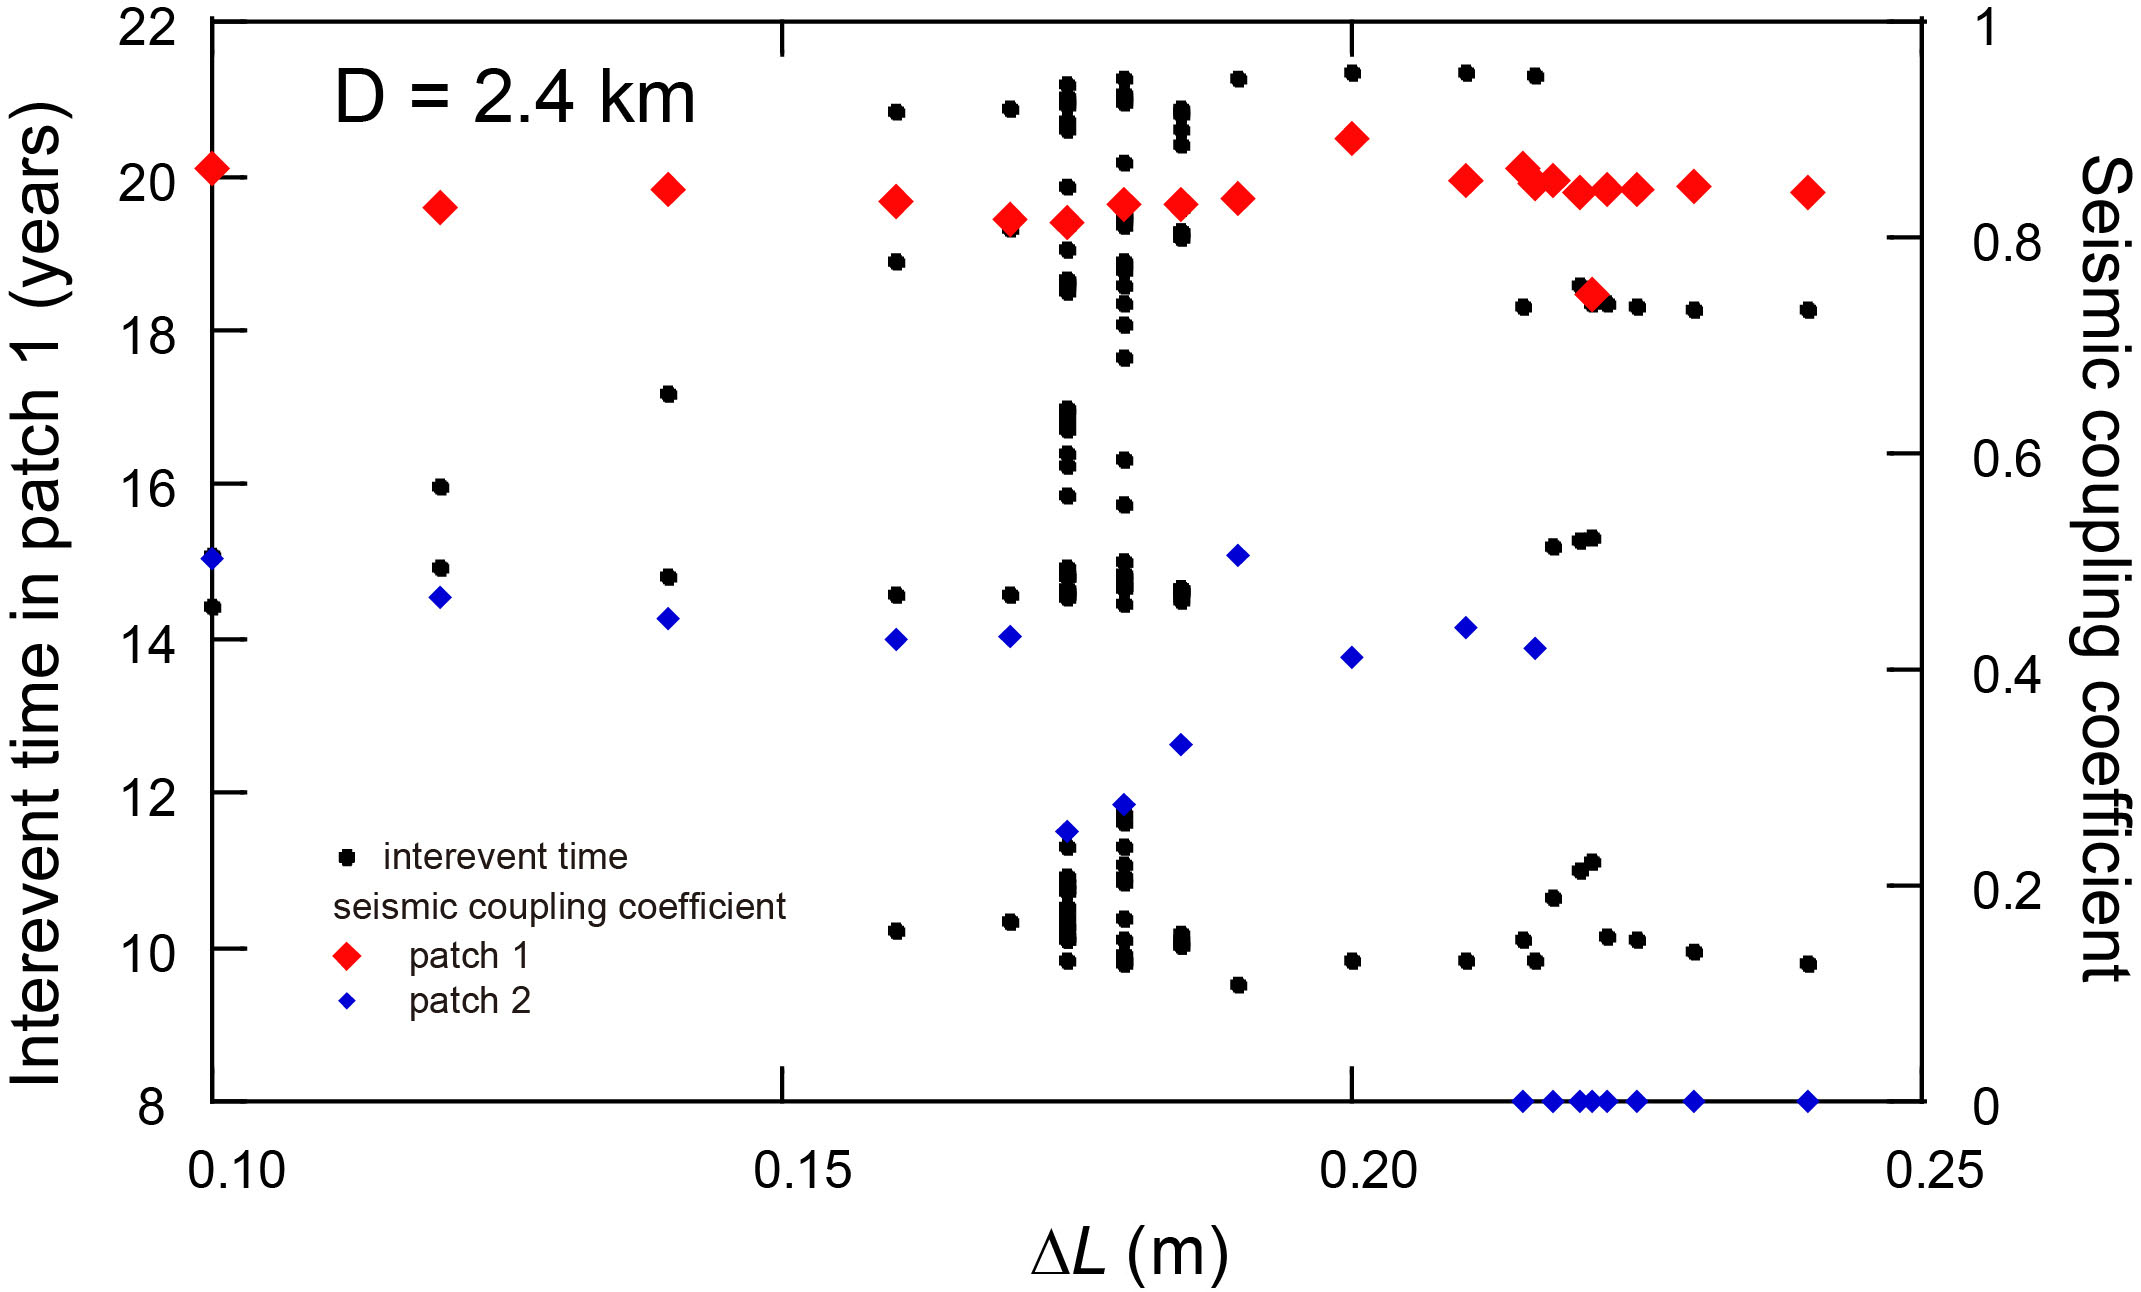
Figure S9. Recurrence interval T of simulated slip events in patch 1 (solid circles) versus ΔL, the difference in characteristic slip distance between the two patches, together with seismic coupling coefficients in patches 1 and 2 (large and small diamonds) for 0.10 ≤ ΔL ≤ 0.25 m for D = 2.4 km.
[ Back ]