This electronic supplement contains tables of event information and a figure showing waveforms overlaid with amplitude windows. Tables S1–S3 provide source information for events used in this study. Figure S1 is a sample seismogram showing windows used for amplitude measurements.
For Tables S1–S3, events marked with an asterisk (*) are the most widely recorded and largest events, as used in Figures 6 and 10 of the main article.
Table S1 [Plain Text Comma-separated Values; 1 KB]. Source information for earthquake events used in this study.
Table S2 [Plain Text Comma-separated Values; 1 KB]. Source information for borehole shots used in this study.
Table S3 [Plain Text Comma-separated Values; 2 KB]. Source information for mining events used in this study.
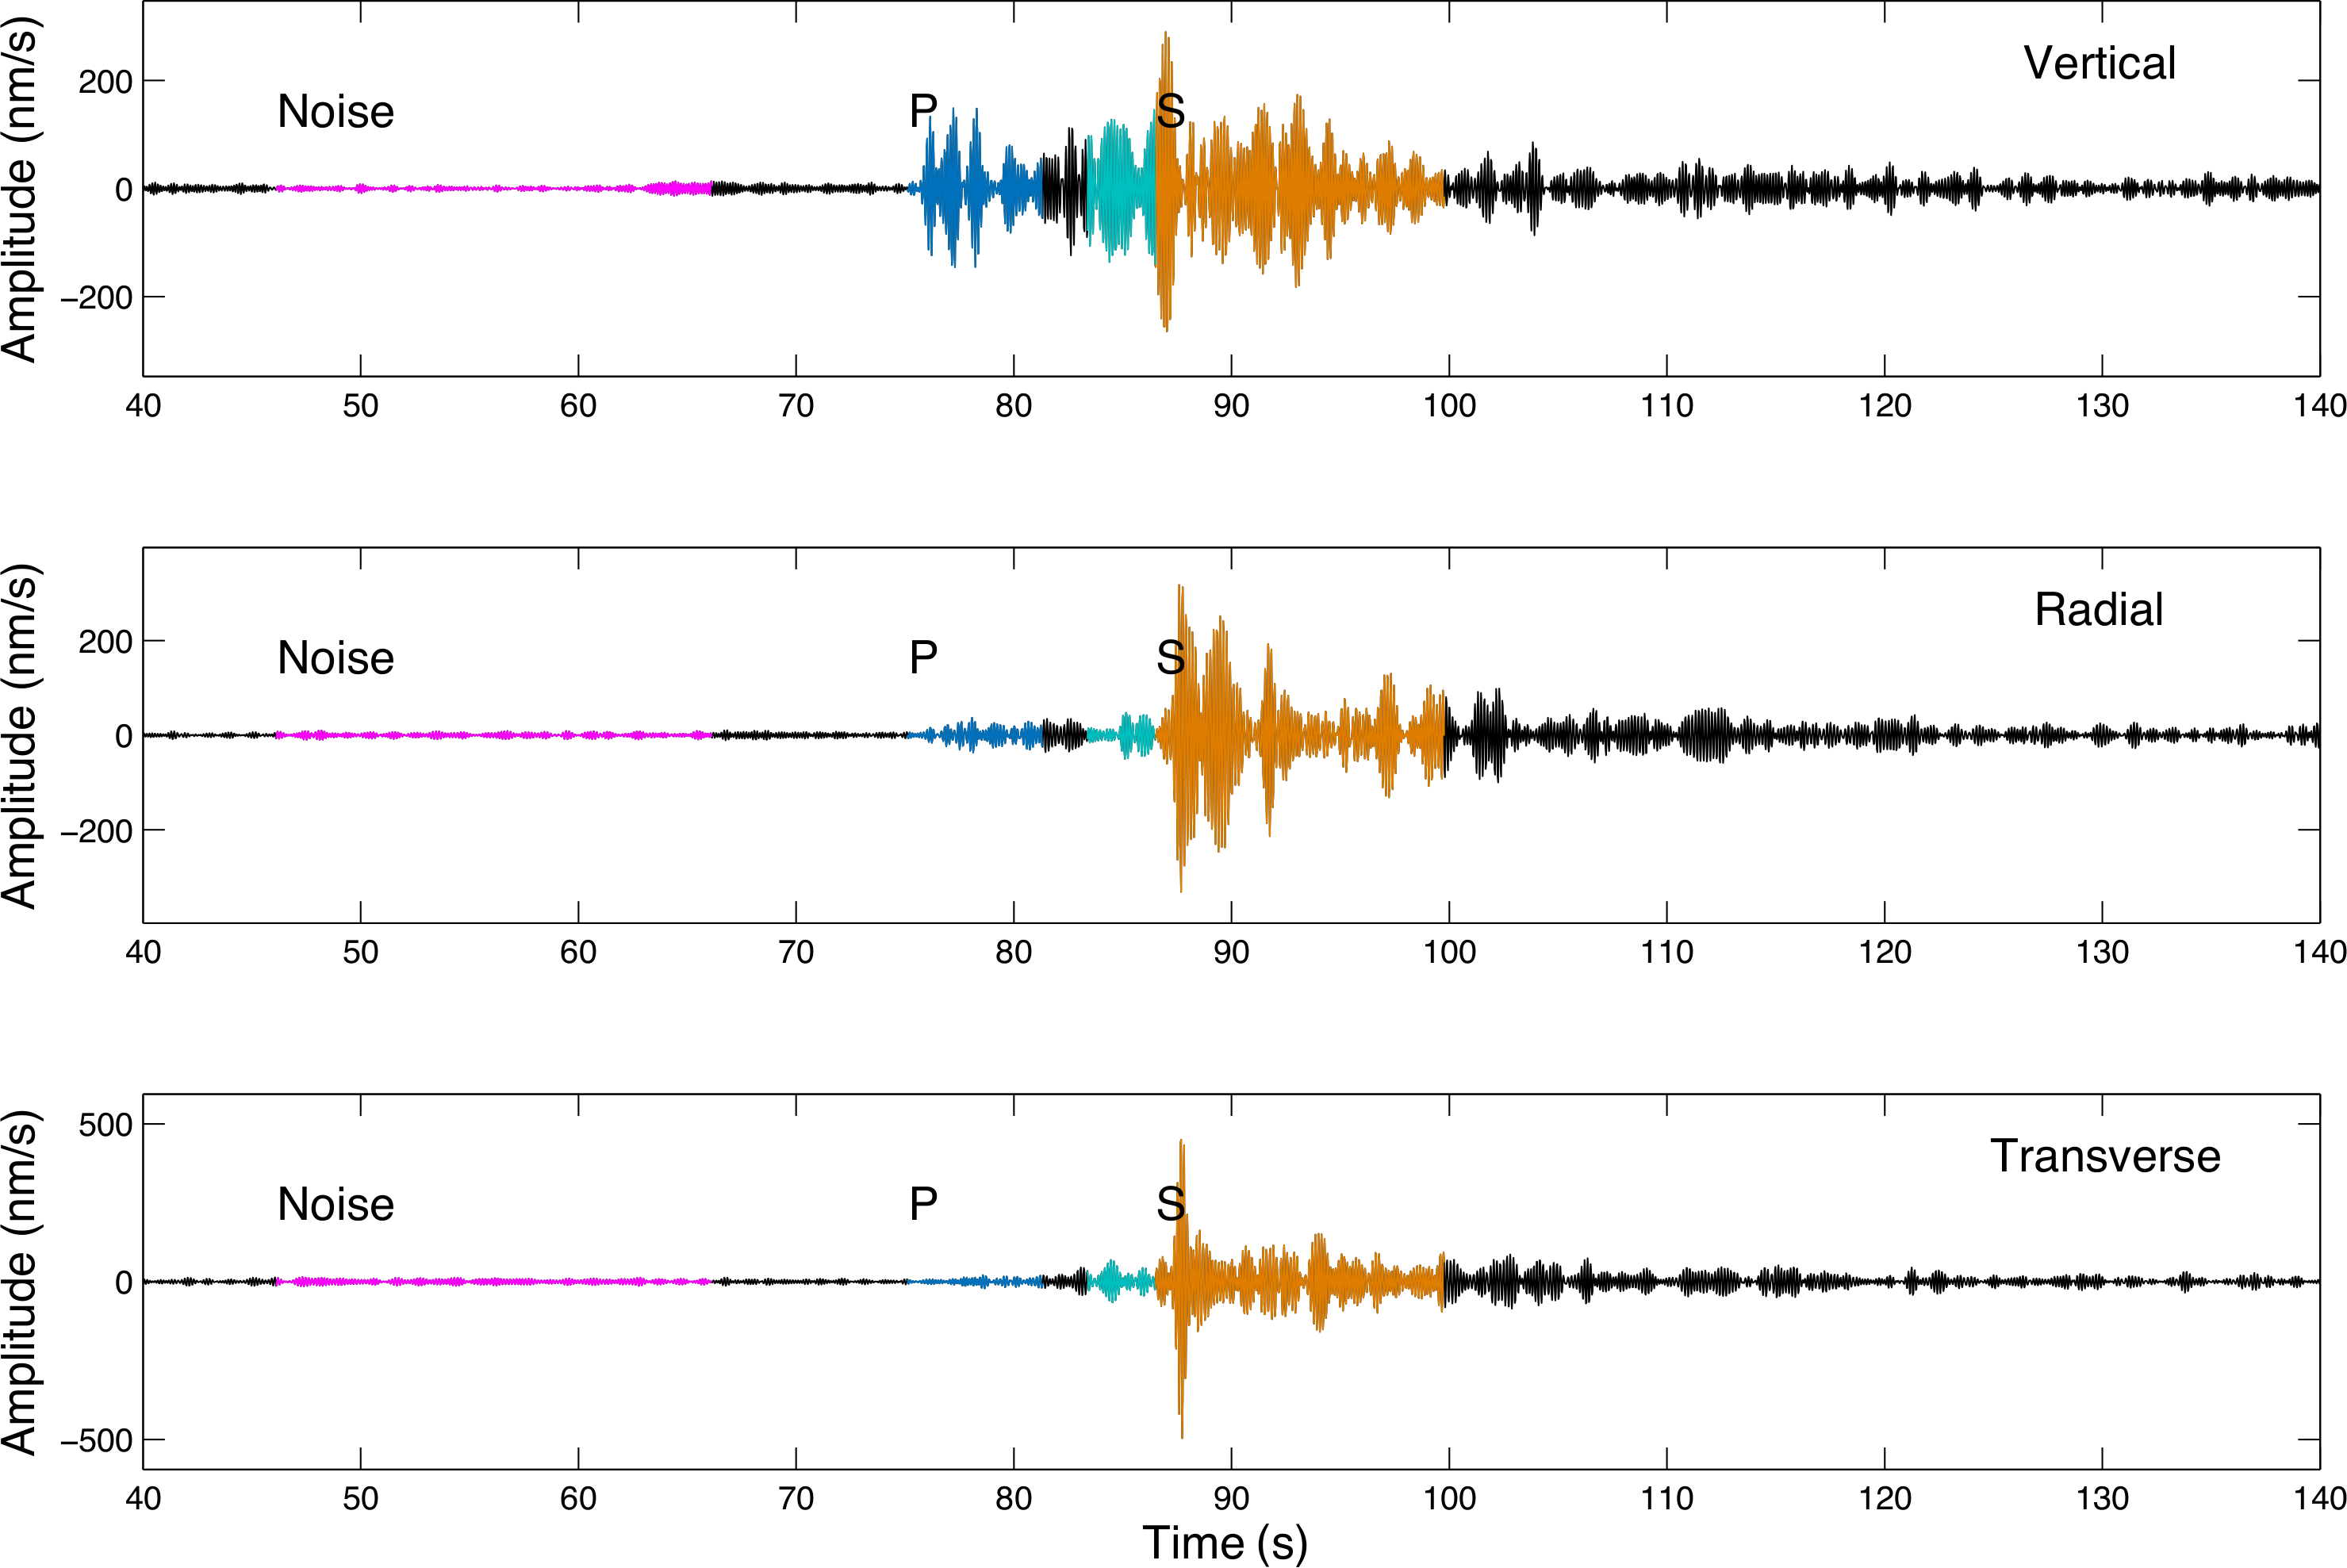
Figure S1. Waveforms overlaid with typical amplitude windows used in this study. Data from a 14-km-deep, magnitude 1.8 (ML) earthquake (2010/09/04 08:30:07) were recorded at a station 90 km away and filtered with a 6–8 Hz bandpass. Origin time is at 60 s. Magenta window, pre-event noise; dark blue, P arrival and coda; teal, pre-S and P codas; orange, S arrival and immediate coda.
[ Back ]