This electronic supplement includes 18 figures. Figures S1–S6 depict the results of liquefaction analysis for all investigated sites in case of recorded earthquakes (Mw 5.2 and 6.7). Details of the analysis are discussed in the main article. Figures S7–S18 depict the results of liquefaction analysis for some of the investigated sites in case of hypothetical 1894 Atalanti earthquake. Scenarios were produced for the earthquakes with magnitude values equal to 6.7, 6.9, 7.0, and 7.2. The details of the analysis are discussed in the main article as well.
Figure S1. Acceleration response spectra at the six investigated sites (a) base (input) motion and (b) predicted surface motion. Case of the recorded event with Mw 5.2.
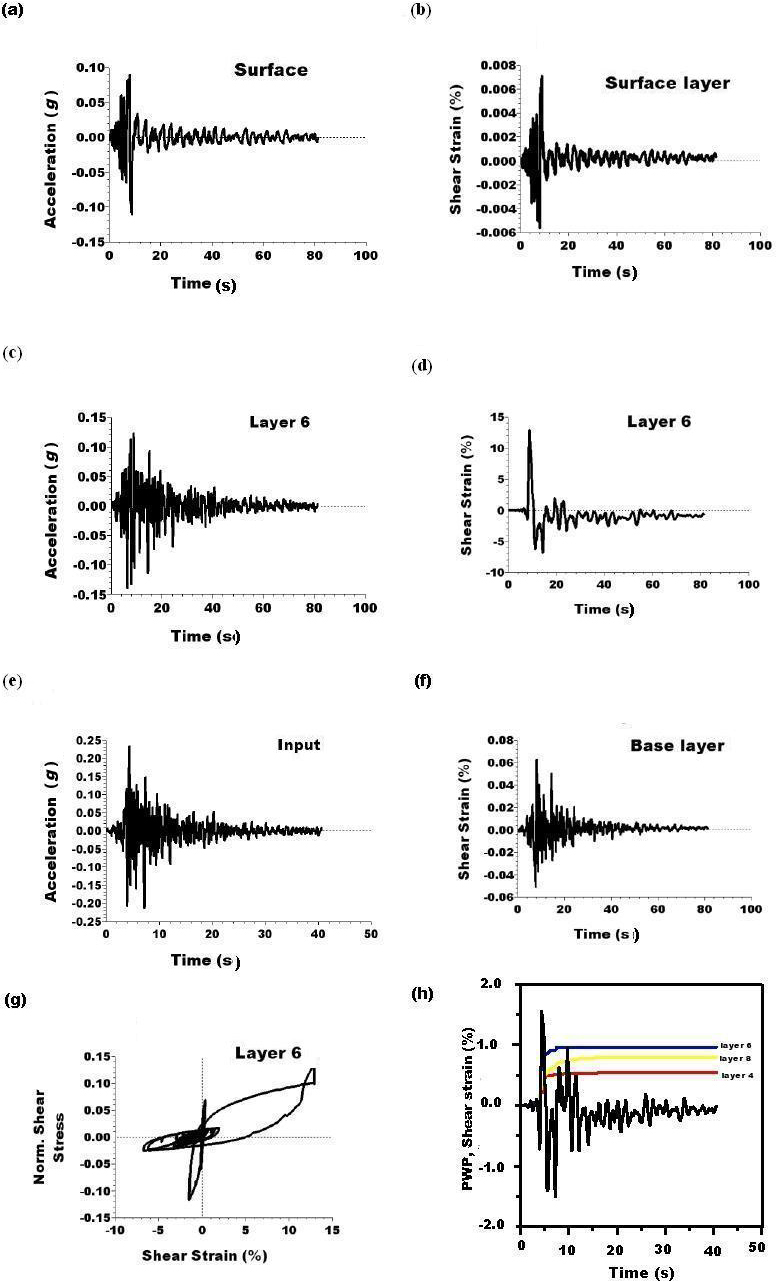
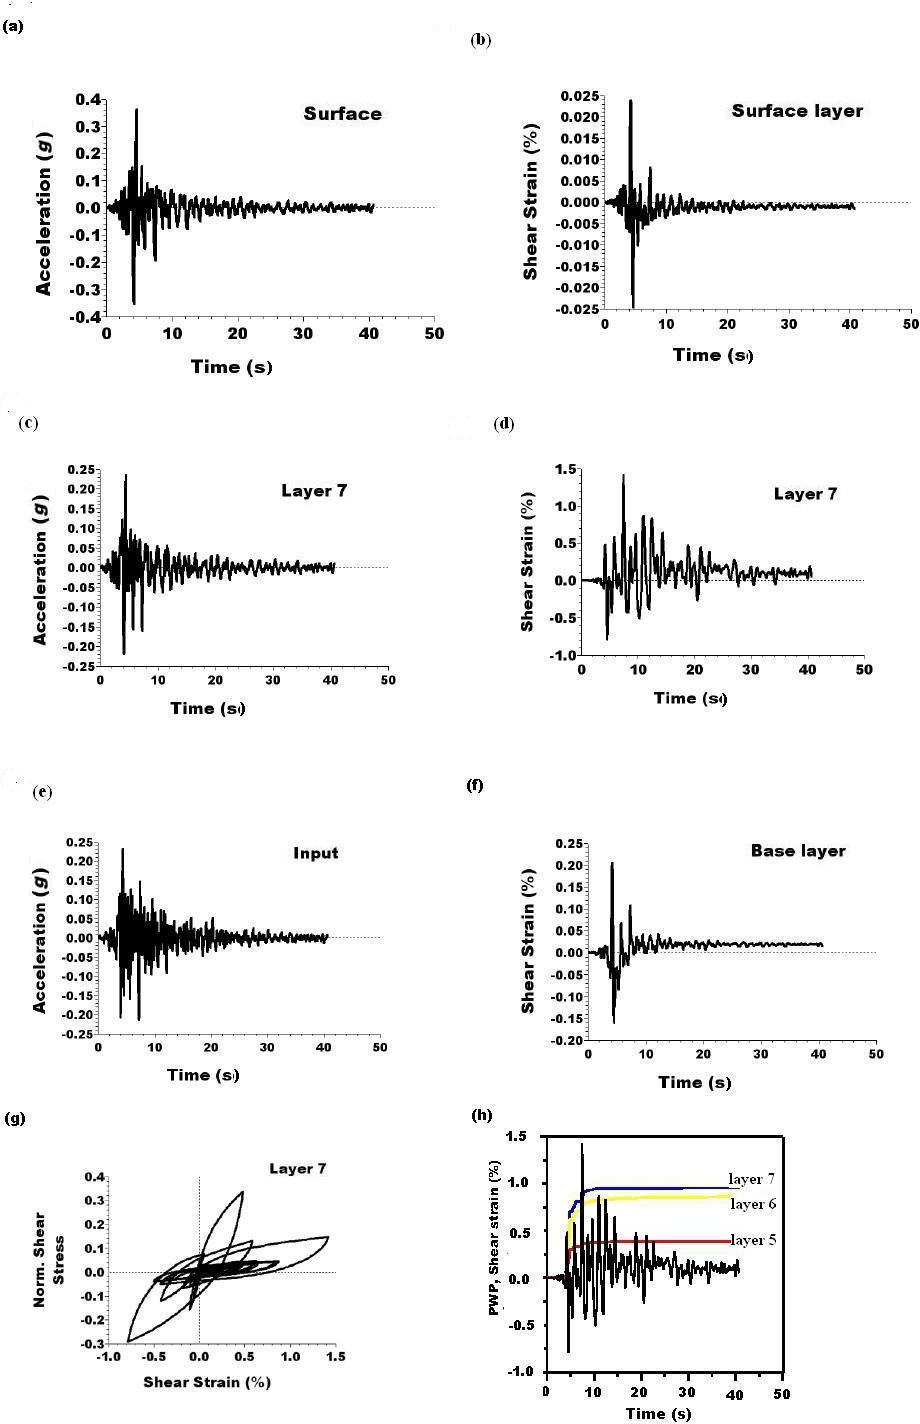
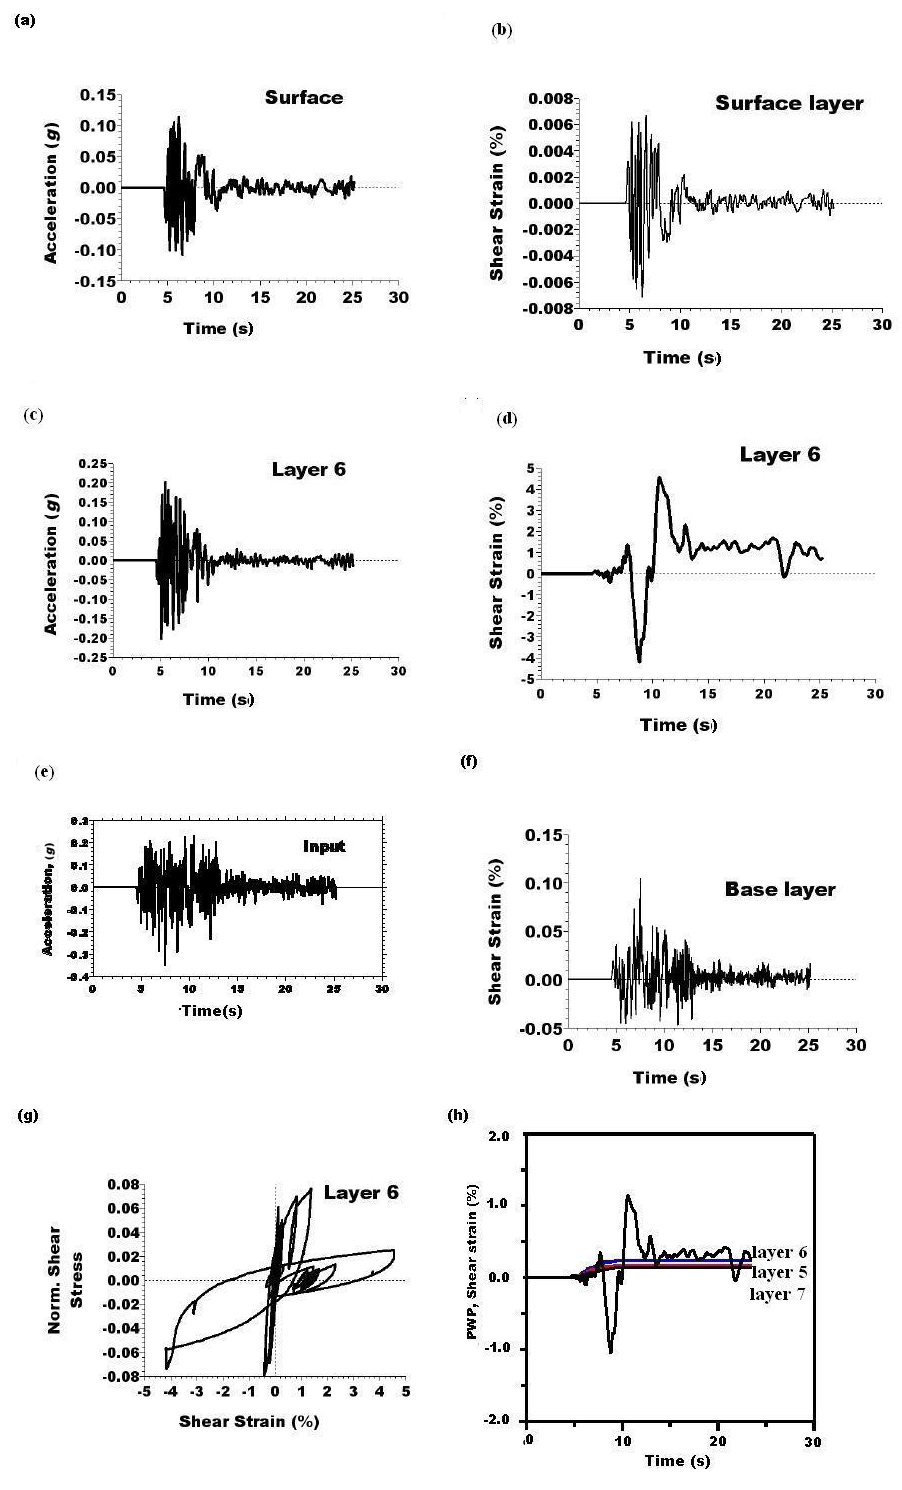
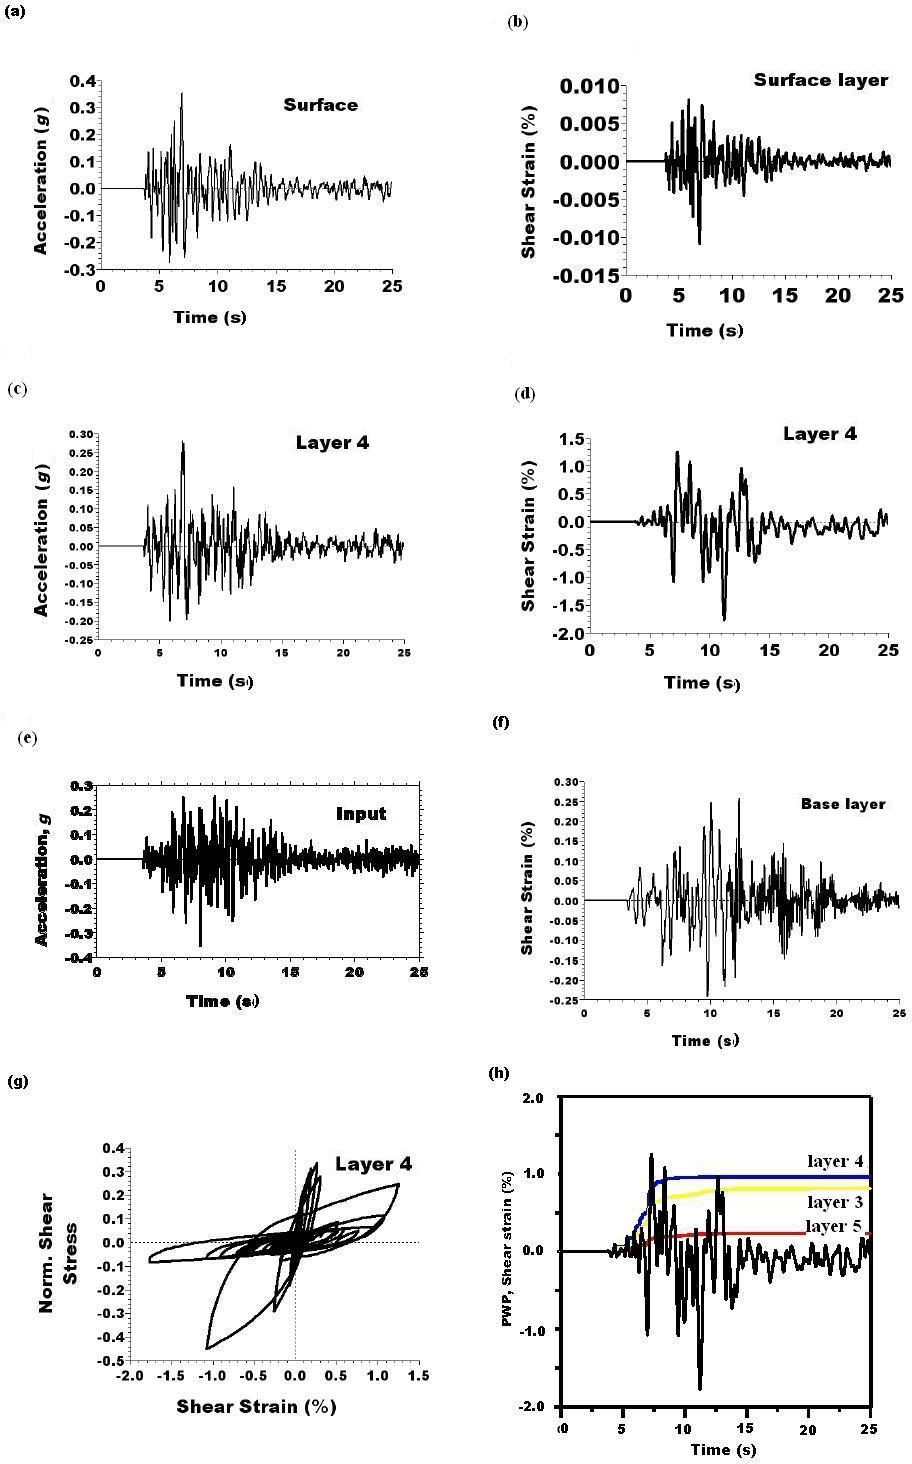
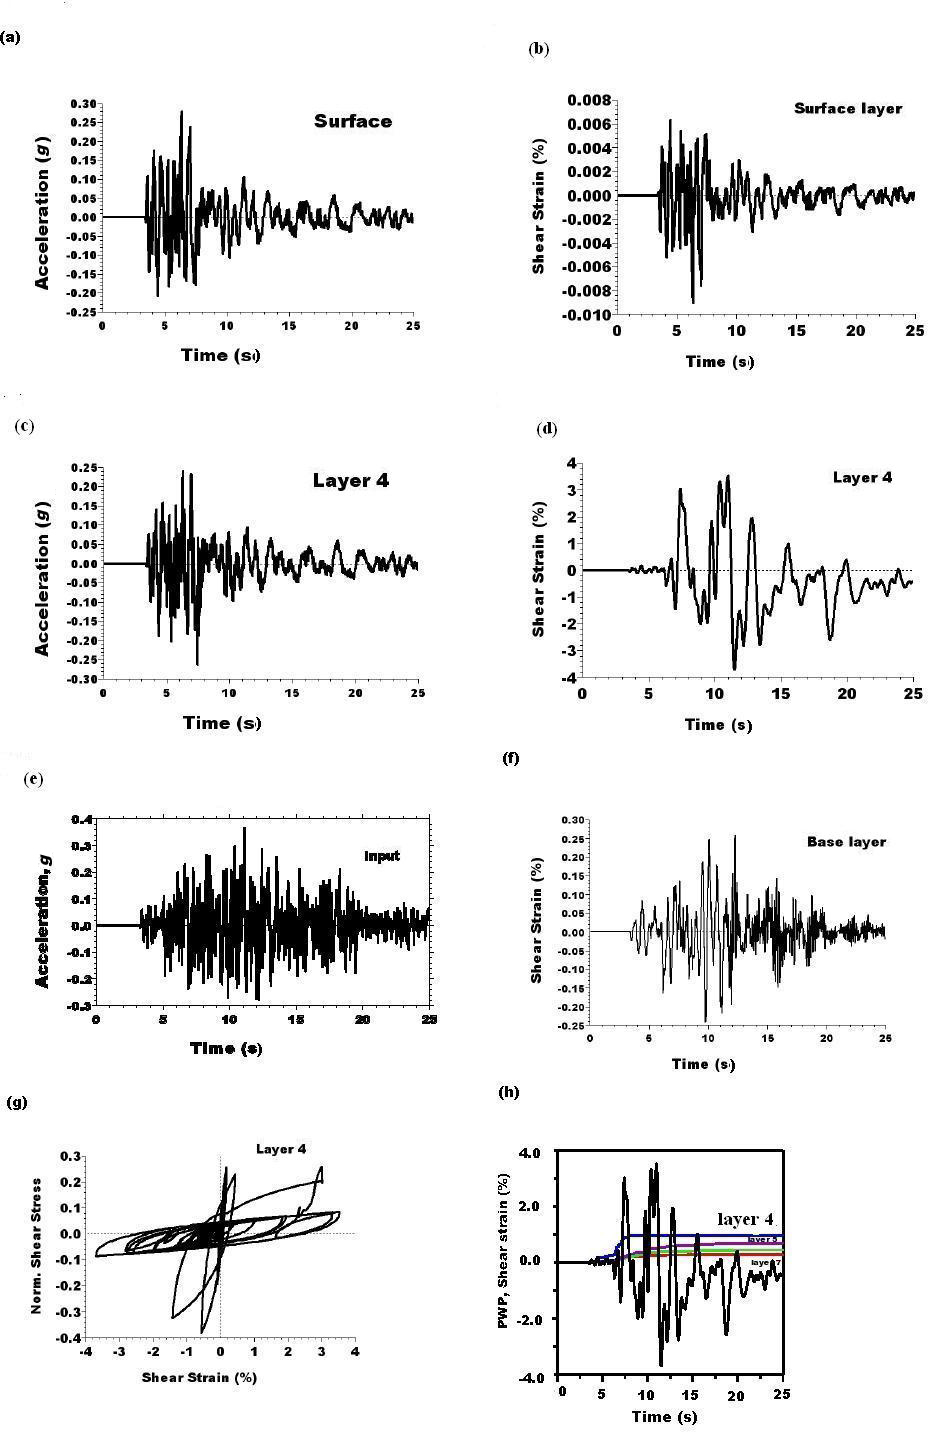
Figure S2. (a,c,e) Acceleration and (b,d,f) strain time histories at different ground level. (g) Stress–strain history for the layer with high probability to liquefy. (h) Pore-water pressure (PWP) time histories at different ground level and shear-strain time history for the layer with high probability to liquefy. Case of the recorded earthquake with Mw 6.7 (EE′ site).
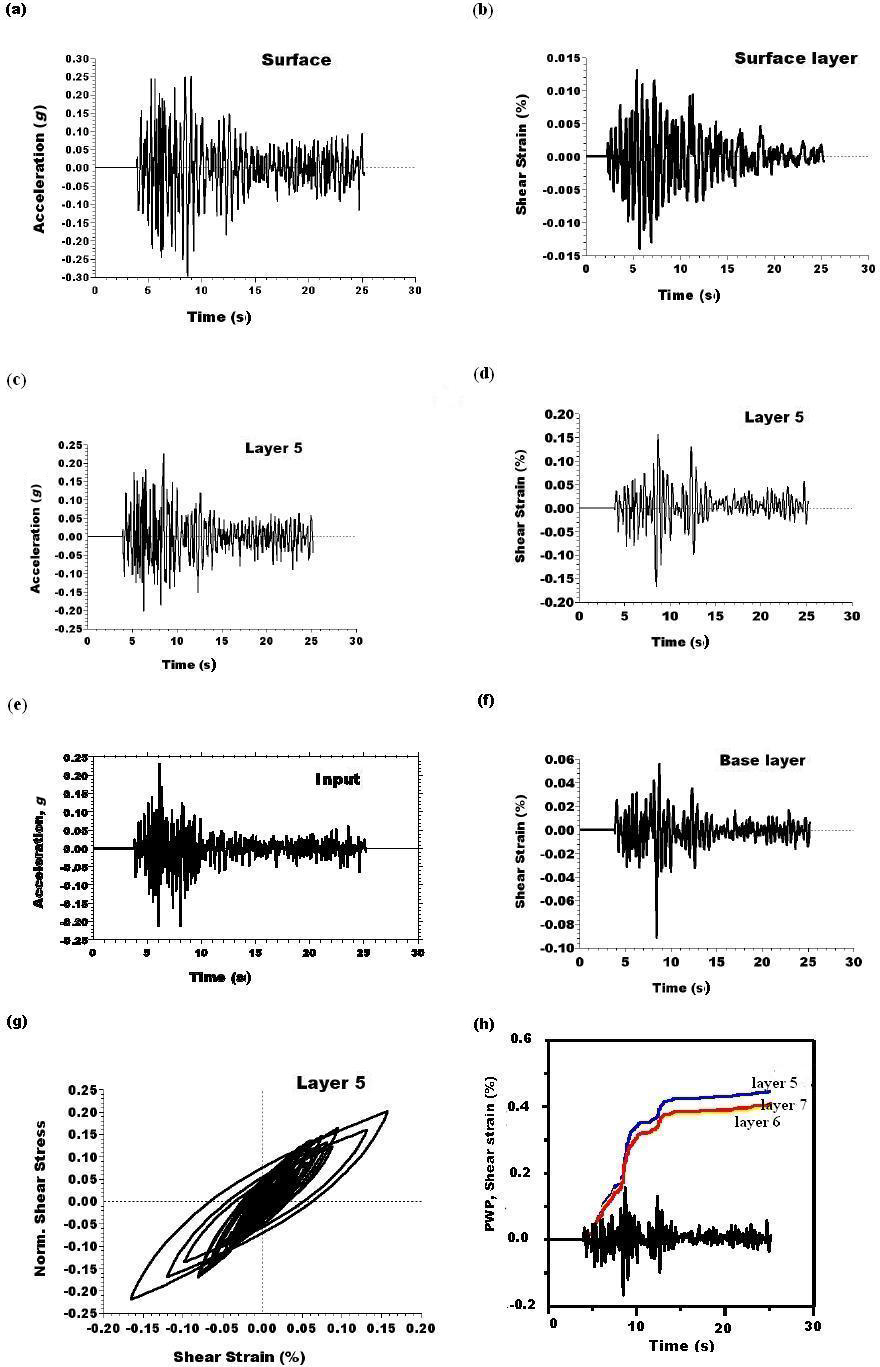
Figure S3. (a,c,e) Acceleration and (b,d,f) strain time histories at different ground level. (g) Stress–strain history for the layer with high probability to liquefy. (h) PWP time histories at different ground level and shear-strain time history for the layer with high probability to liquefy. Case of the recorded earthquake with Mw 6.7 (OO′ site).
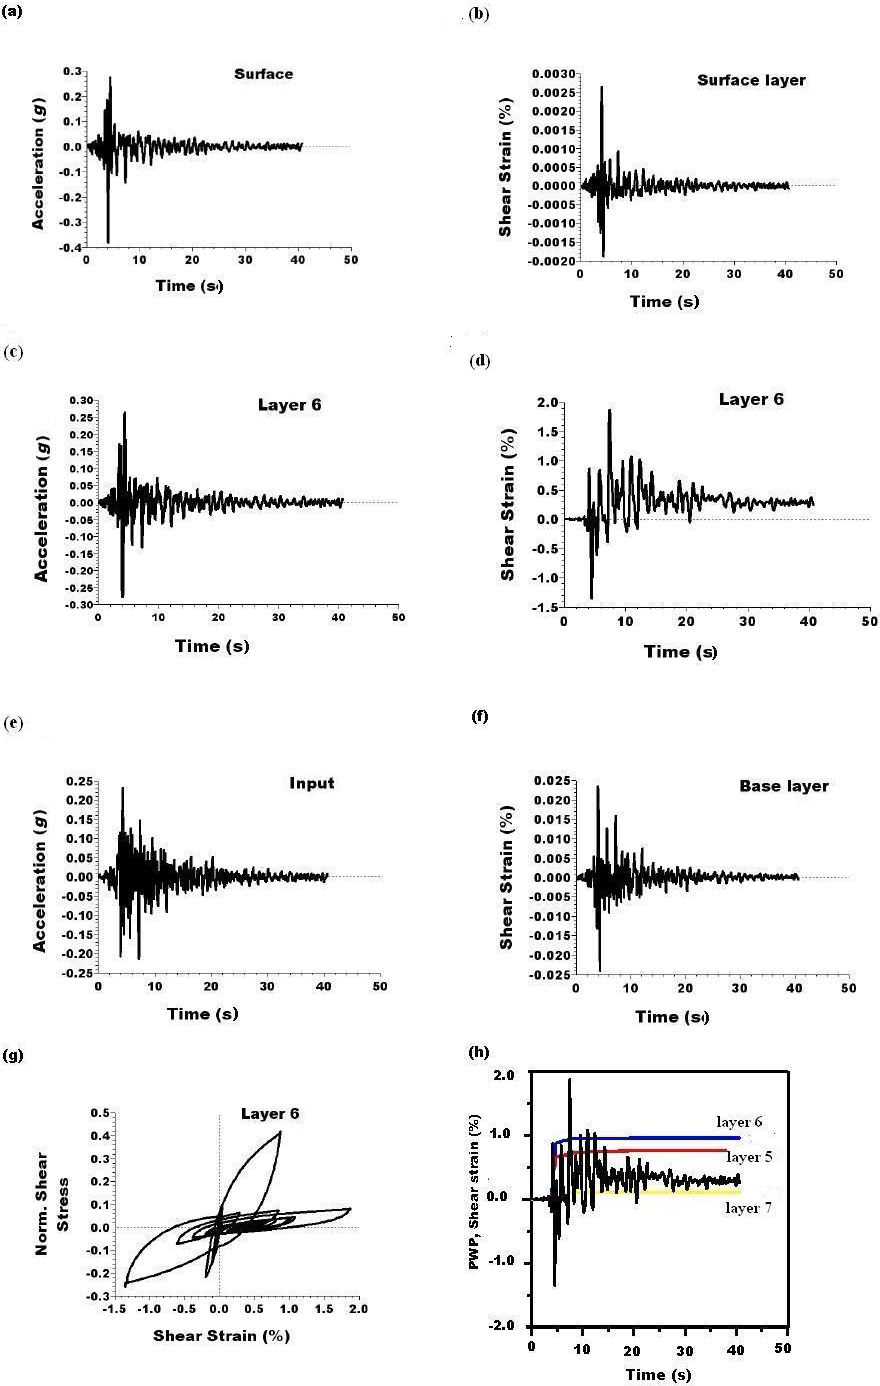
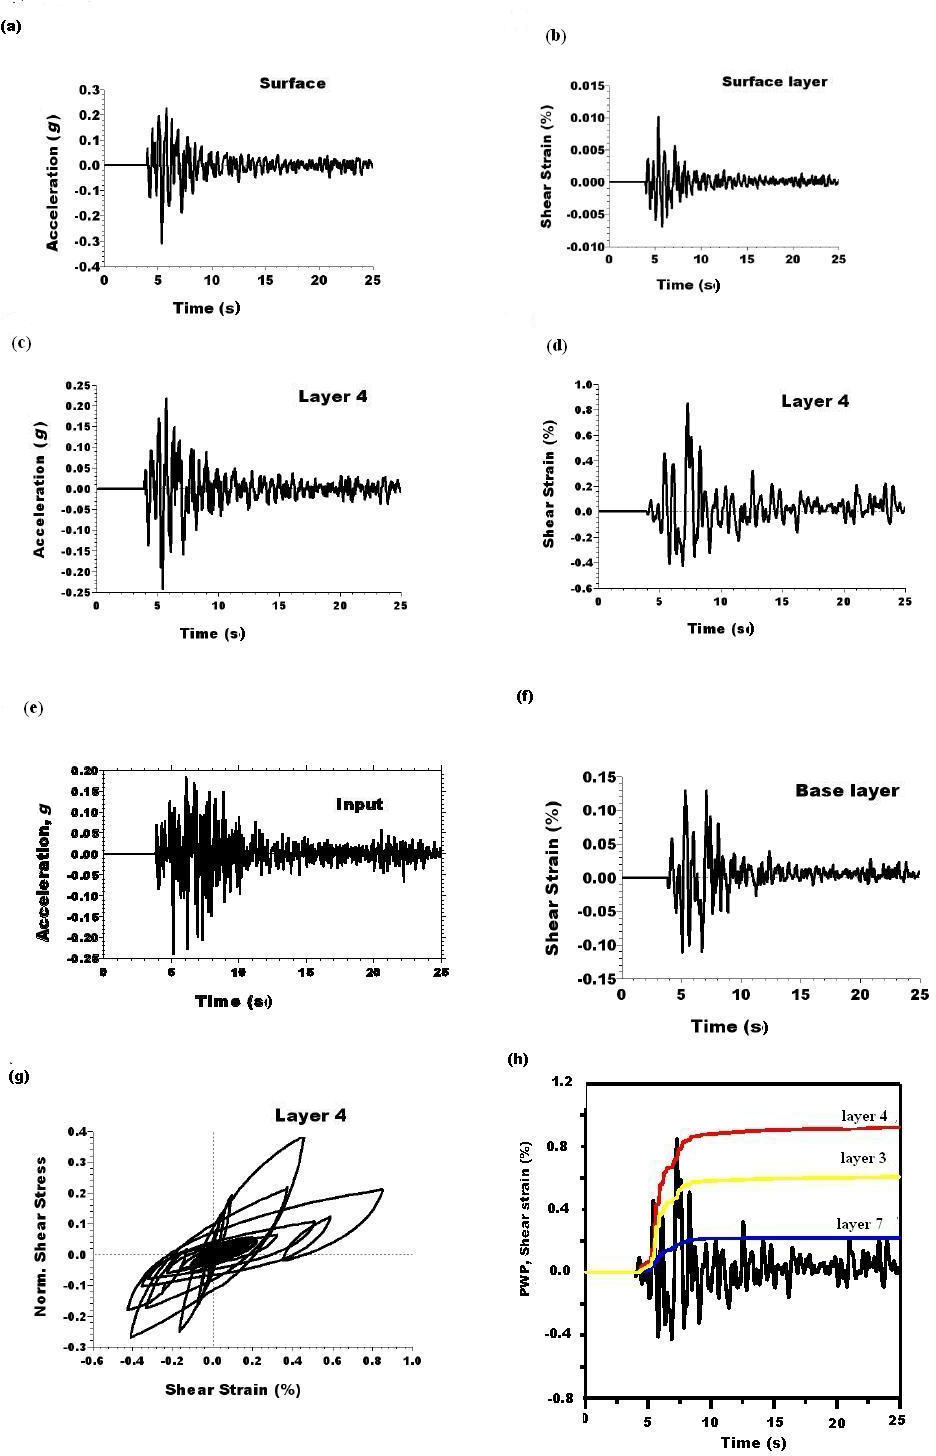
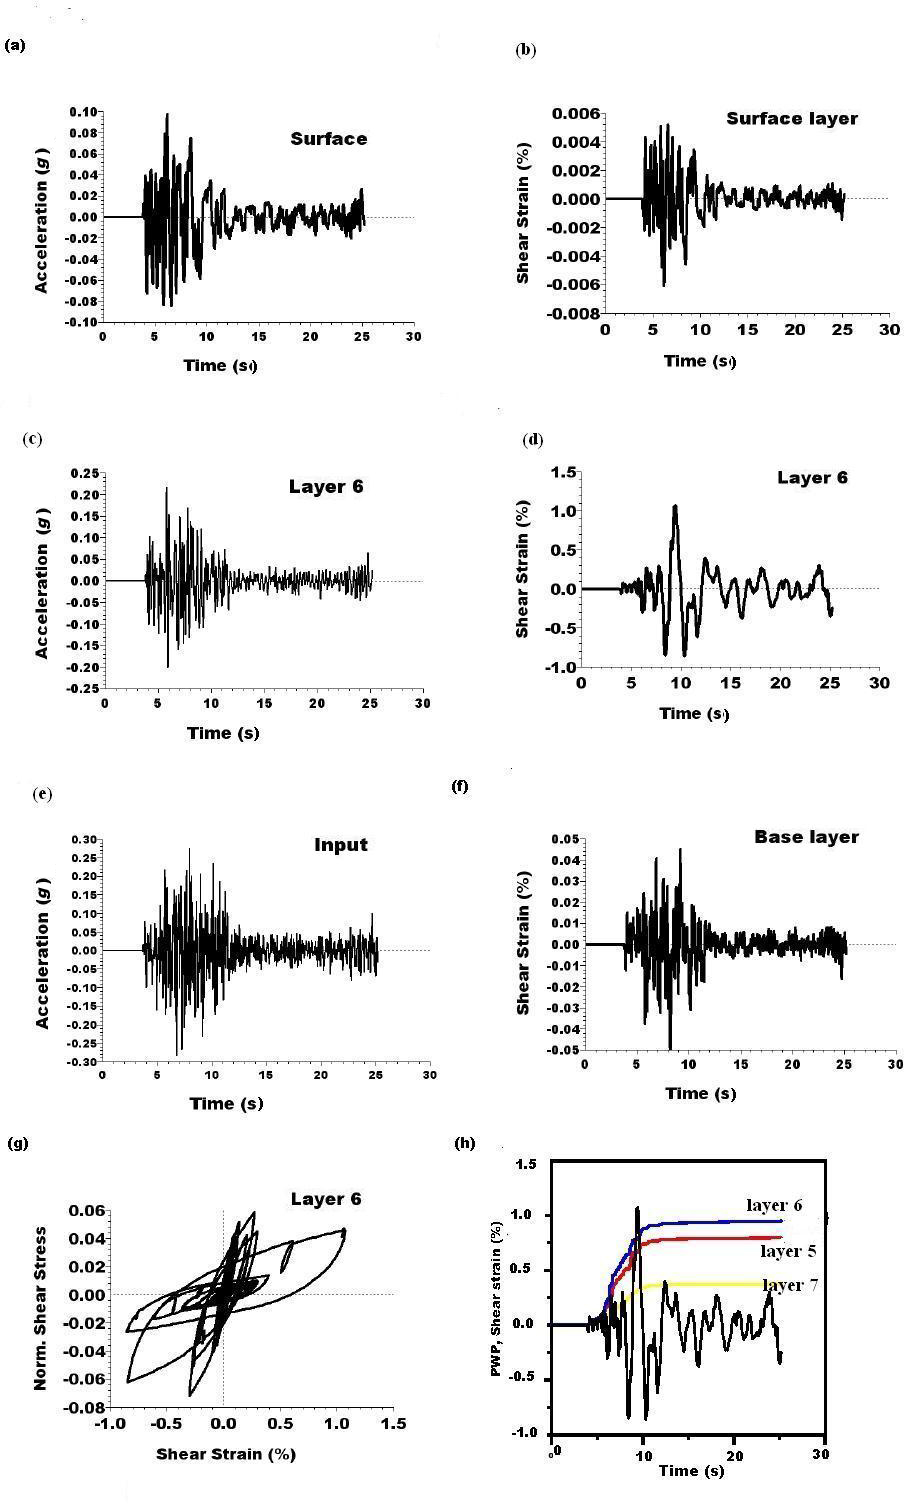
Figure S4. (a,c,e) Acceleration and (b,d,f) strain time histories at different ground level. (g) Stress–strain history for the liquefiable layer. (h) PWP time histories at different ground level and shear-strain time history for the liquefiable layer. Case of the recorded earthquake with Mw 6.7 (GG′ site).
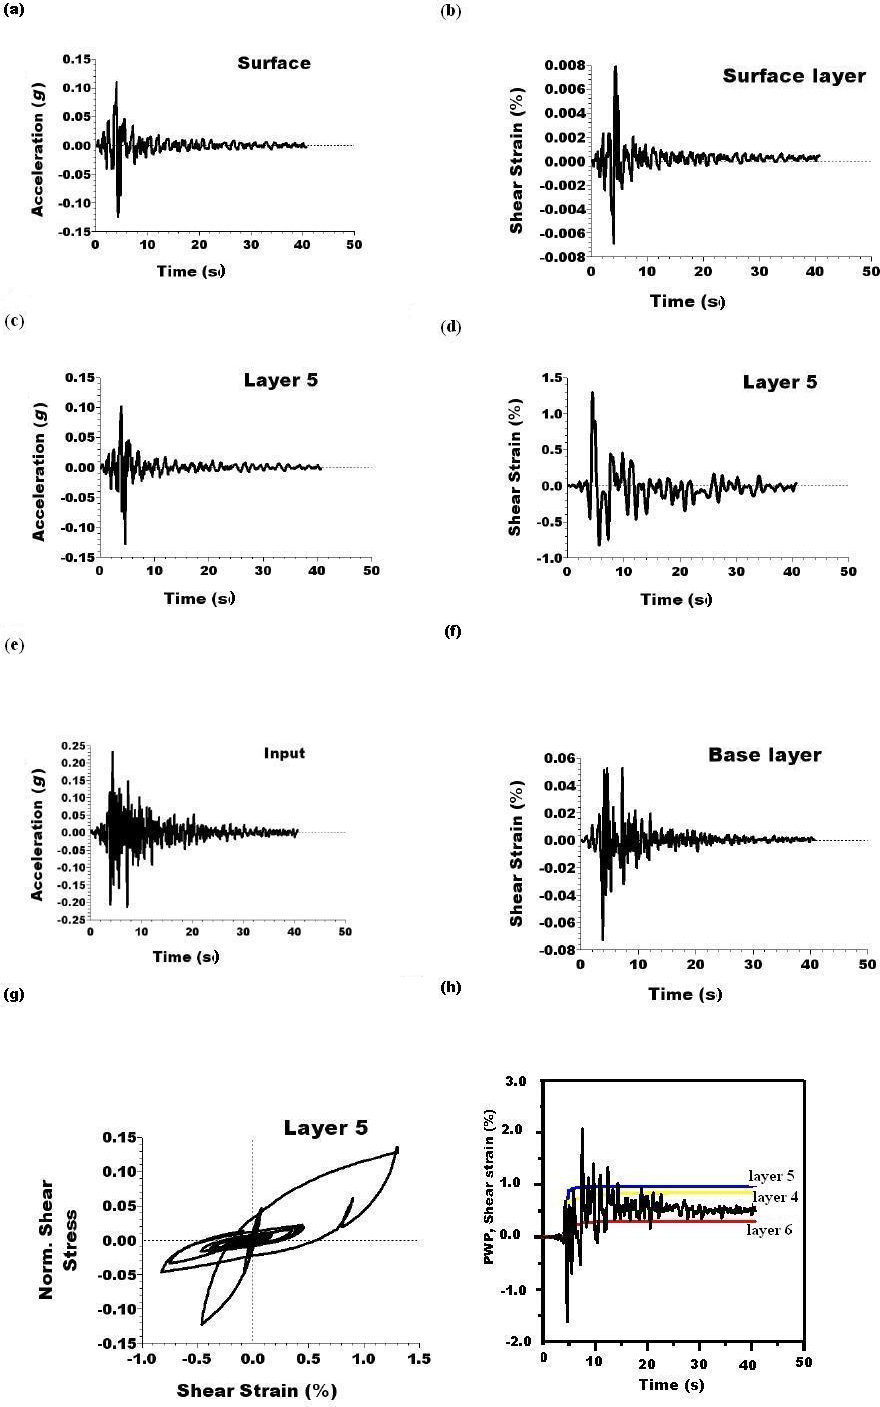
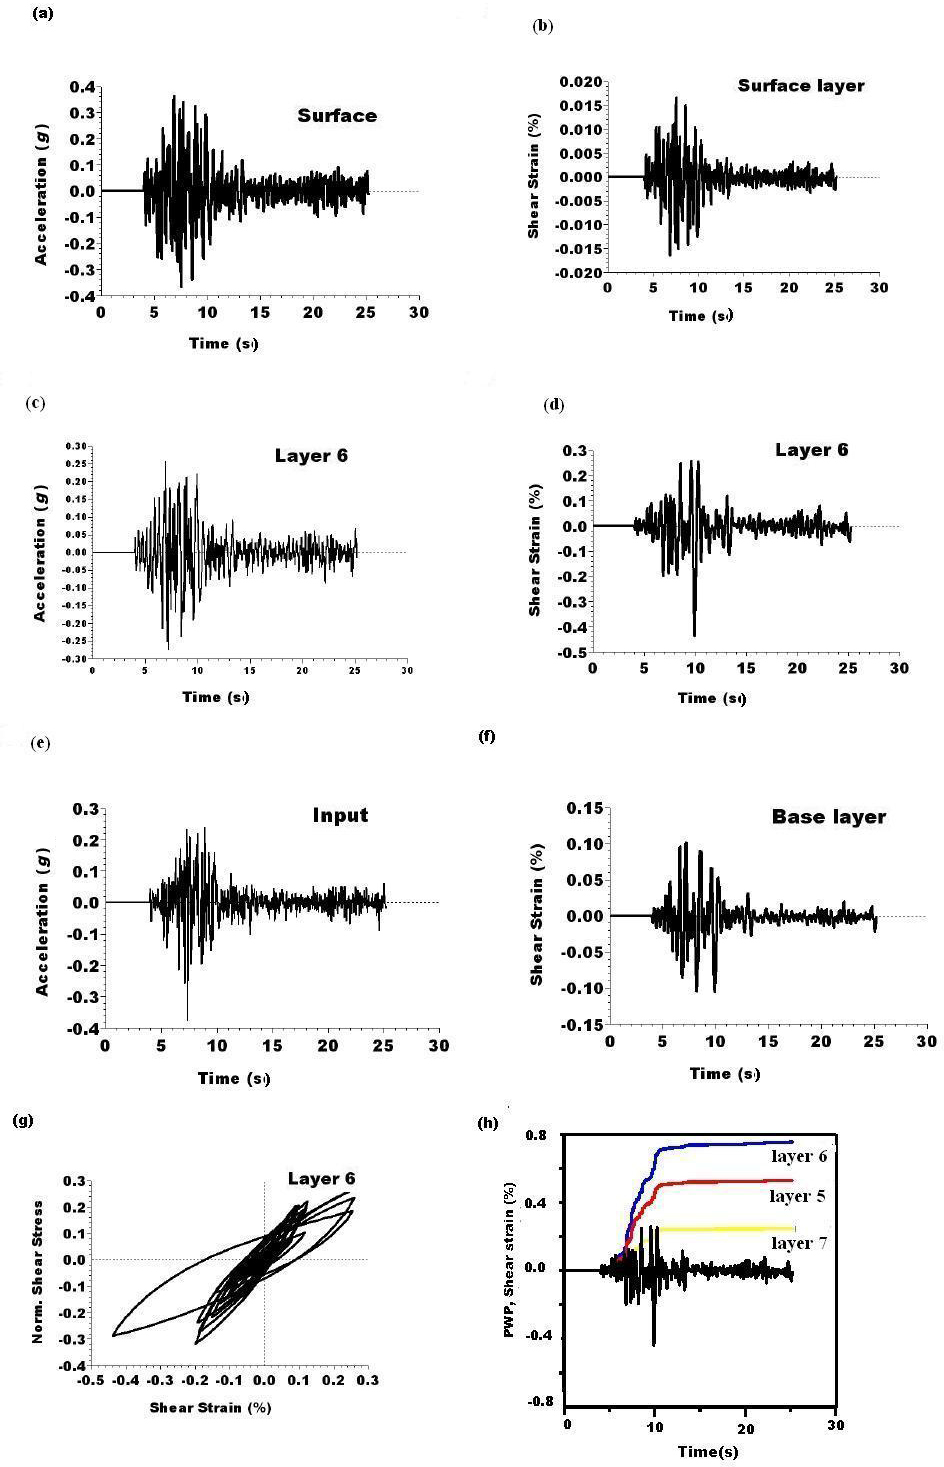
Figure S5. (a,c,e) Acceleration and (b,d,f) strain time histories at different ground level. (g) Stress–strain history for the liquefiable layer. (h) PWP time histories at different ground level and shear-strain time history for the liquefiable layer. Case of the recorded earthquake with Mw 6.7 (HH′ site).
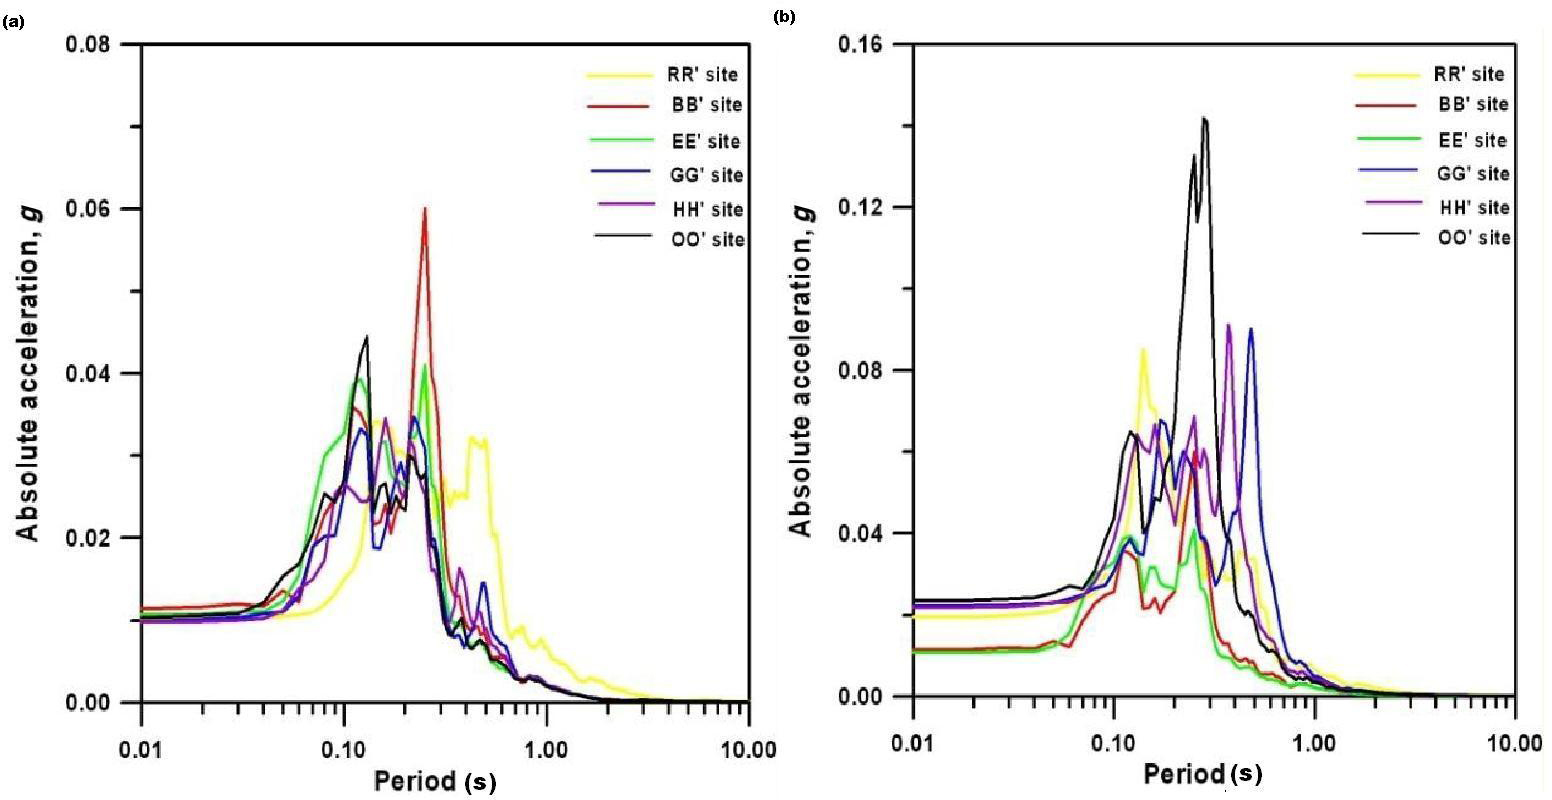
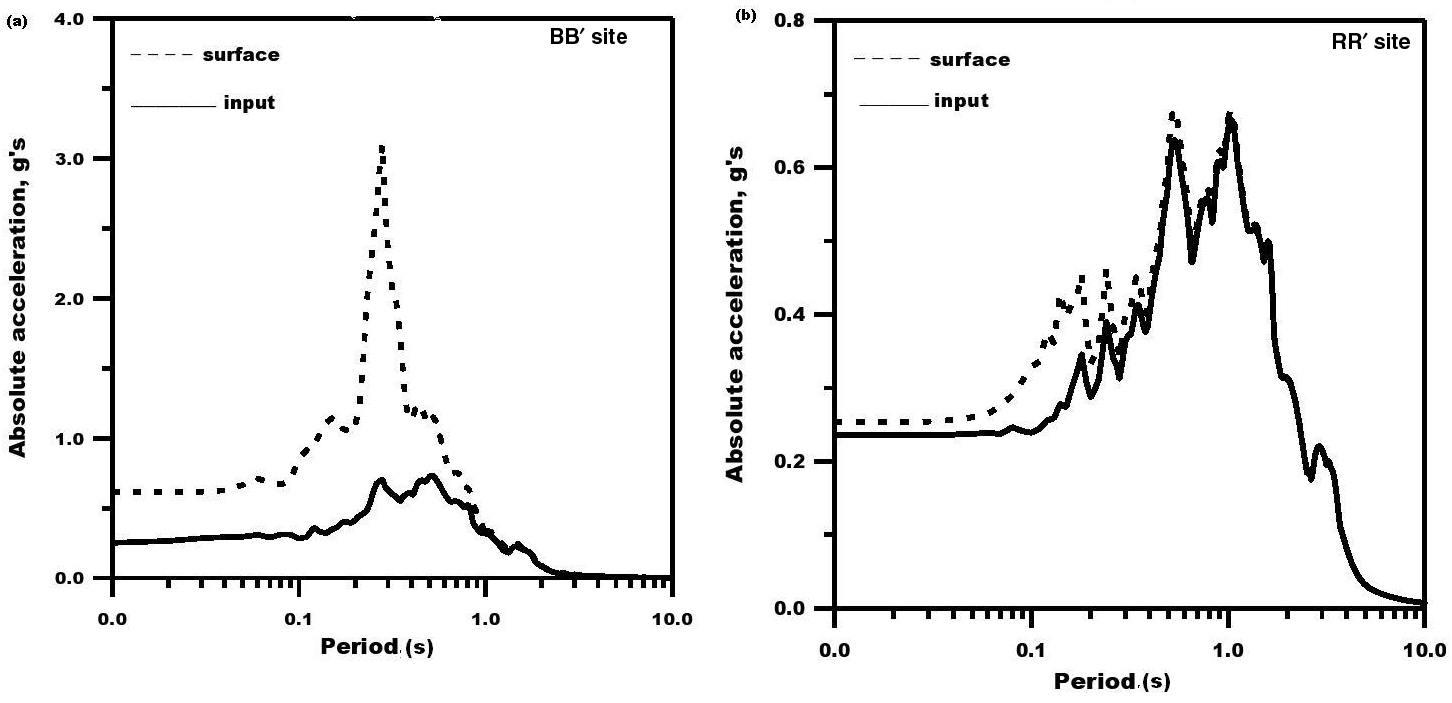
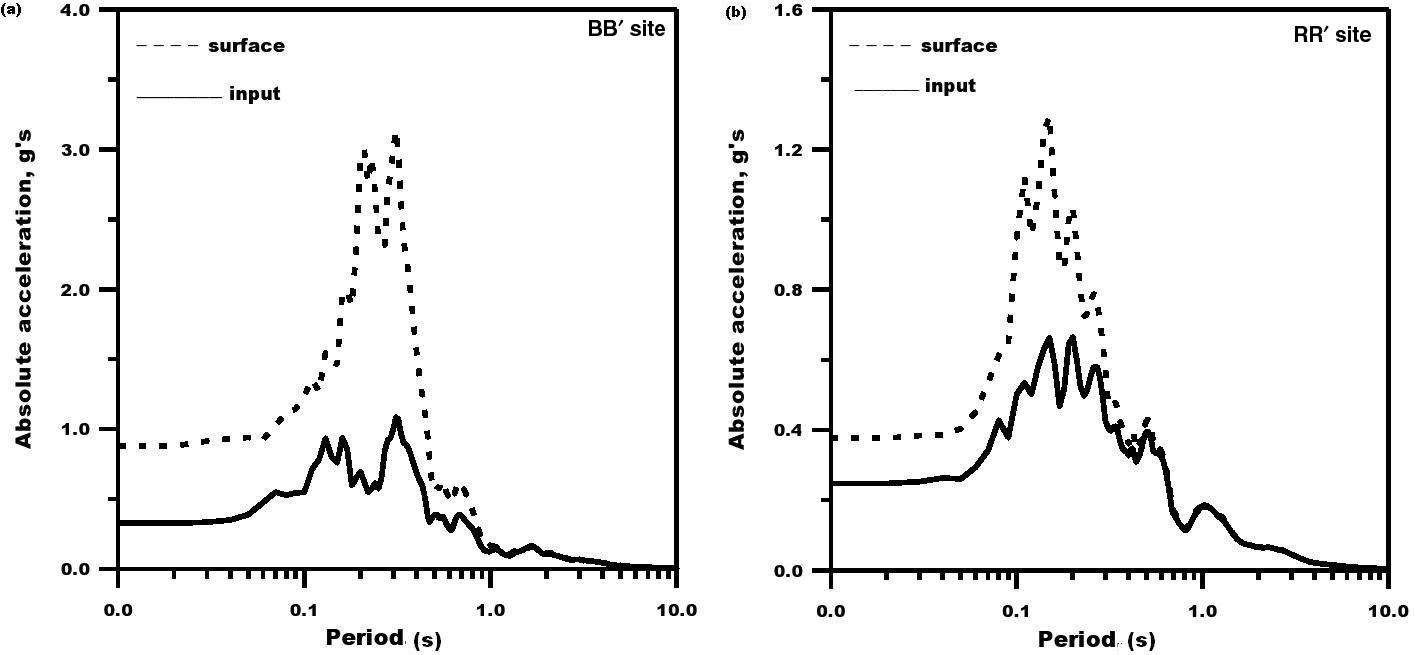
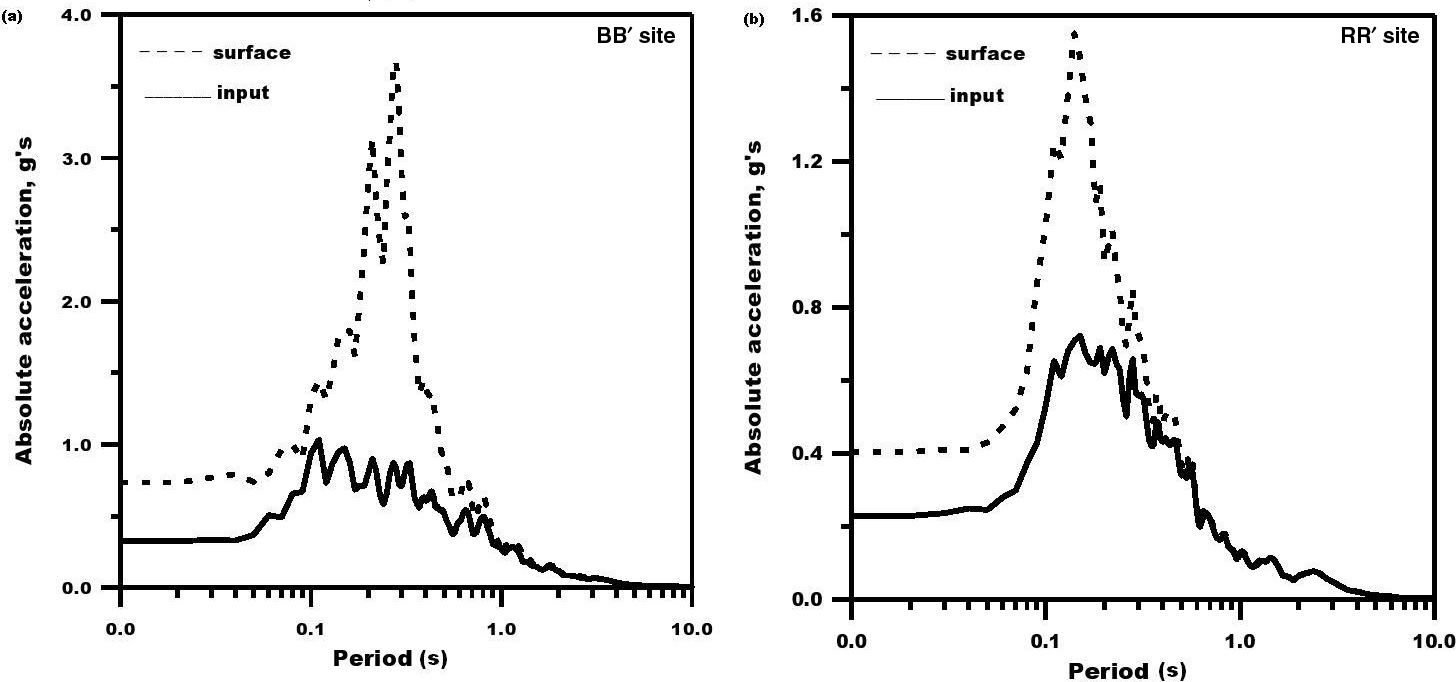
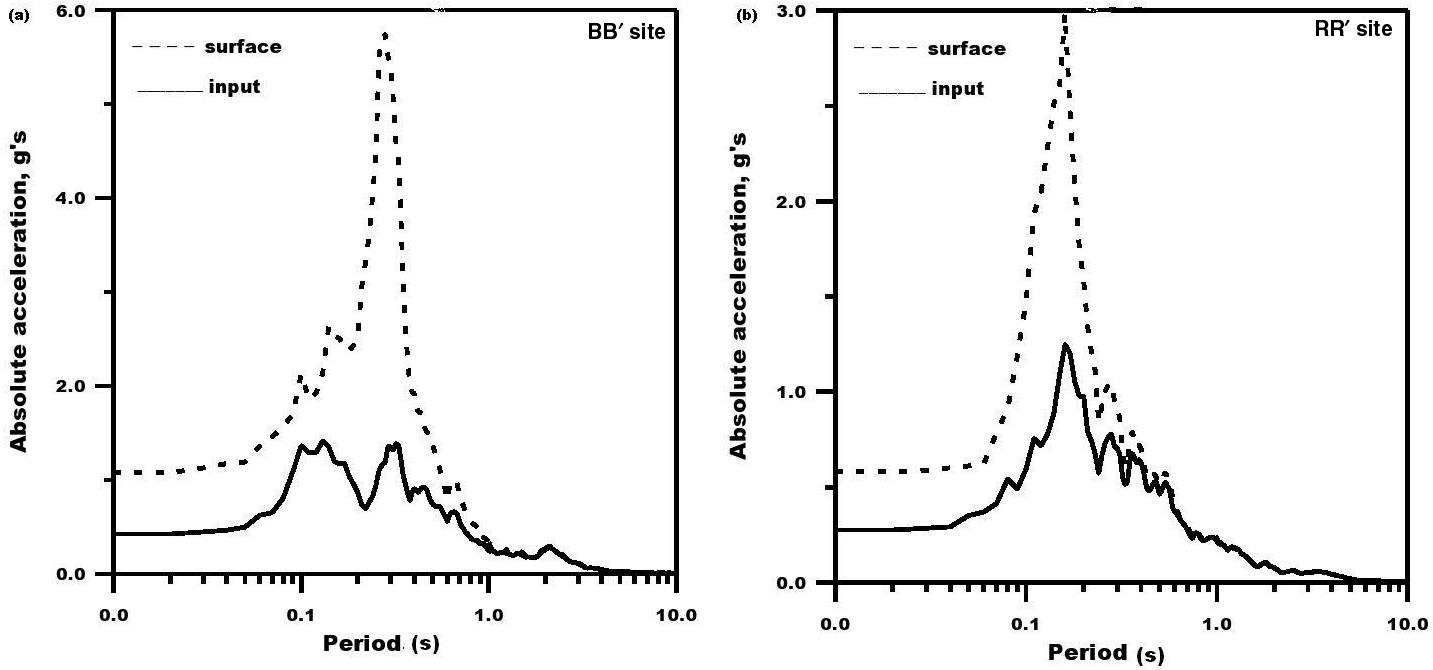
Figure S6. Acceleration response spectra at the (a) BB′ and (b) RR′ sites. Case of the recorded event with Mw 6.7.
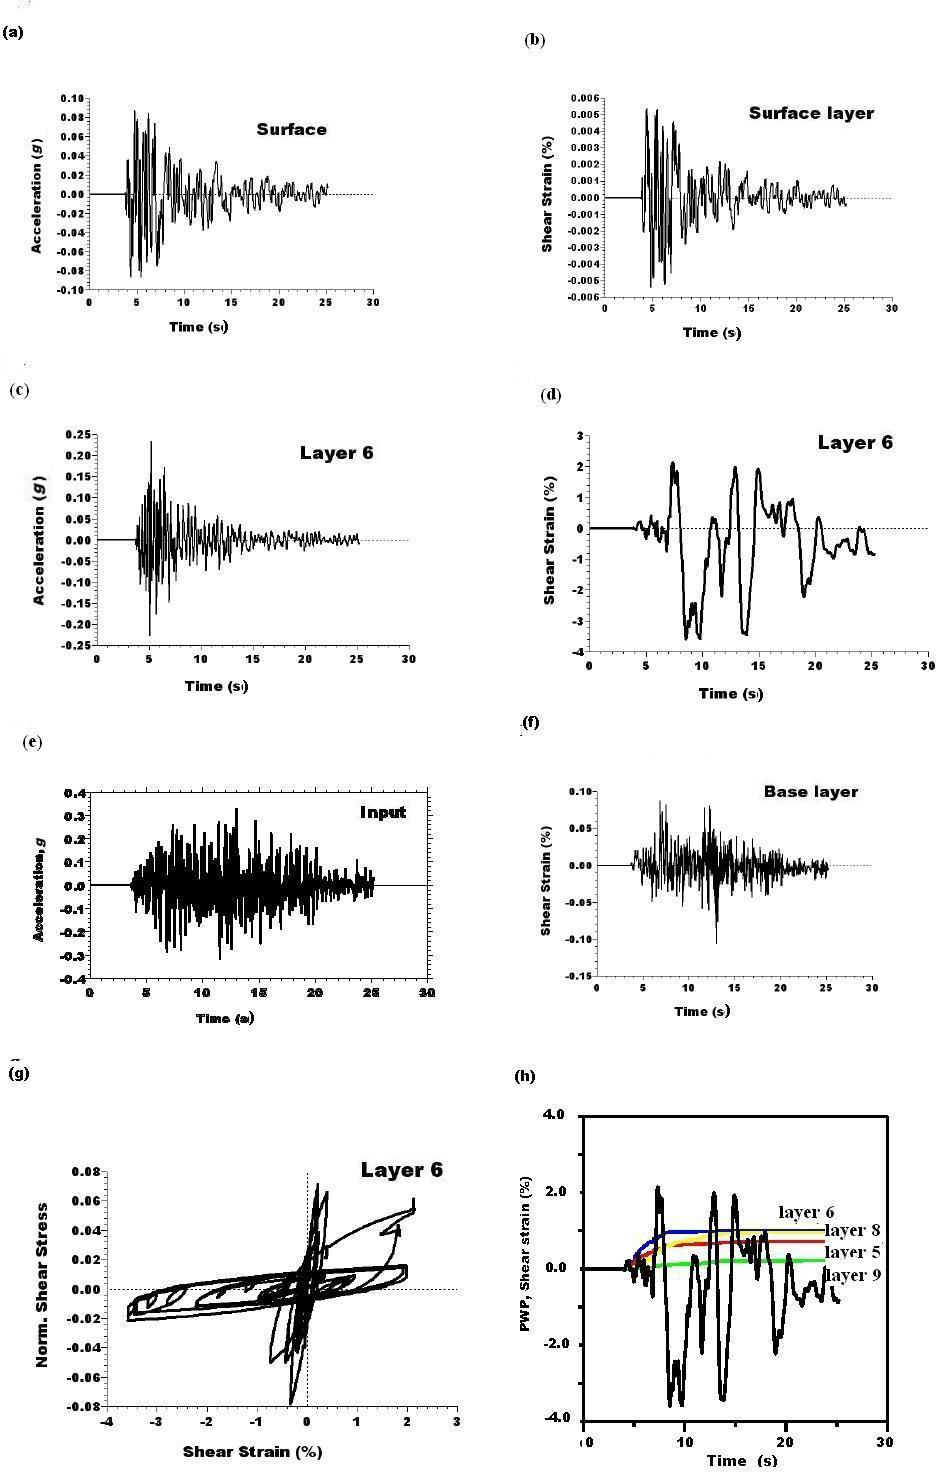
Figure S7. (a,c,e) Acceleration and (b,d,f) strain time histories at different ground level. (g) Stress–strain history for the liquefiable layer. (h) PWP time histories at different ground level and shear-strain time history for the liquefiable layer. Case of Atalanti hypothetical earthquake with Mw 6.7 (HH′ site).
Figure S8. (a,c,e) Acceleration and (b,d,f) strain time histories at different ground level. (g) Stress–strain history for the liquefiable layer. (h) PWP time histories at different ground level and shear-strain time history for the liquefiable layer. Case of Atalanti hypothetical earthquake with Mw 6.7 (GG′ site).
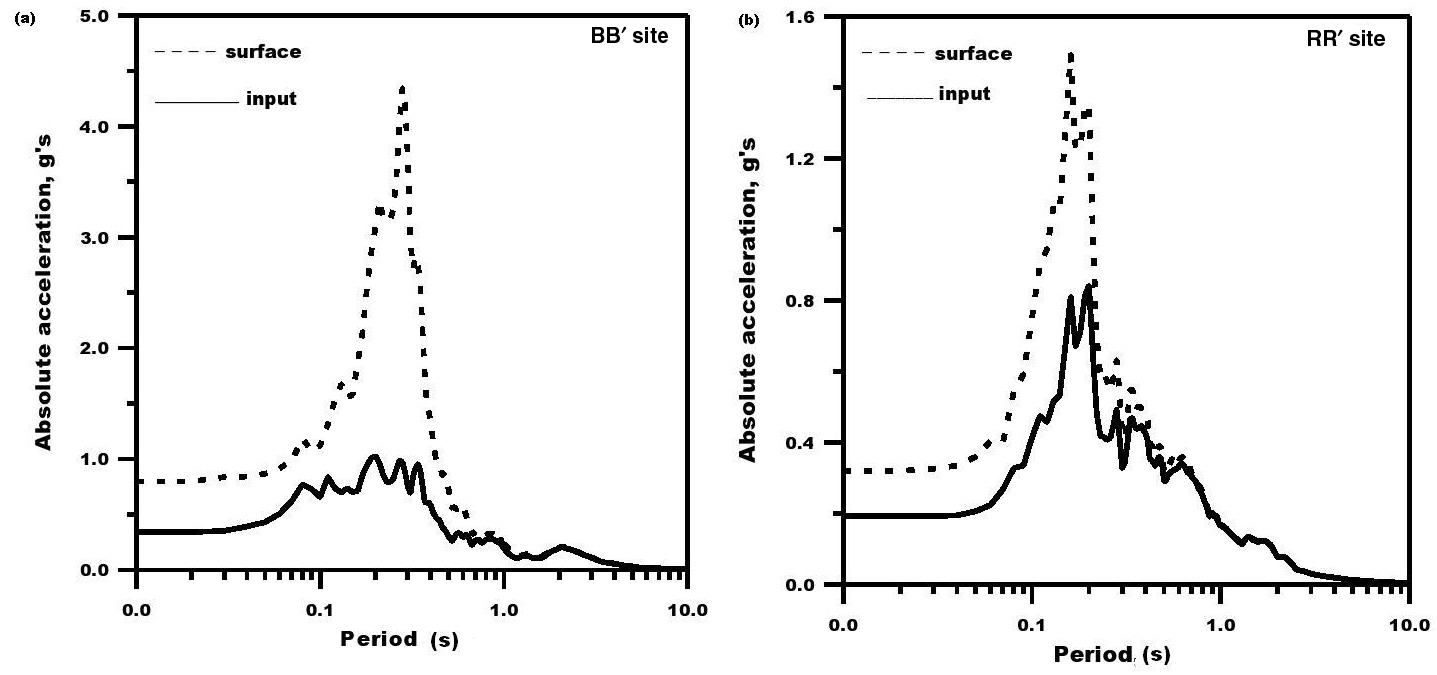
Figure S9. Acceleration response spectra at the (a) BB′ and (b) RR′ sites. Case of Atalanti hypothetical earthquake with Mw 6.7.
Figure S10. (a,c,e) Acceleration and (b,d,f) strain time histories at different ground level. (g) Stress–strain history for the liquefiable layer. (h) PWP time histories at different ground level and shear-strain time history for the liquefiable layer. Case of Atalanti hypothetical earthquake with Mw 6.9 (HH′ site).
Figure S11. (a,c,e) Acceleration and (b,d,f) strain time histories at different ground level. (g) Stress–strain history for the liquefiable layer. (h) PWP time histories at different ground level and shear-strain time history for the liquefiable layer. Case of Atalanti hypothetical earthquake with Mw 6.9 (EE′ site).
Figure S12. Acceleration response spectra at the (a) BB′ and (b) RR′ sites. Case of Atalanti hypothetical earthquake with Mw 6.9.
Figure S13. (a,c,e) Acceleration and (b,d,f) strain time histories at different ground level. (g) Stress–strain history for the liquefiable layer. (h) PWP time histories at different ground level and shear-strain time history for the liquefiable layer. Case of Atalanti hypothetical earthquake with Mw 7.0 (EE′ site).
Figure S14. (a,c,e) Acceleration and (b,d,f) strain time histories at different ground level. (g) Stress–strain history for the liquefiable layer. (h) PWP time histories at different ground level and shear-strain time history for the liquefiable layer. Case of Atalanti hypothetical earthquake with Mw 7.0 (GG′ site).
Figure S15. Acceleration response spectra at the (a) BB′ and (b) RR′ sites. Case of Atalanti hypothetical earthquake with Mw 7.0.
Figure S16. (a,c,e) Acceleration and (b,d,f) strain time histories at different ground level. (g) Stress–strain history for the liquefiable layer. (h) PWP time histories at different ground level and shear-strain time history for the liquefiable layer. Case of Atalanti hypothetical earthquake with Mw 7.2 (EE′ site).
Figure S17. (a,c,e) Acceleration and (b,d,f) strain time histories at different ground level. (g) Stress–strain history for the liquefiable layer. (h) PWP time histories at different ground level and shear-strain time history for the liquefiable layer. Case of Atalanti hypothetical earthquake with Mw 7.2 (GG′ site).
Figure S18. Acceleration response spectra at the (a) BB′ and (b) RR′ sites. Case of Atalanti hypothetical earthquake with Mw 7.2.
[ Back ]