This electronic supplement contains figures of crustal velocity structures, a table of Q studies and Q studies illustrated for one region. To test how ground motions vary within different crustal regions of Central and Eastern North America (CENA), pseudoabsolute response spectral accelerations (PSAs) were computed from synthetic seismograms. Four regions were defined by a statistically representative crustal velocity model and a Q-factor model. Figures S1–S3 show selected crustal velocity structures and P-wave velocity histograms for the Atlantic Coastal Plain (Fig. S1), the Appalachians (Fig. S2), and the Mississippi Embayment (Fig. S3). For evaluating the variety of ground motions within a region itself, 18 alternative crustal models were defined for the reference region Central North America (CNA). Figures S4–S5 show the representative and alternative velocity profiles considered for CNA. Table S1 lists Q studies that were included for defining a Q-factor model for each of the four regions. Figure S6 illustrates the Q–f relations available for the Appalachians.
Table S1. Q studies used for extracting the Q-factor model for each of the four regions. The studies are based on teleseismic nonactive events and Love surface waves (Lg).
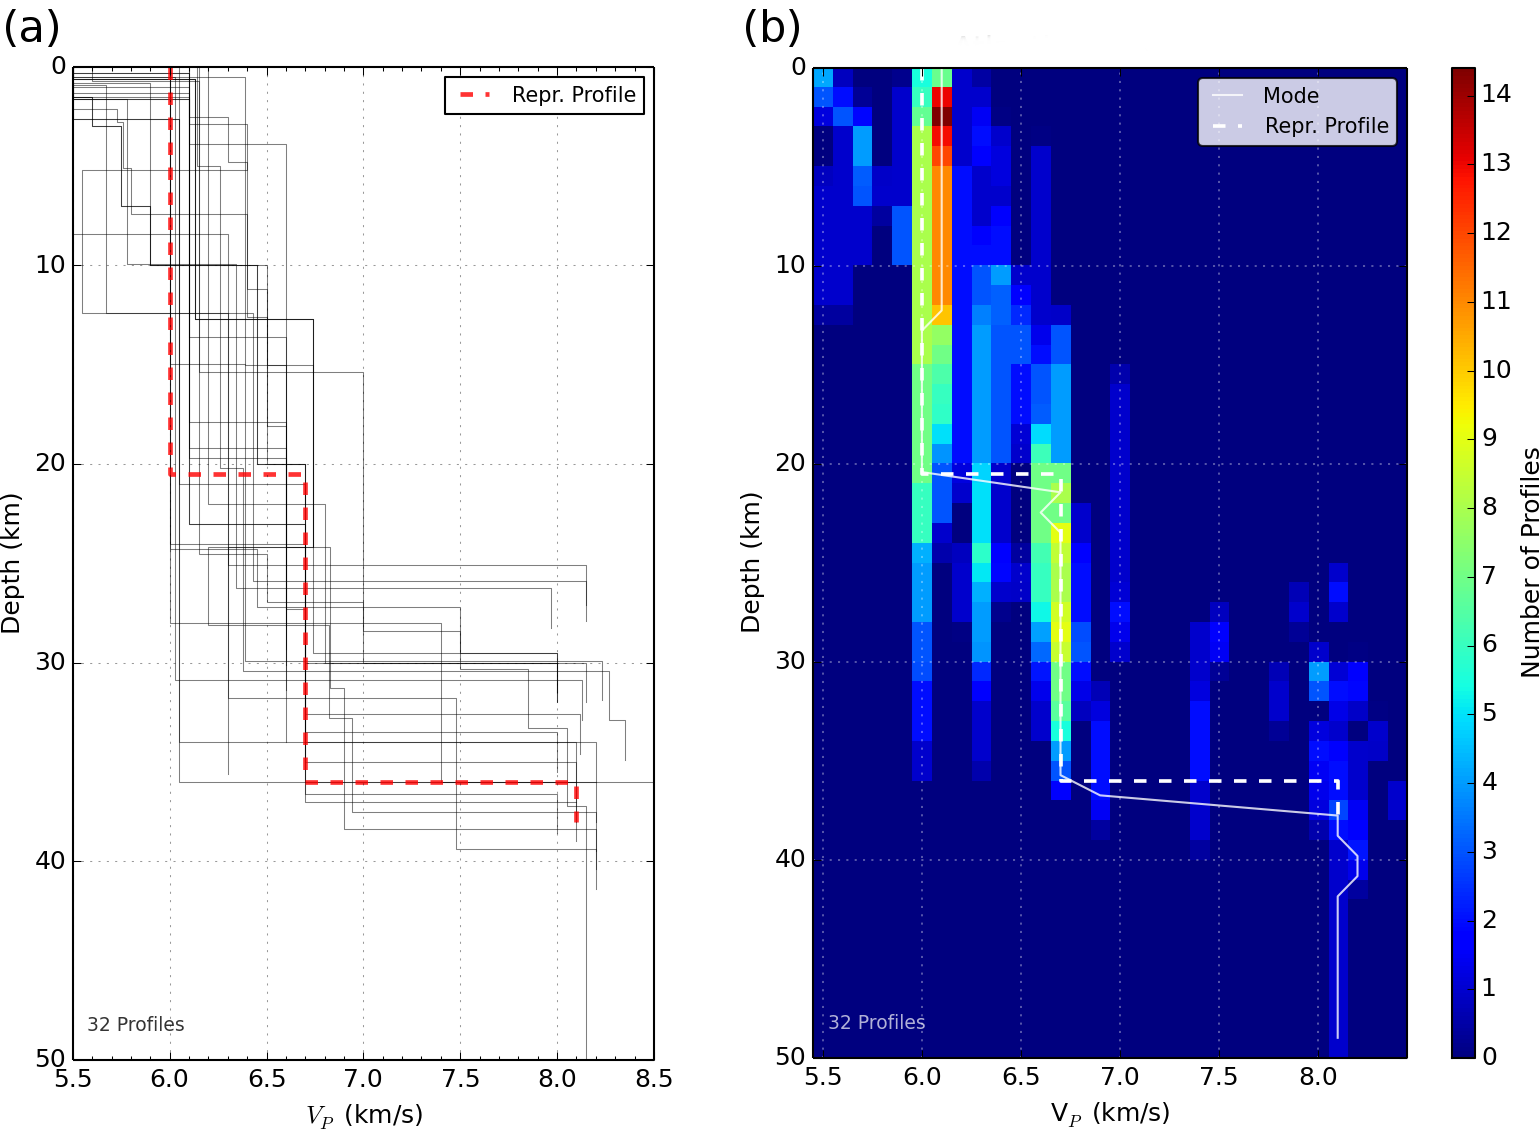
Figure S1. Crustal velocity structures within the Atlantic Coastal Plain. Thirty-two profiles match our data quality constraints. (a) P-wave velocity profiles are illustrated as black lines and their representative model as a red dashed line. (b) P-wave velocity 2D histogram. Data are binned every 2 km of depth and 0.1 km/s of VP. The color bar shows the number of profiles that lie within a bin. The continuous line represents the mode and the dashed line the representative profile.
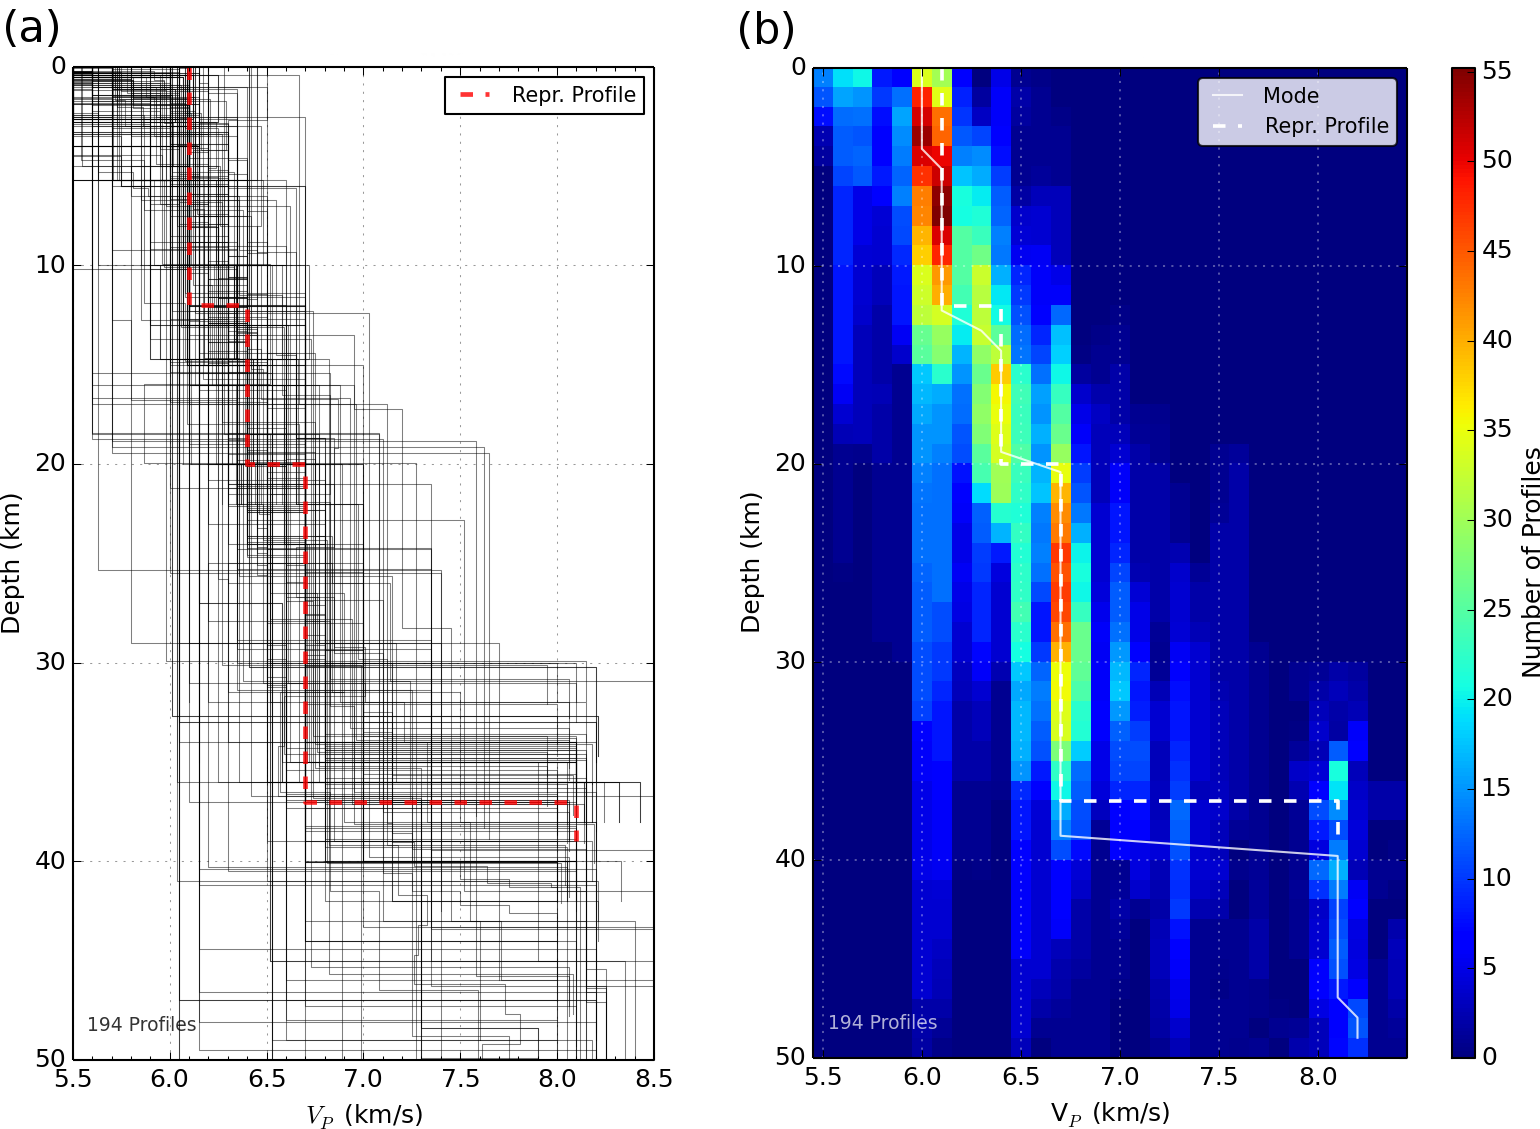
Figure S2. Crustal velocity structures within the Appalachians. A total of 194 profiles match our data quality constraints. (a) P-wave velocity profiles are illustrated as black lines and their representative model as a red dashed line. (b) P-wave velocity 2D histogram. Data are binned every 2 km of depth and 0.1 km/s of VP. The color bar shows the number of profiles that lie within a bin. The continuous line represents the mode and the dashed line the representative profile.
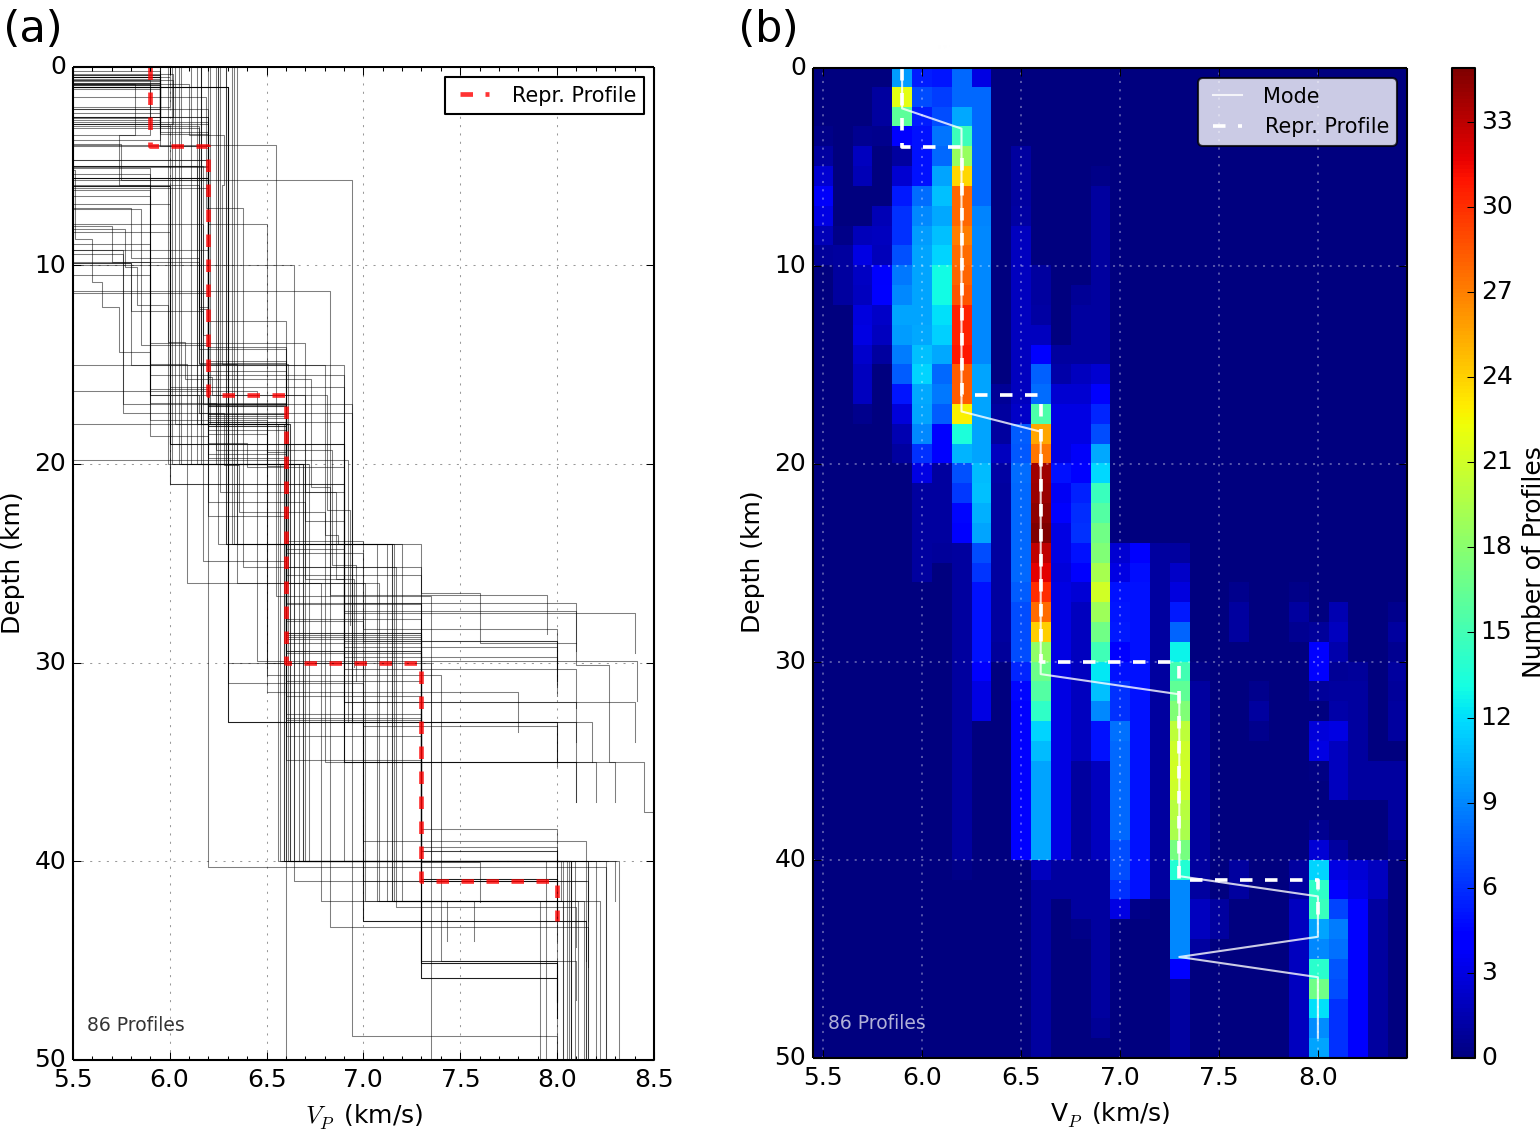
Figure S3. Crustal velocity structures within the Mississippi Embayment/Gulf Coast (MEM). Eighty-six profiles match our data quality constraints. (a) P-wave velocity profiles are illustrated as black lines and their representative model as a red dashed line. (b) P-wave velocity 2D histogram. Data are binned every 2 km of depth and 0.1 km/s of VP. The color bar shows the number of profiles that lie within a bin. The continuous line represents the mode and the dashed line the representative profile.
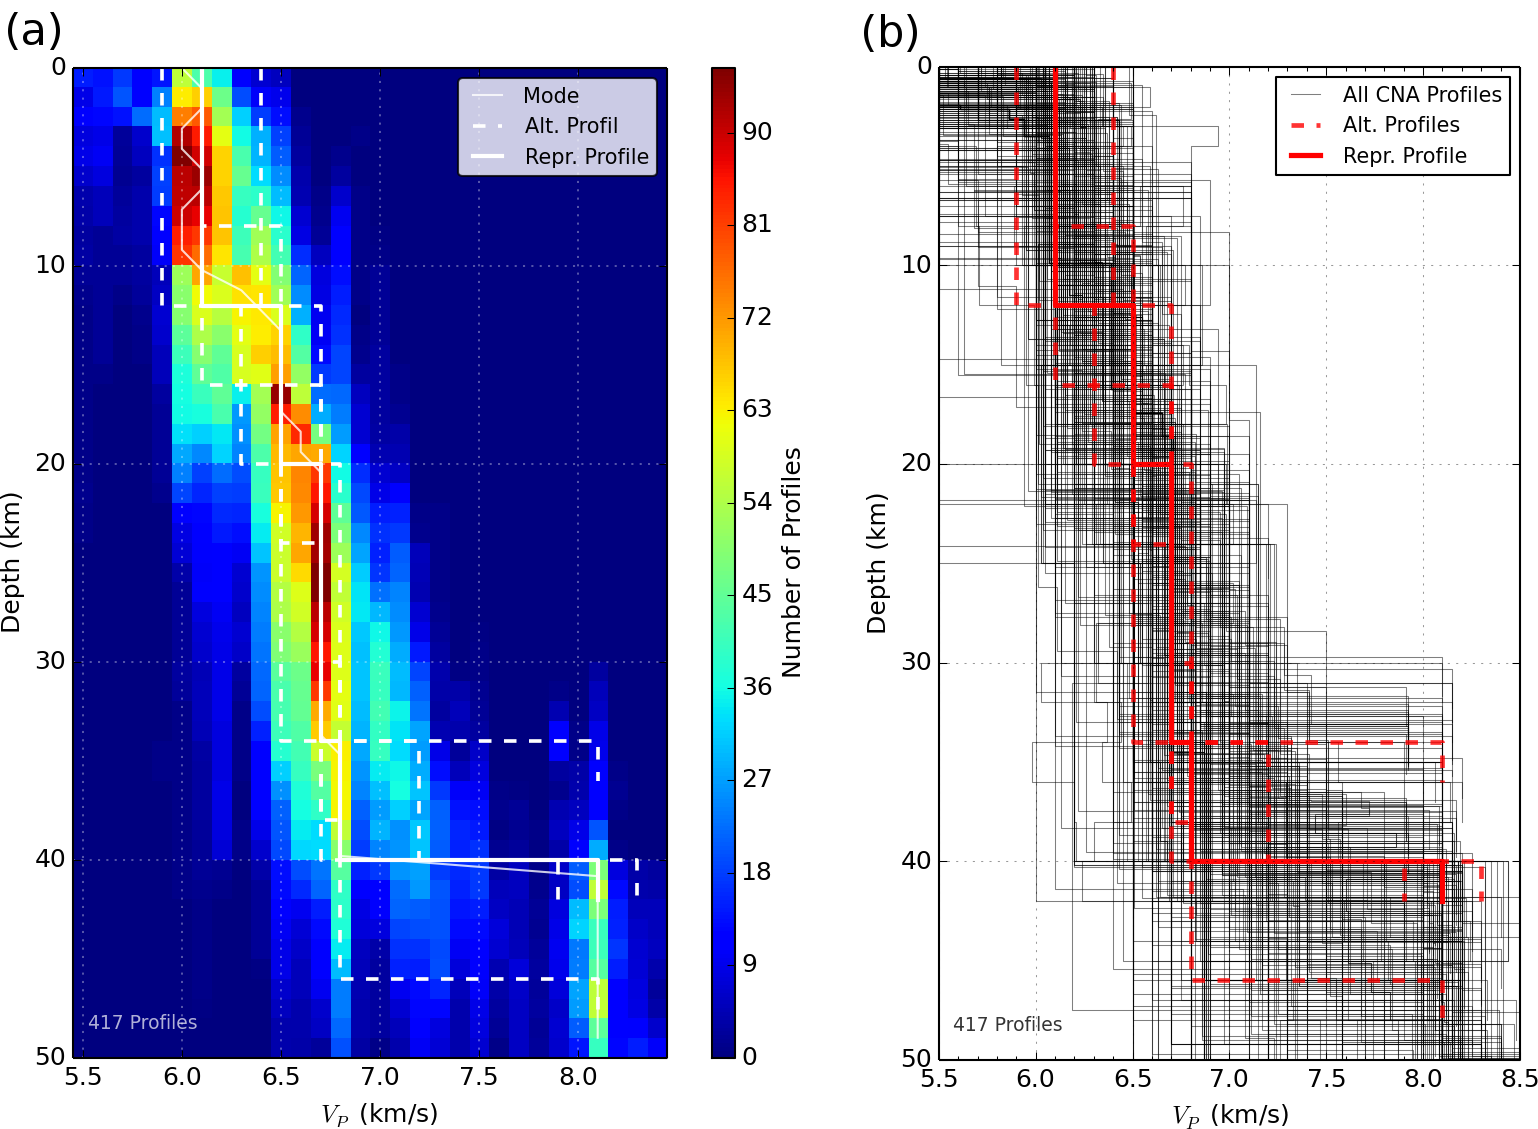
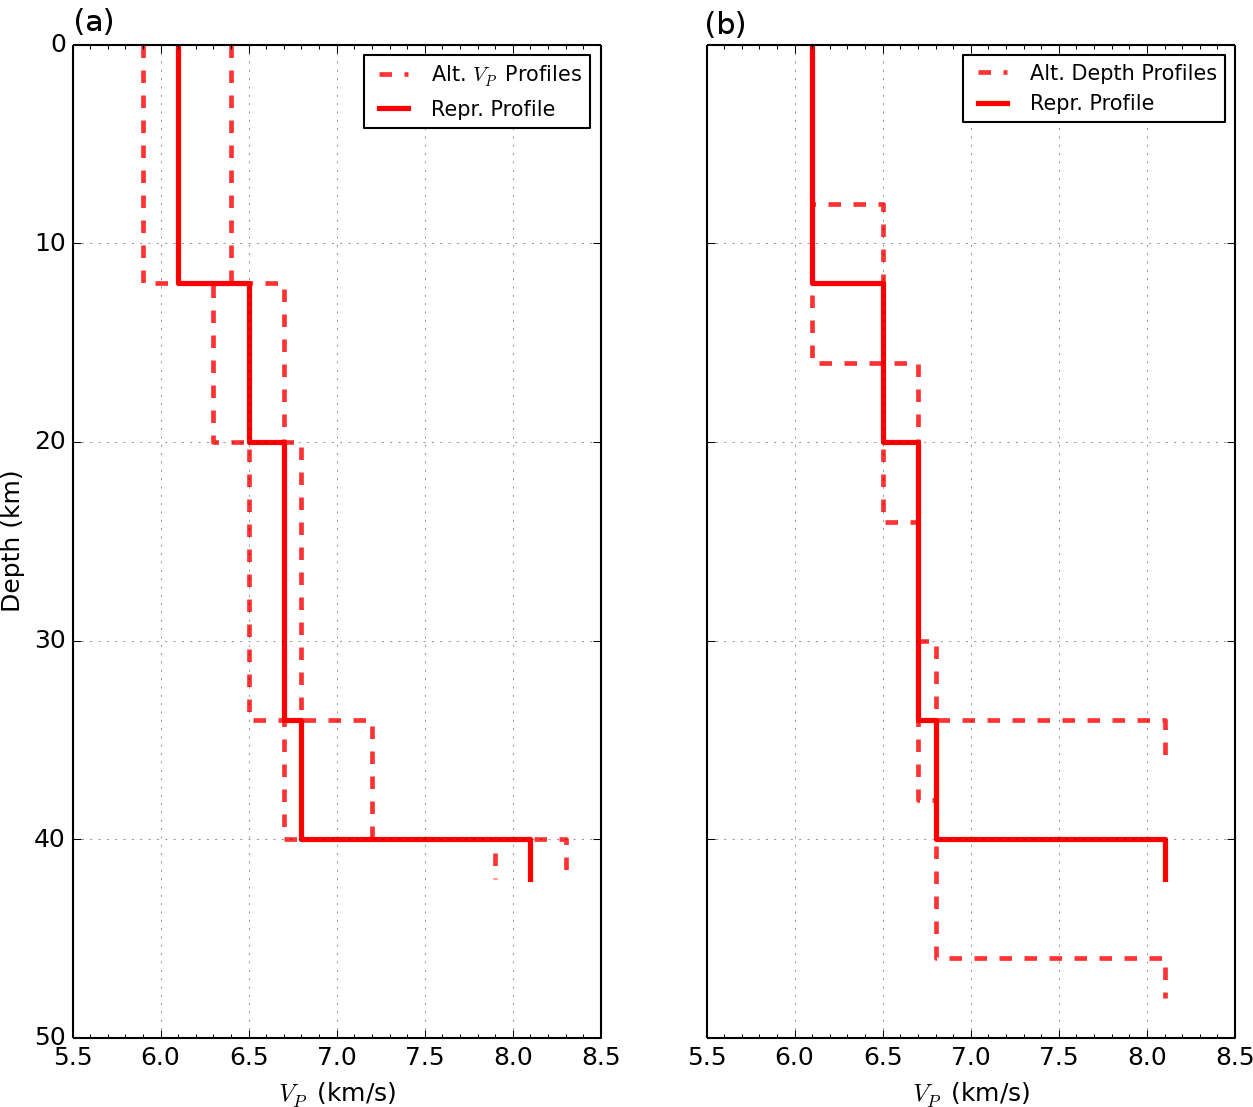
Figure S4. Representative and alternative velocity profiles on top of the available seismic velocity profiles for CNA, as shown in Figure 2 of the main article.
Figure S5. Representative and alternative velocity profiles for the reference region CNA.
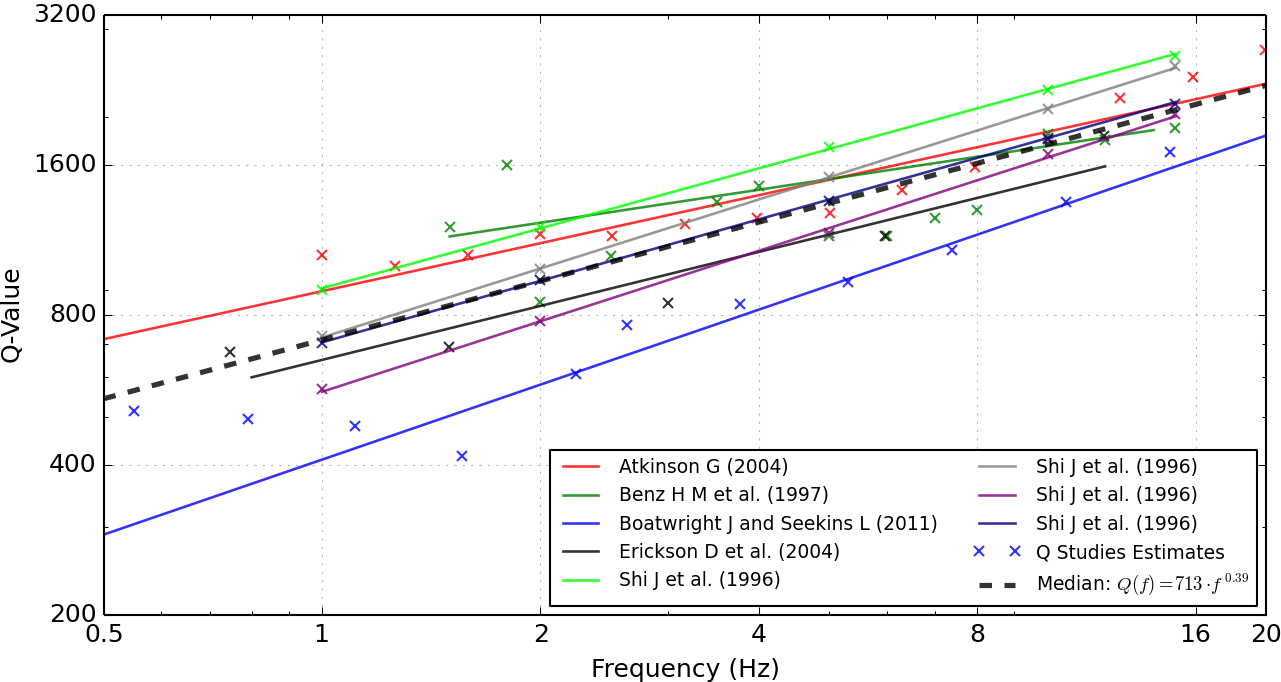
Figure S6. Compilation of Q(f) studies showing the attenuation of Lg waves within the Appalachians. Illustrated are eight studies (continuous lines) and their Q–f estimates, if available (crosses). The dashed line shows the median of all Q–f relations.
Atkinson, G. M. (1989). Attenuation of the Lg phase and site response for the Eastern Canada Telemetered Network, Seismol. Res. Lett. 60, no. 2, 59–69.
Atkinson, G. M. (2004). Empirical attenuation of ground-motion spectral amplitudes in southeastern Canada and the northeastern United States, Bull. Seismol. Soc. Am. 94, no. 3, 1079–1095.
Atkinson, G. M., and D. M. Boore (1995). Ground-motion relations for eastern North America, Bull. Seismol. Soc. Am. 85, no. 1, 17–30.
Atkinson, G. M., and R. Mereu (1992). The shape of ground motion attenuation curves in southeastern Canada, Bull. Seismol. Soc. Am. 82, no. 5, 2014–2031.
Benz, H. M., A. Frankel, and D. M. Boore (1997). Regional Lg attenuation for the continental United States, Bull. Seismol. Soc. Am. 87, no. 3, 606–619.
Boatwright, J., and L. Seekins (2011). Regional spectral analysis of three moderate earthquakes in northeastern North America, Bull. Seismol. Soc. Am. 101, no. 4, 1769–1782.
Chun, K., and G. West (1987). A novel technique for measuring Lg attenuation. Results from eastern Canada between 1 to 10 Hz, Bull. Seismol. Soc. Am. 77, no. 2, 398–419.
Dwyer, J., R. Herrmann, and O. Nuttli (1983). Spatial attenuation of the Lg wave in the central United States, Bull. Seismol. Soc. Am. 73, no. 3, 781–796.
Erickson, D., D. McNamara, and H. Benz (2004). Frequency-dependent Lg Q within the continental United States, Bull. Seismol. Soc. Am. 94, no. 5, 1630–1643.
Gupta, I., and K. McLaughlin (1987). Attenuation of ground motion in the eastern United States, Bull. Seismol. Soc. Am. 77, no. 2, 366–383.
Hasegawa, H. (1985). Attenuation of Lg waves in the Canadian Shield, Bull. Seismol. Soc. Am. 75, no. 6, 1569–1582.
Pulli, J. J. (1984). Attenuation of coda waves in New England, Bull. Seismol. Soc. Am. 74, no. 4, 1149–1166.
Shi, J., W. Kim, and P. Richards (1996). Variability of crustal attenuation in the northeastern United States from Lg waves, J. Geophys. Res. 101, no. B11, 25,231–25,242.
Shin, T., and R. Herrmann (1987). Lg attenuation and source studies using 1982 Miramichi data, Bull. Seismol. Soc. Am. 77, no. 2, 384–397.
Woodgold, C. (1990). Estimation of Q in eastern Canada using coda waves, Bull. Seismol. Soc. Am. 80, no. 2, 411–429.
Zandieh, A., and S. Pezeshk (2010). Investigation of geometrical spreading and quality factor functions in the New Madrid seismic zone, Bull. Seismol. Soc. Am. 100, no. 5A, 2185–2195.
[ Back ]