This electronic supplement contains figures of recorded and simulated acceleration response spectra and earthquake ground-motion directional response.
To investigate our ability to predict topographic effects, we model three earthquakes using a previously verified 3D octree-based finite-element solver (Tu et al., 2006; Bielak et al., 2010) capable of modeling topography. The velocity model we use is the U.S. Geological Survey (USGS) Bay Area Velocity Model 08.3.0 (see Data and Resources). In addition, we use the QS attenuation model from Hartzell et al. (2006). The velocity model’s topography is refined using the 1/3 arcsec USGS digital elevation model (DEM) of the region (see Data and Resources). We approximate the topography in the finite-element simulations with cubed elements and a staircase free surface (Pitarka and Irikura, 1996; Koketsu et al., 2004). The numerical computations use at least 12 points per wavelength to avoid inaccuracies of the linear elements employed in the simulations. In the present implementation of the finite-element solver, attenuation is included by Rayleigh damping. We calculate the ground motion to an upper frequency limit of 5 Hz for three sources at different azimuths from Mission Peak. Figures S1, S2, and S3 compare data and synthetic 5% damped acceleration response spectra for events 6, 13, and 17, respectively (see Fig. 1 and Table 2 in the main article for locations of the events).
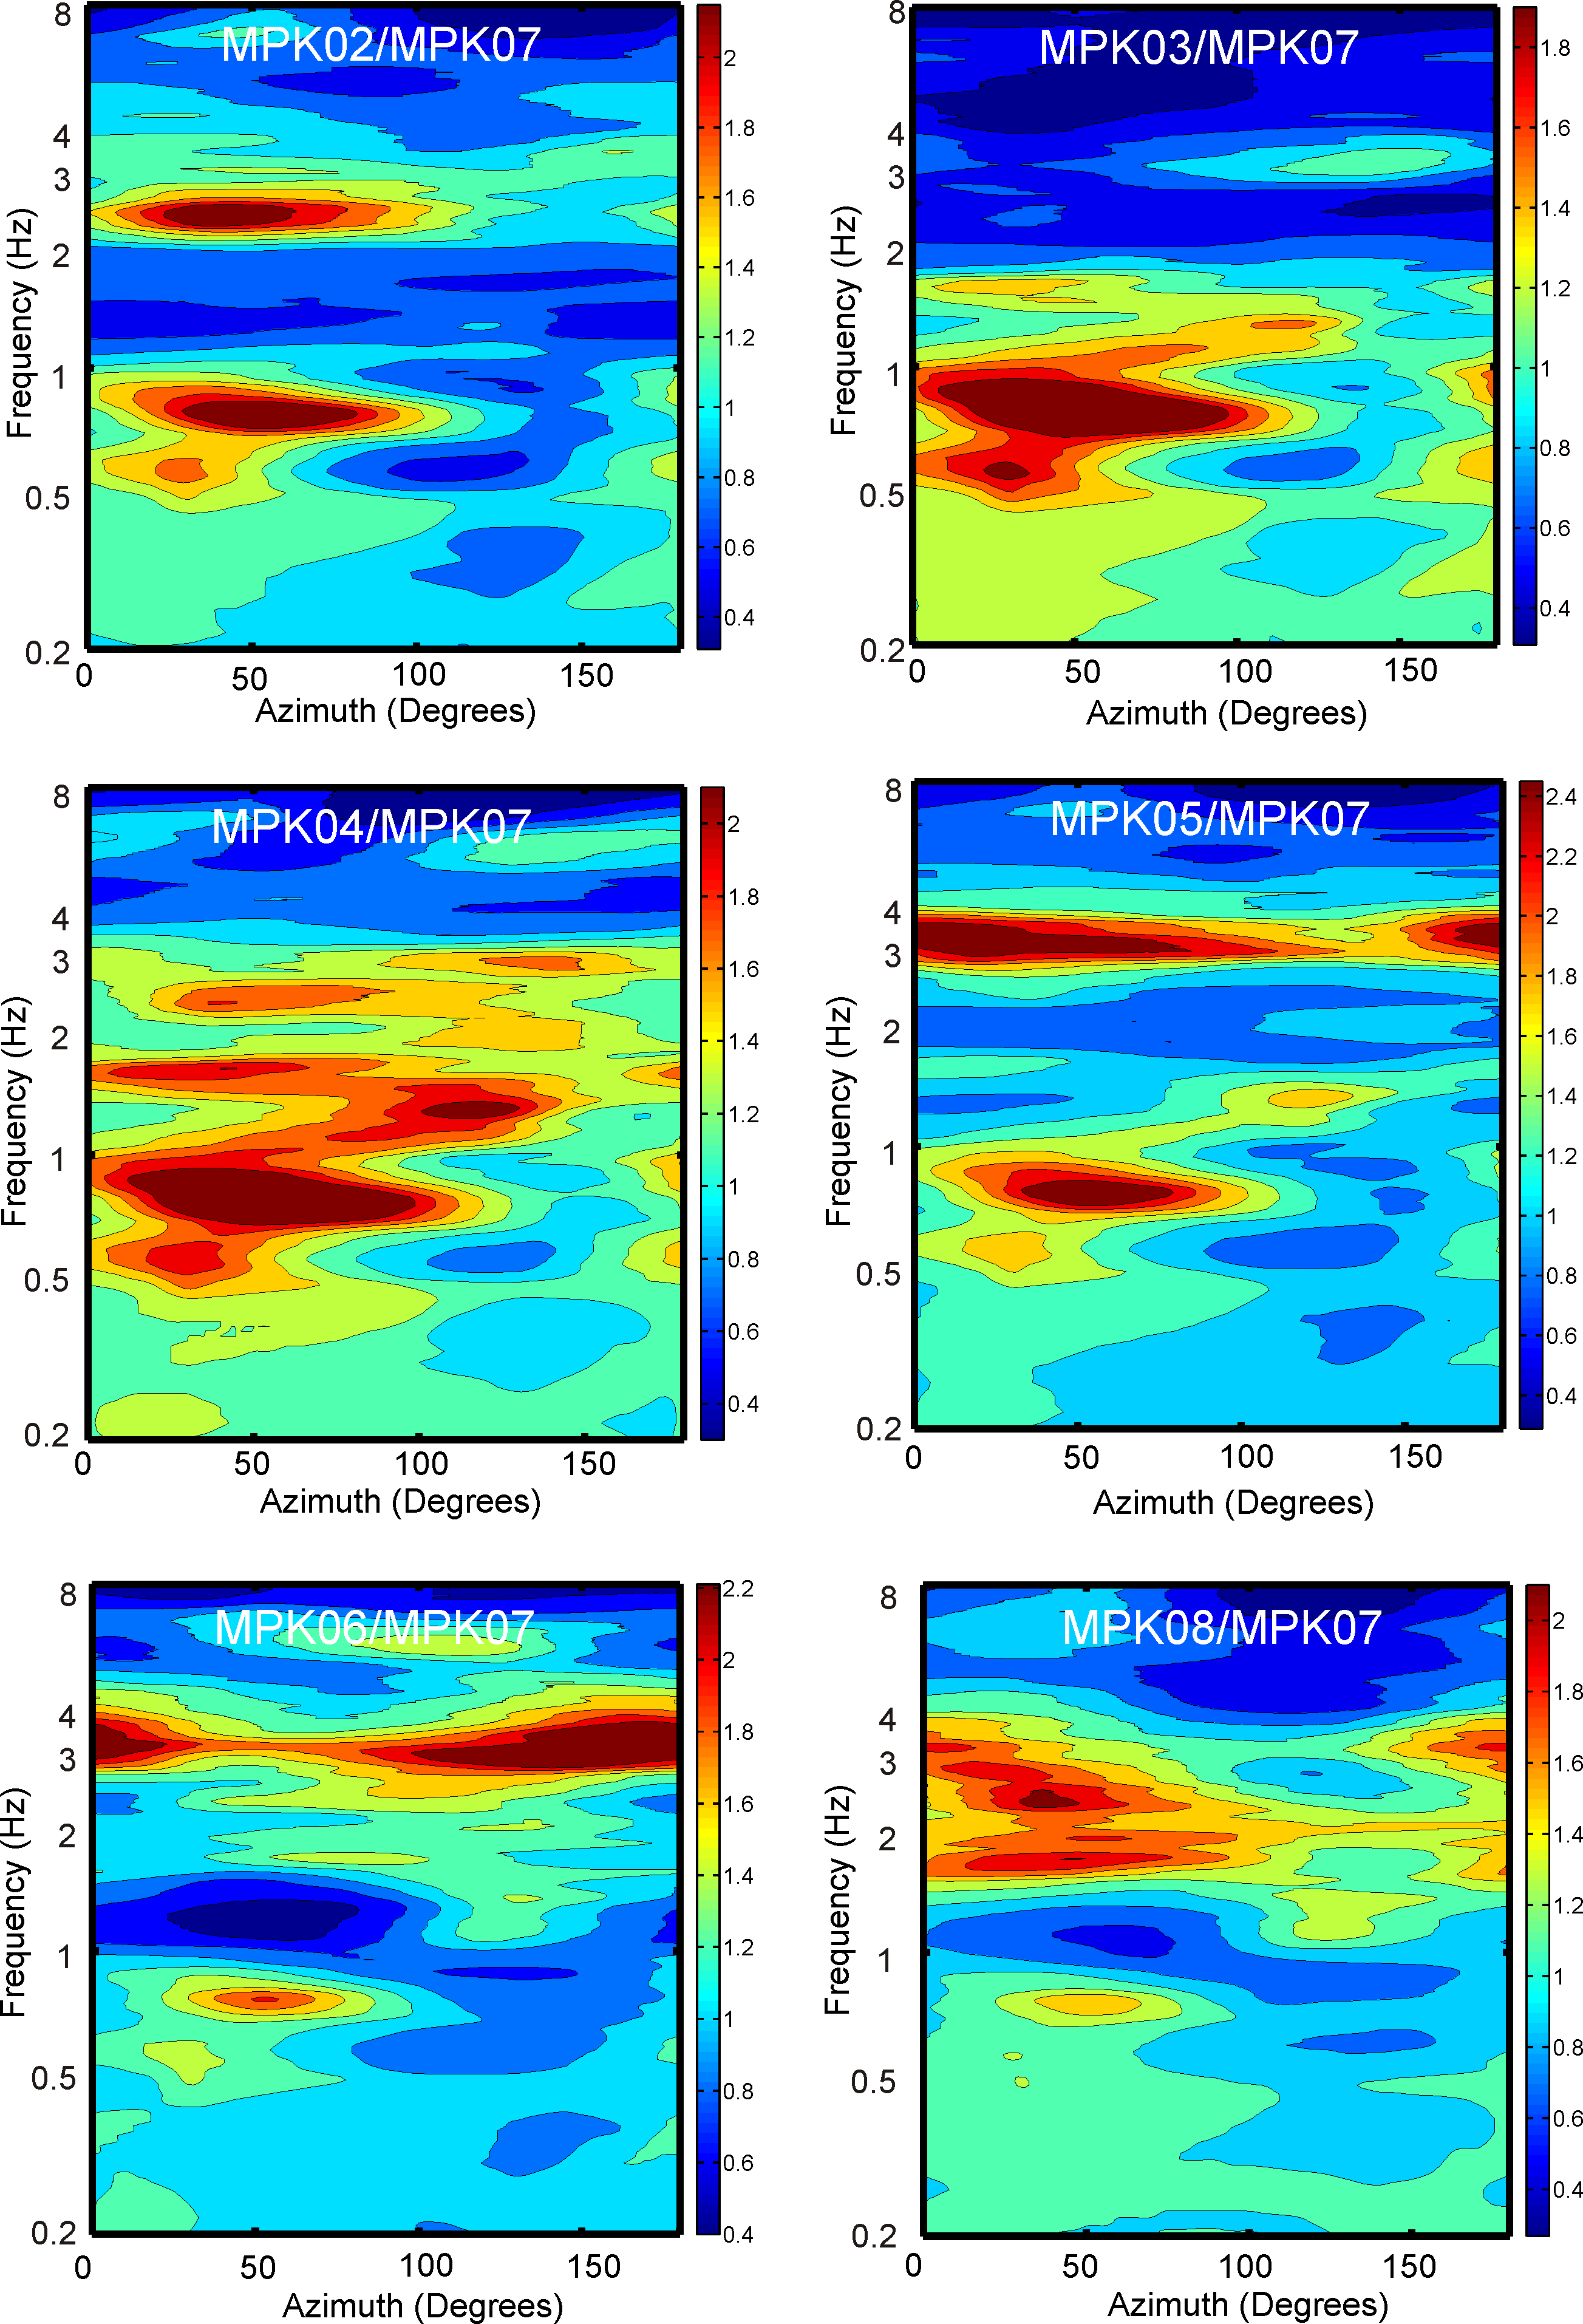
To further explore the relationship of epicentral back azimuth and direction of ground motion on amplification pattern, we perform the analysis in Figure 7 of the main article using only sources in the northeast and southwest quadrants from the array. These sources, which lie approximately perpendicular to the ridge axis, produce a nearly identical pattern of amplification (Fig. S4). This test demonstrates that the preferred direction of motion perpendicular to the ridge axis is independent of the source back azimuth.
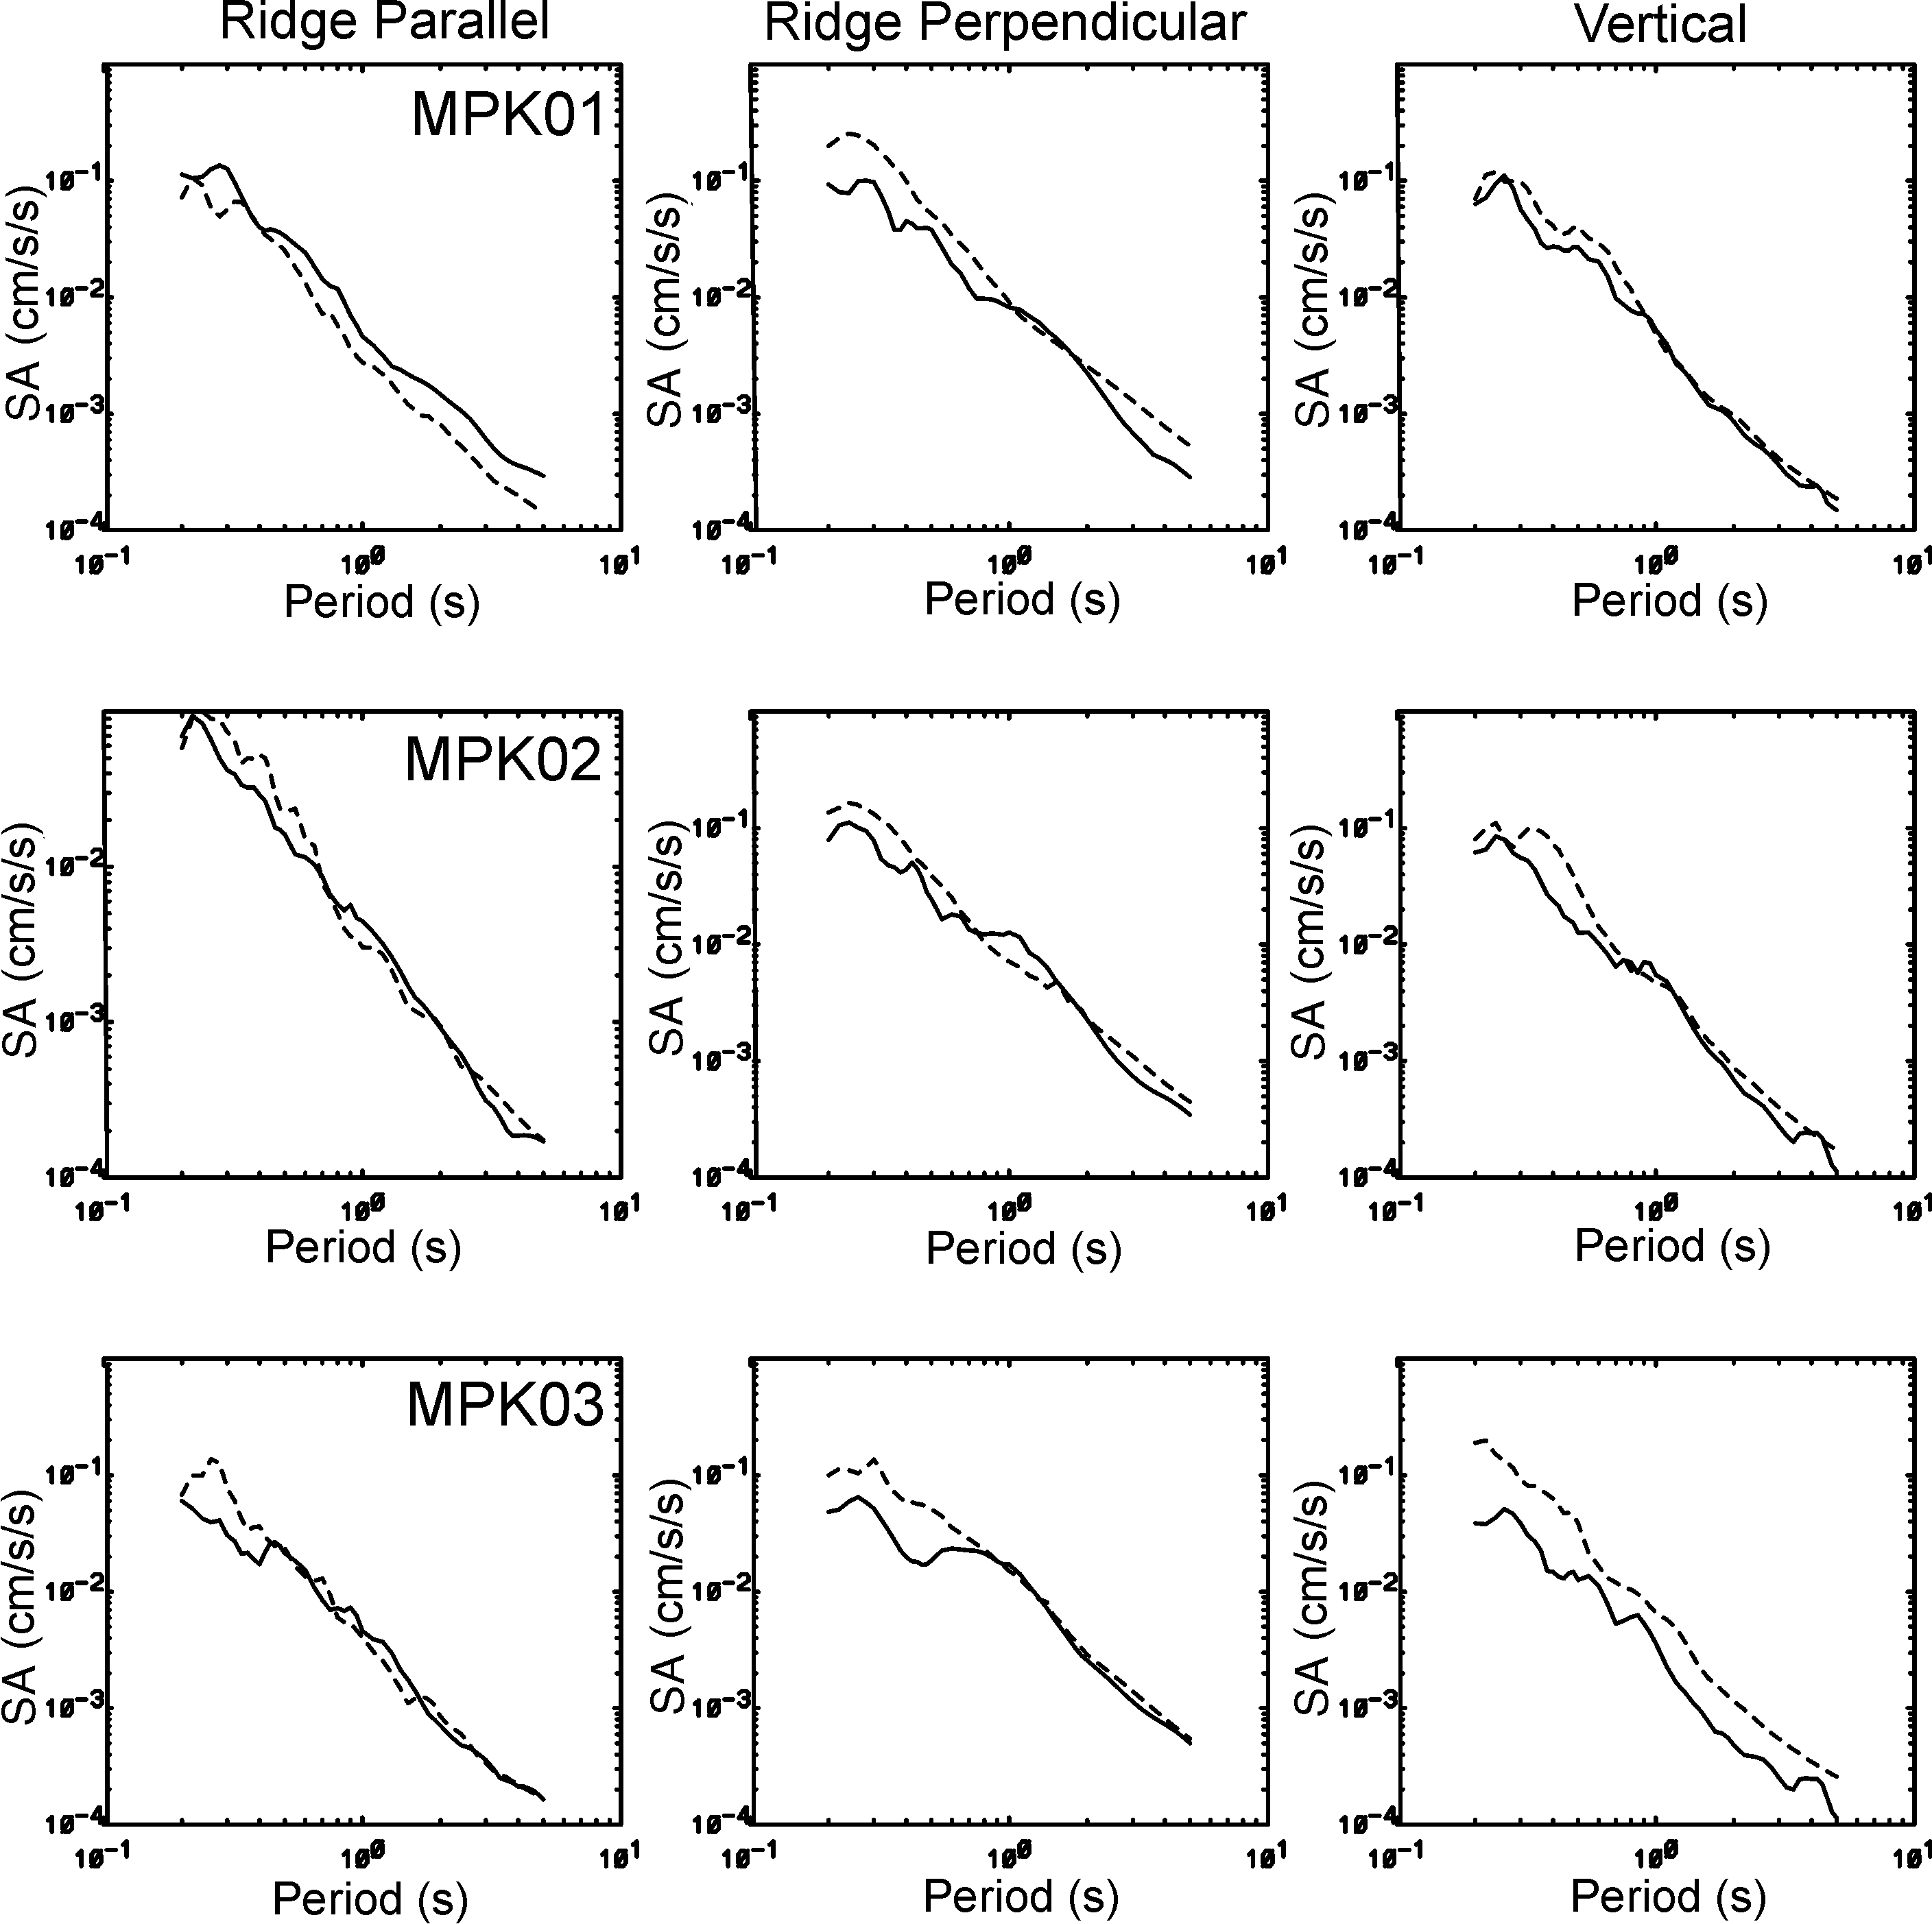
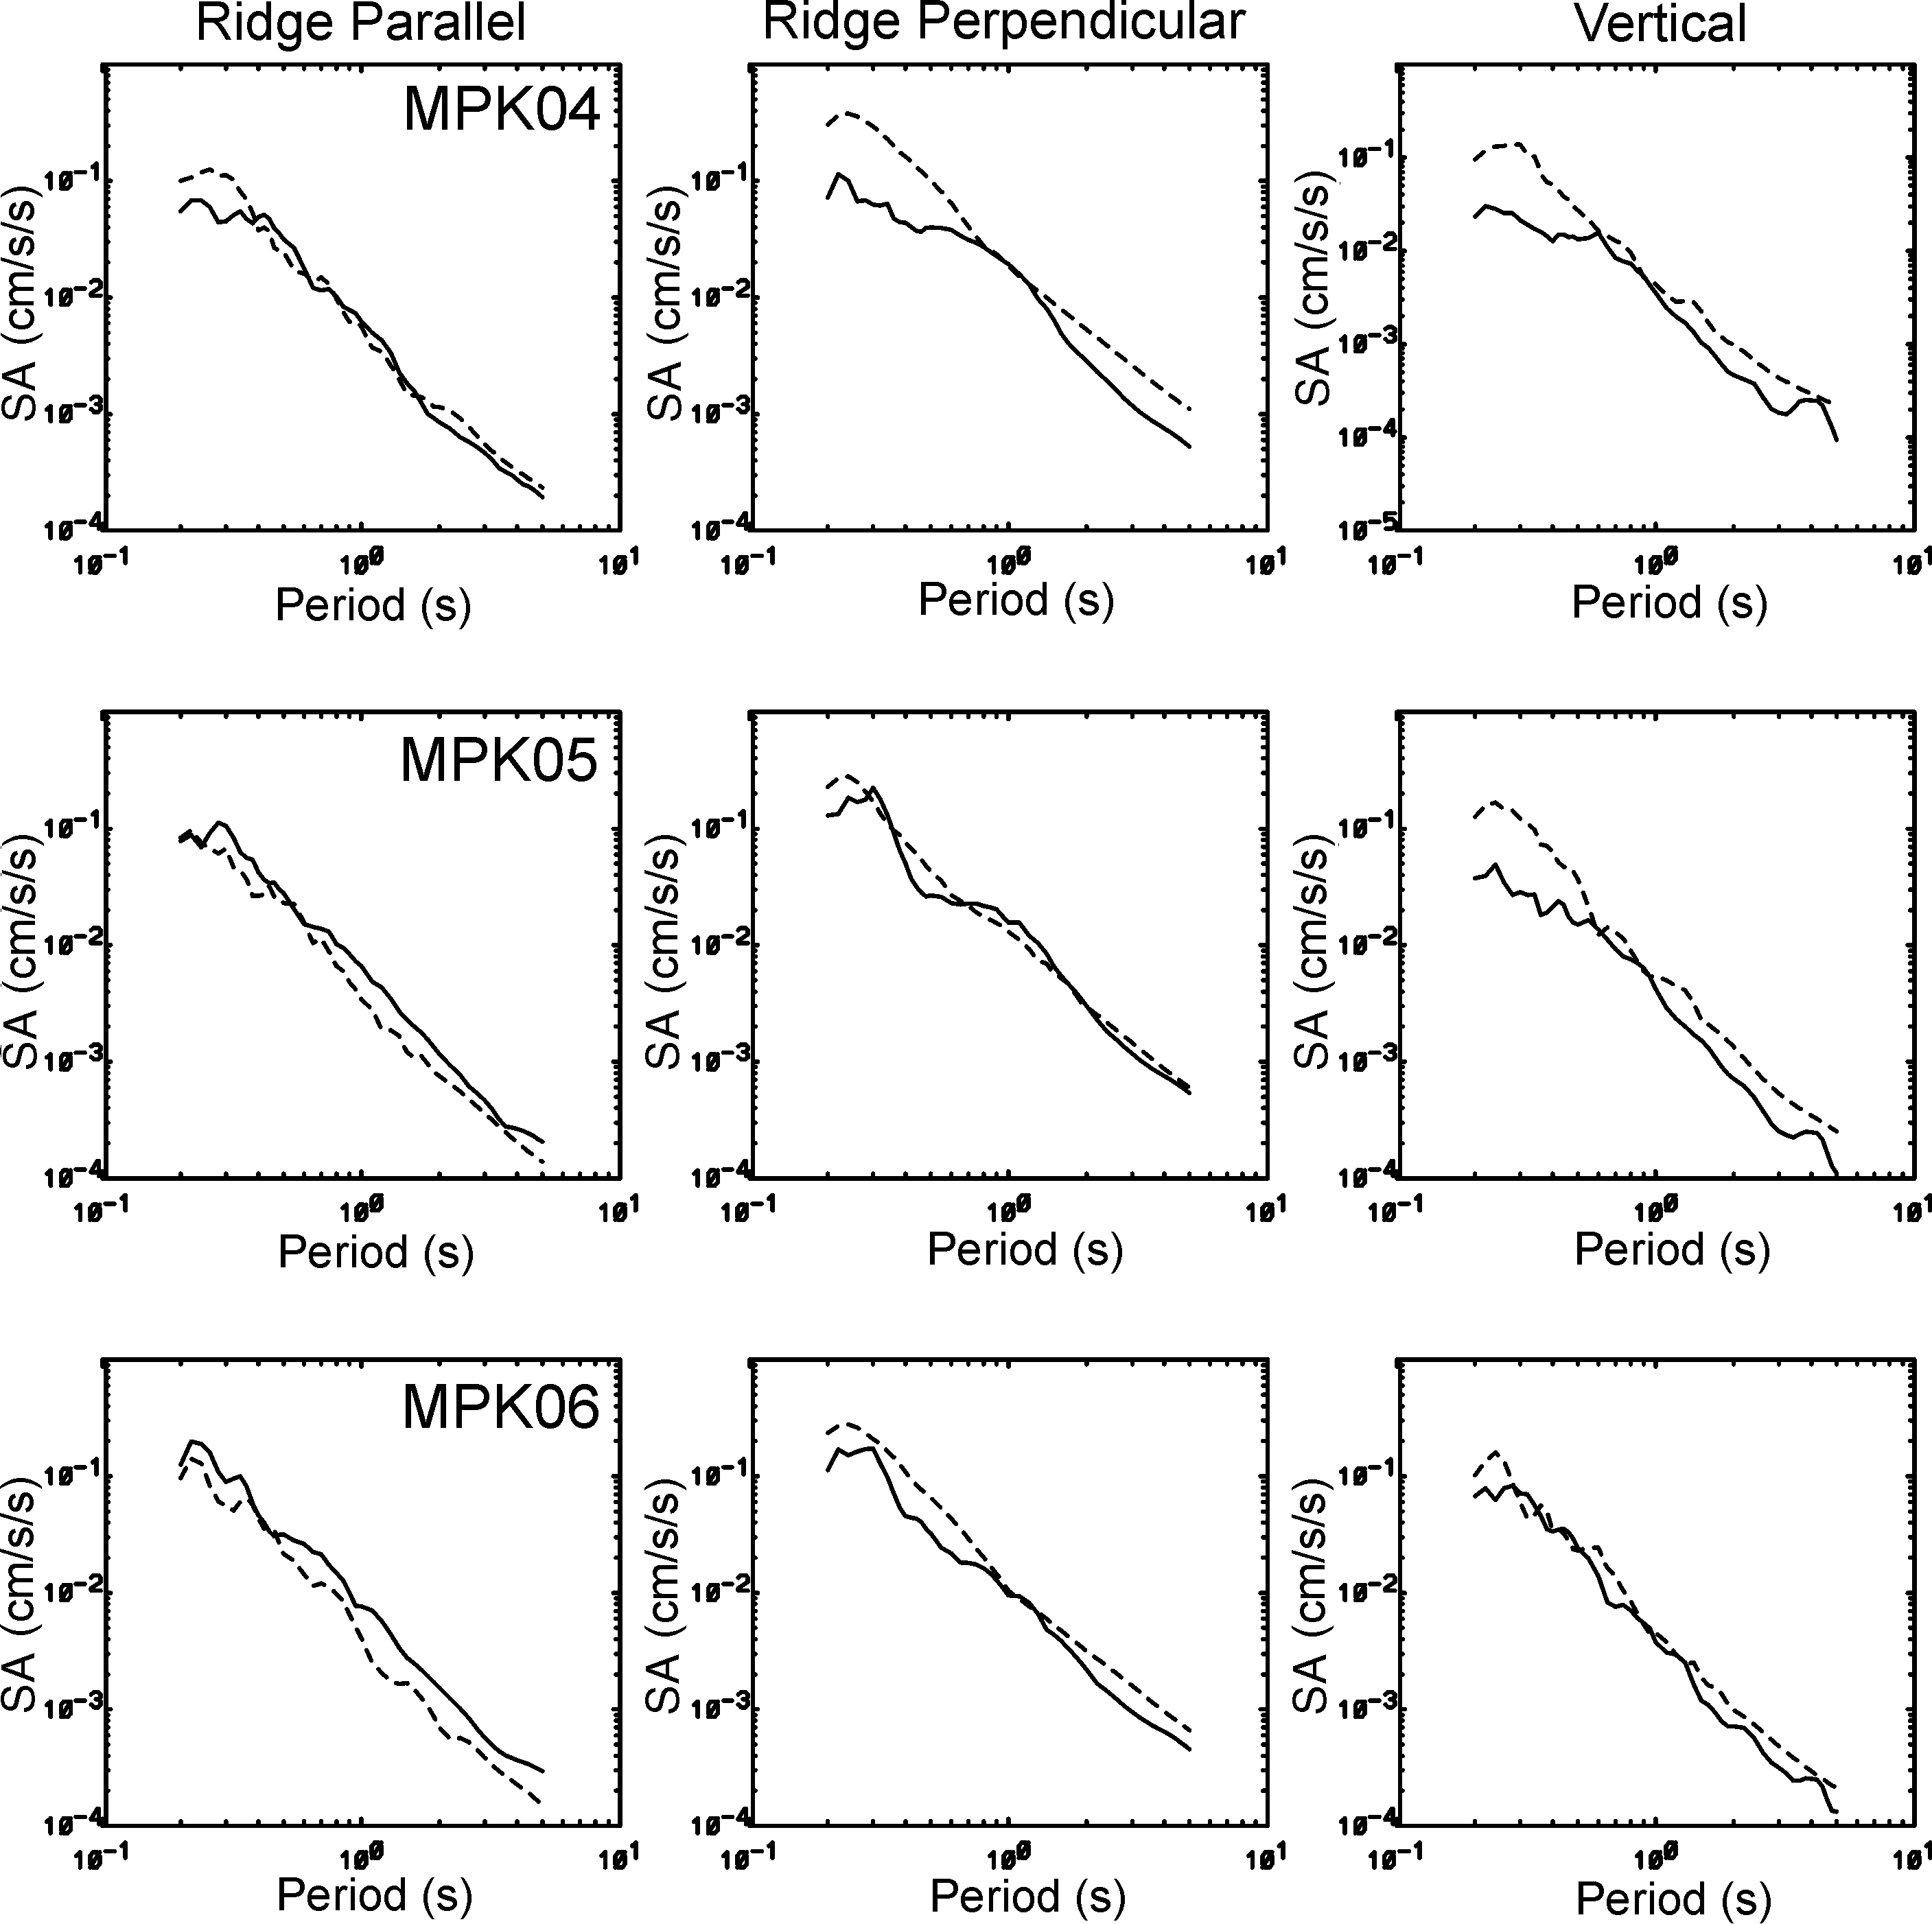
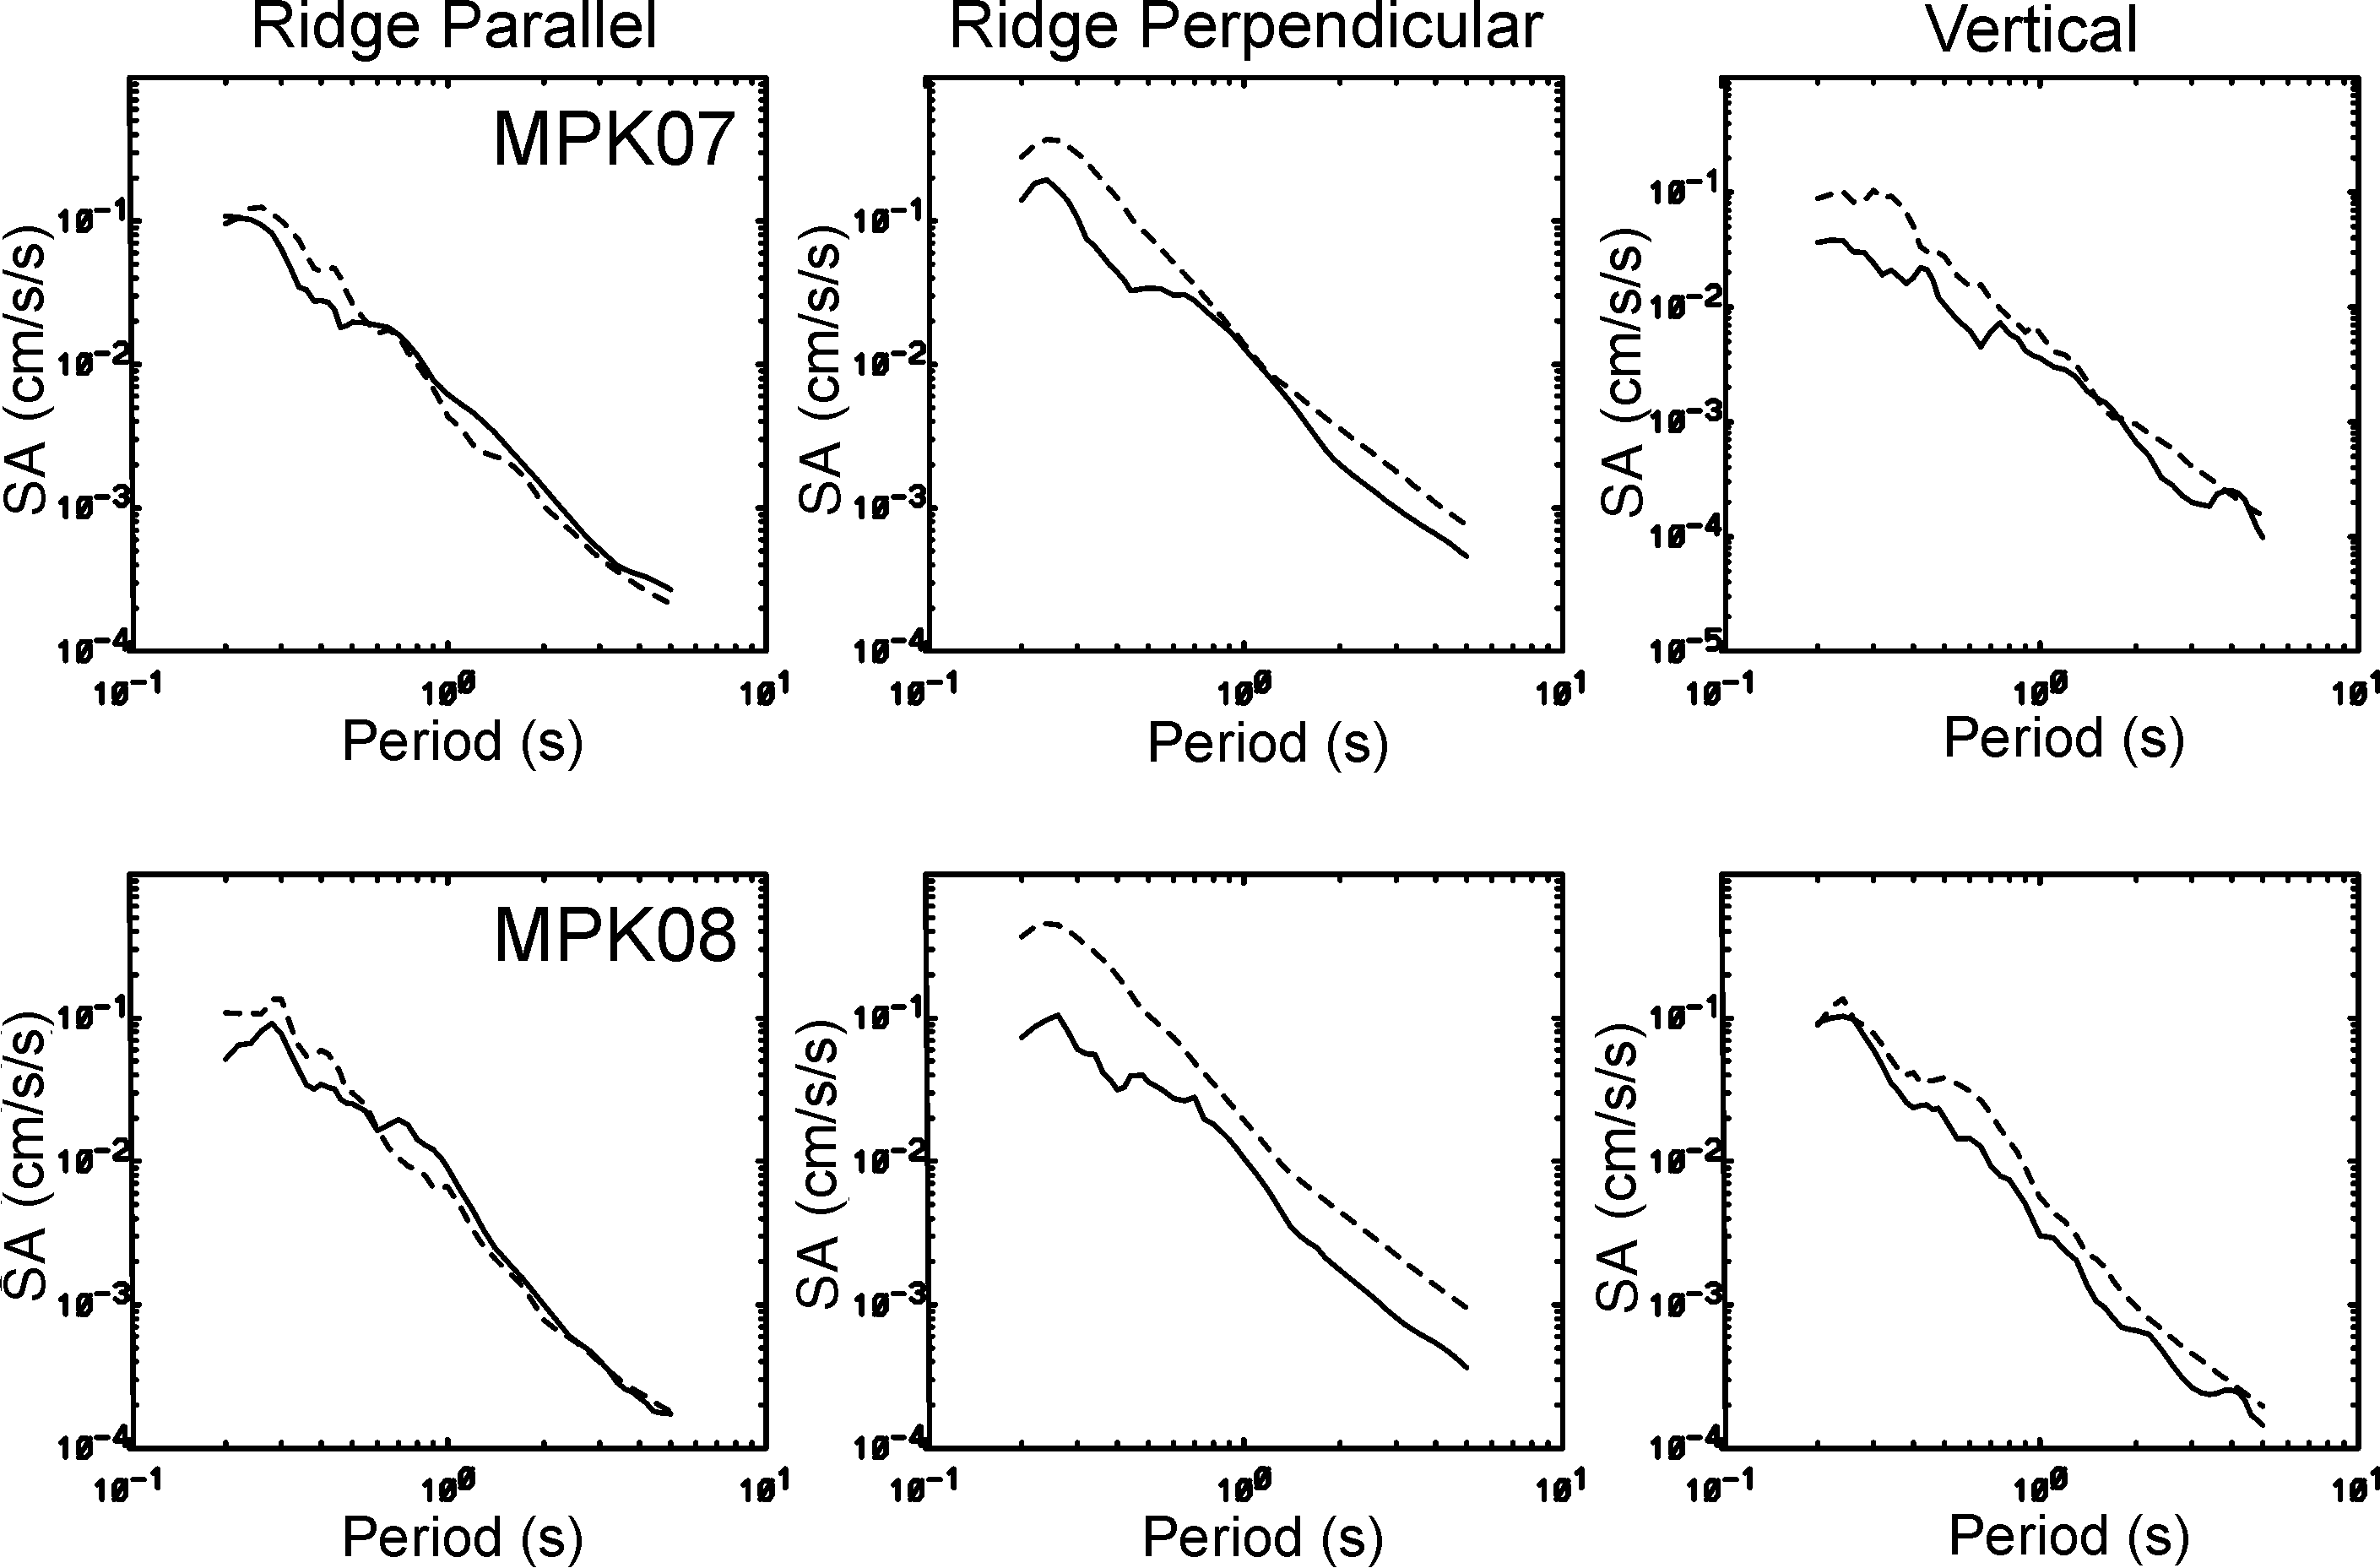
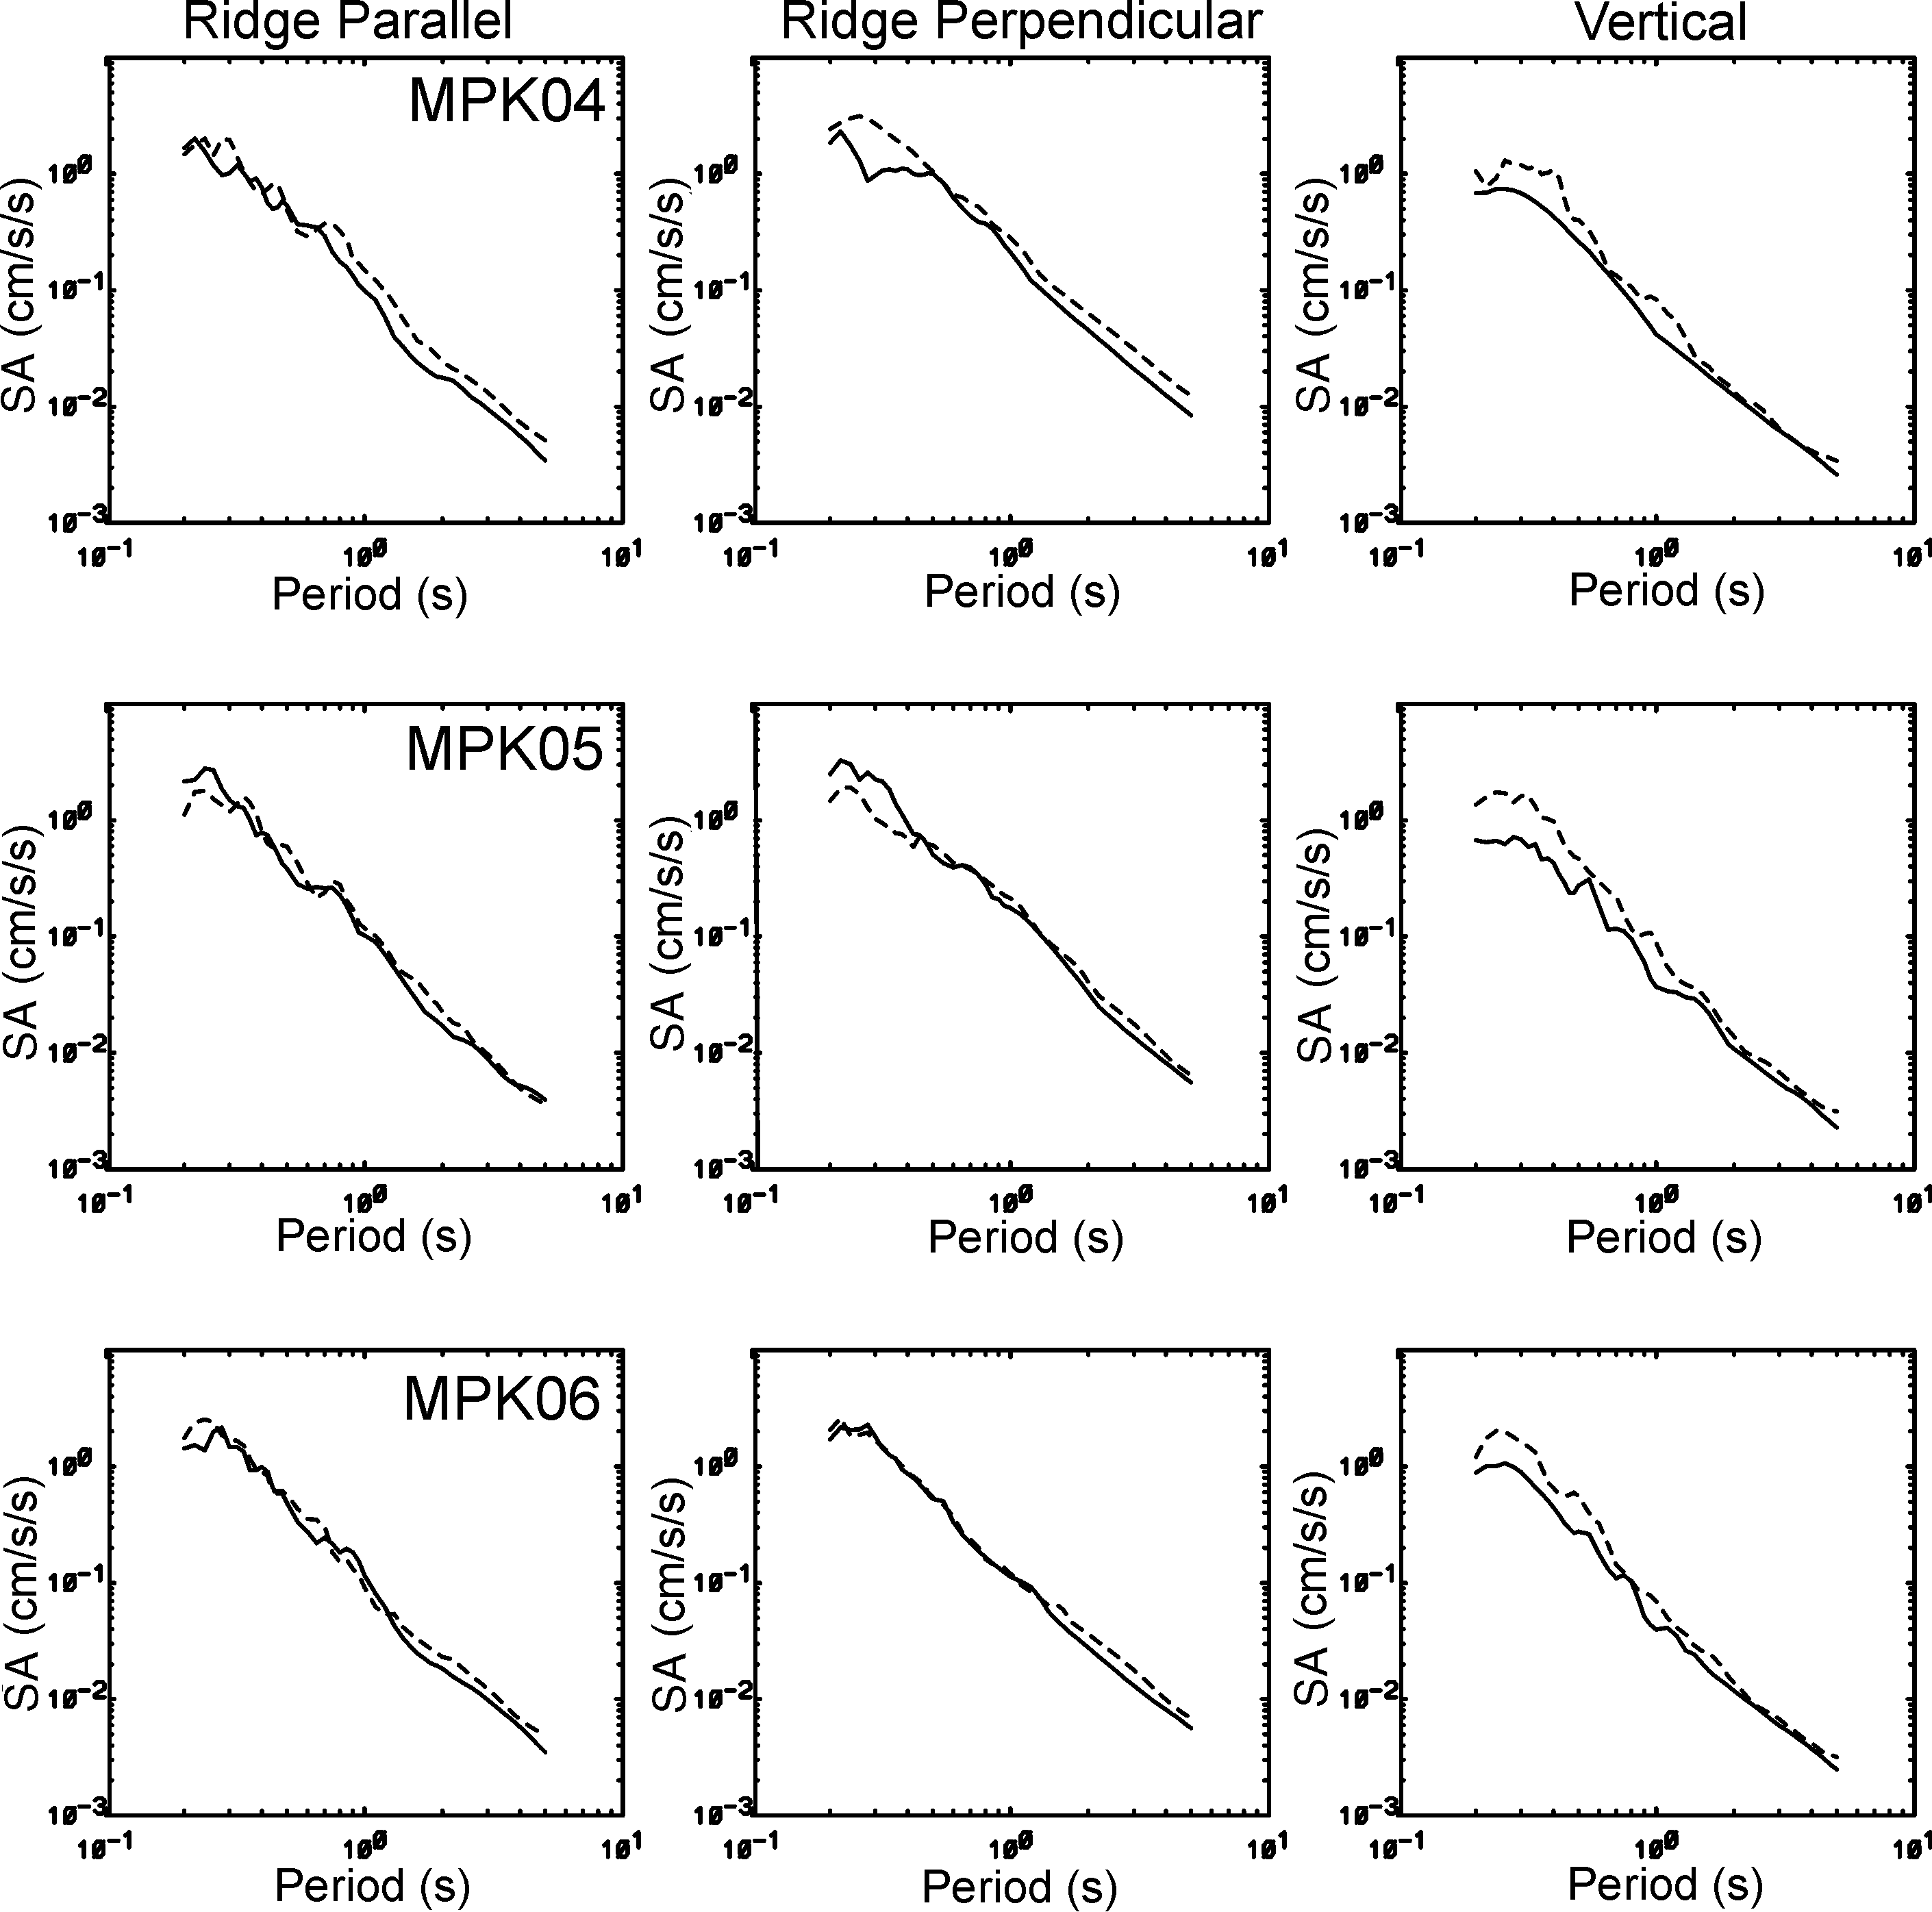
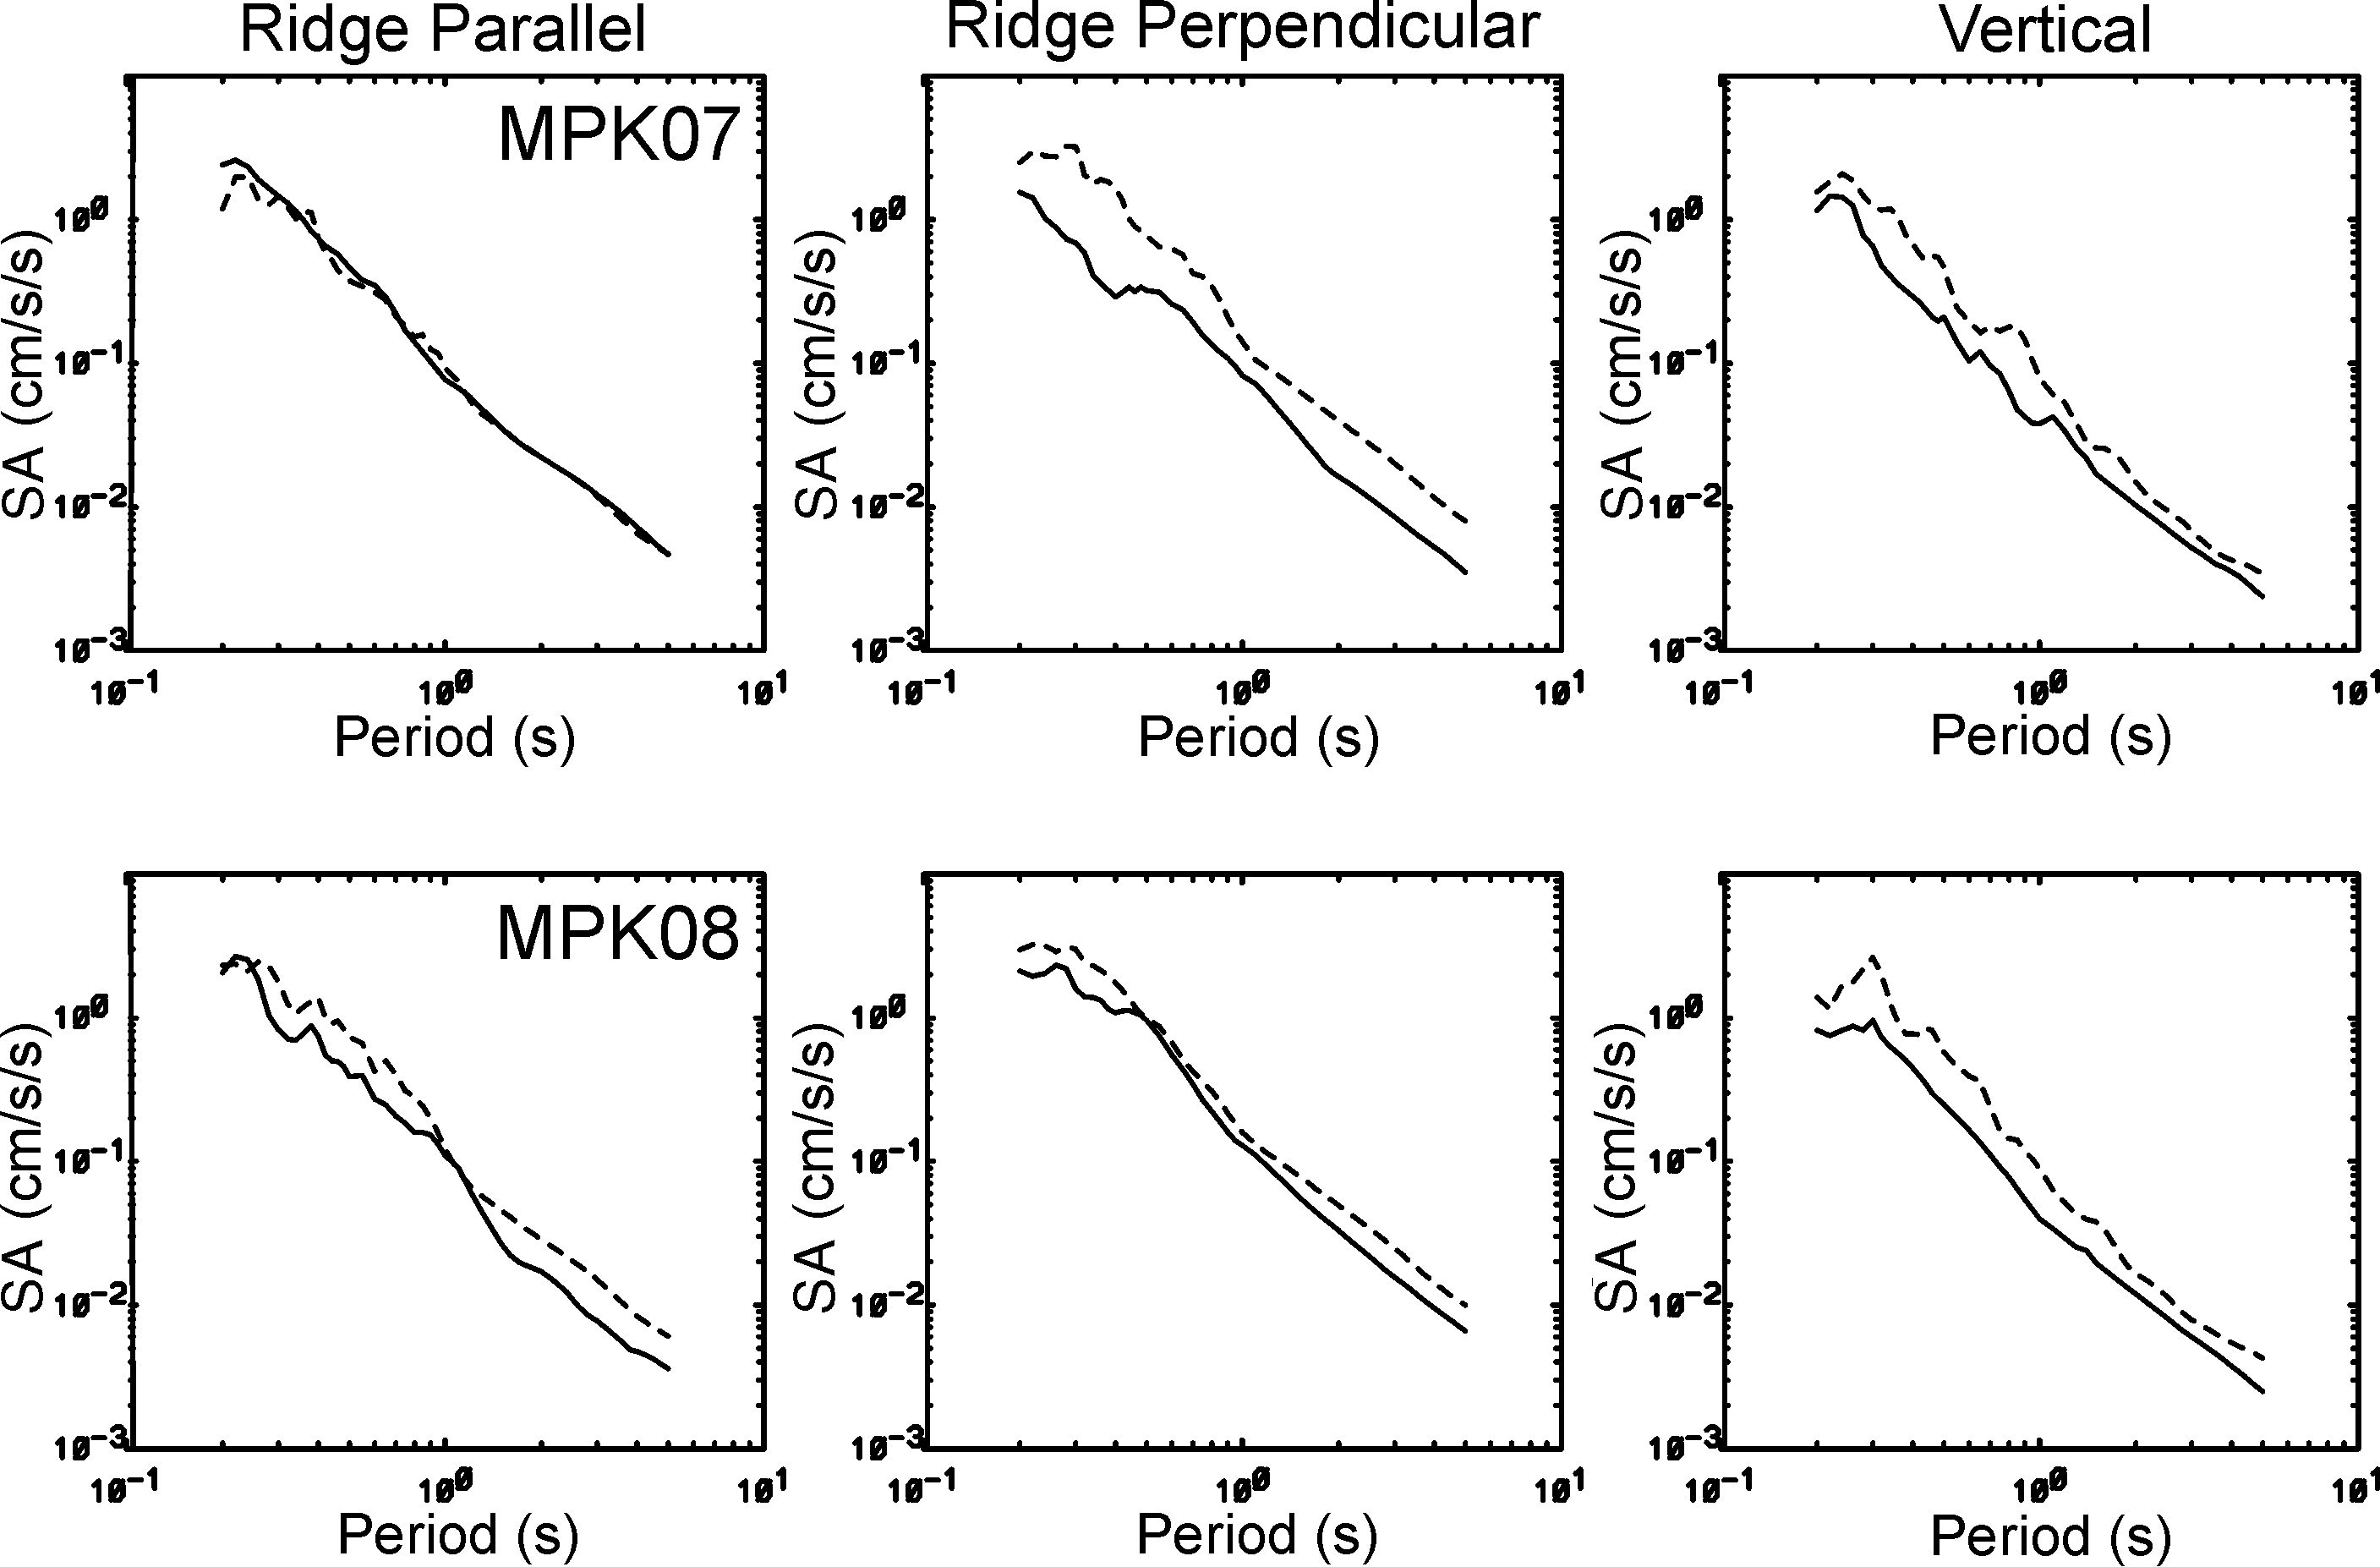
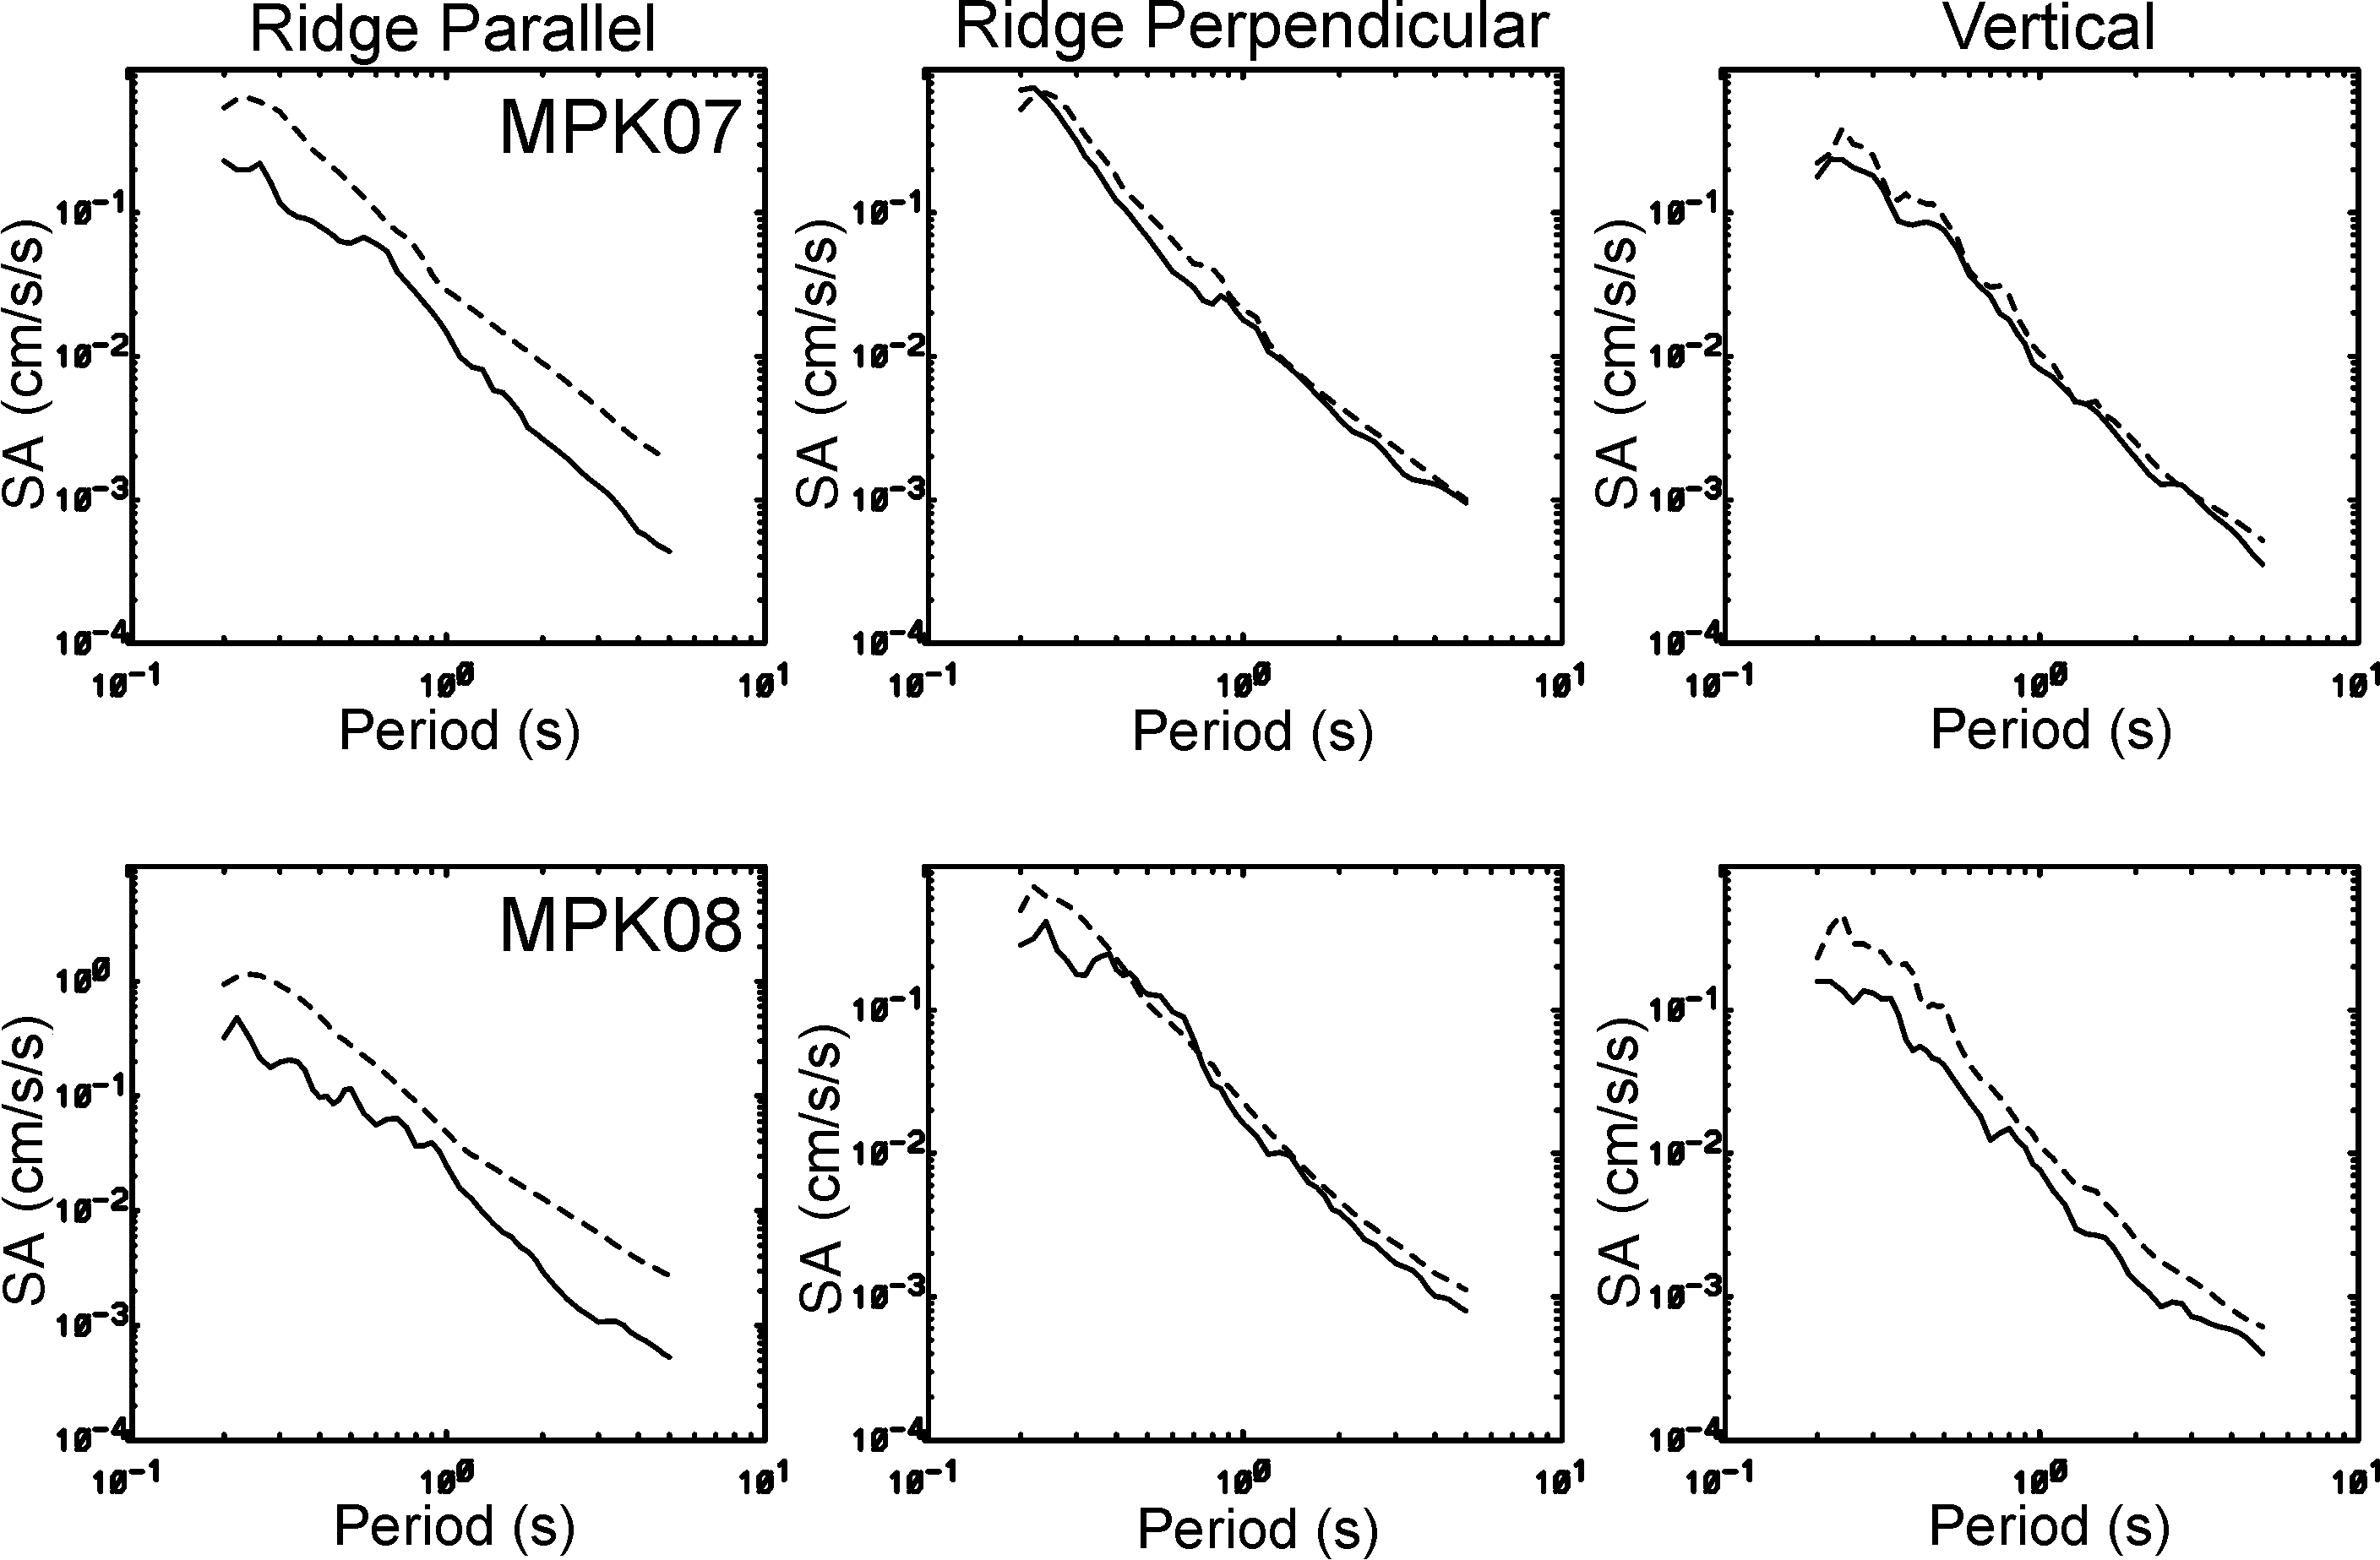
Figure S1. Comparison of 5% damped acceleration response spectra for data (solid traces) and synthetics (dashed traces) for source 6 with Mw 2.13, distance of 10.6 km, and back azimuth of 28° (see Fig. 1 in the main article for location). Spectra are plotted from 0.2 to 5.0 s. (a) Comparison at stations MPK01, MPK02, and MPK03. (b) Comparison at stations MPK04, MPK05, and MPK06. (c) Comparison at stations MPK07 and MPK08.
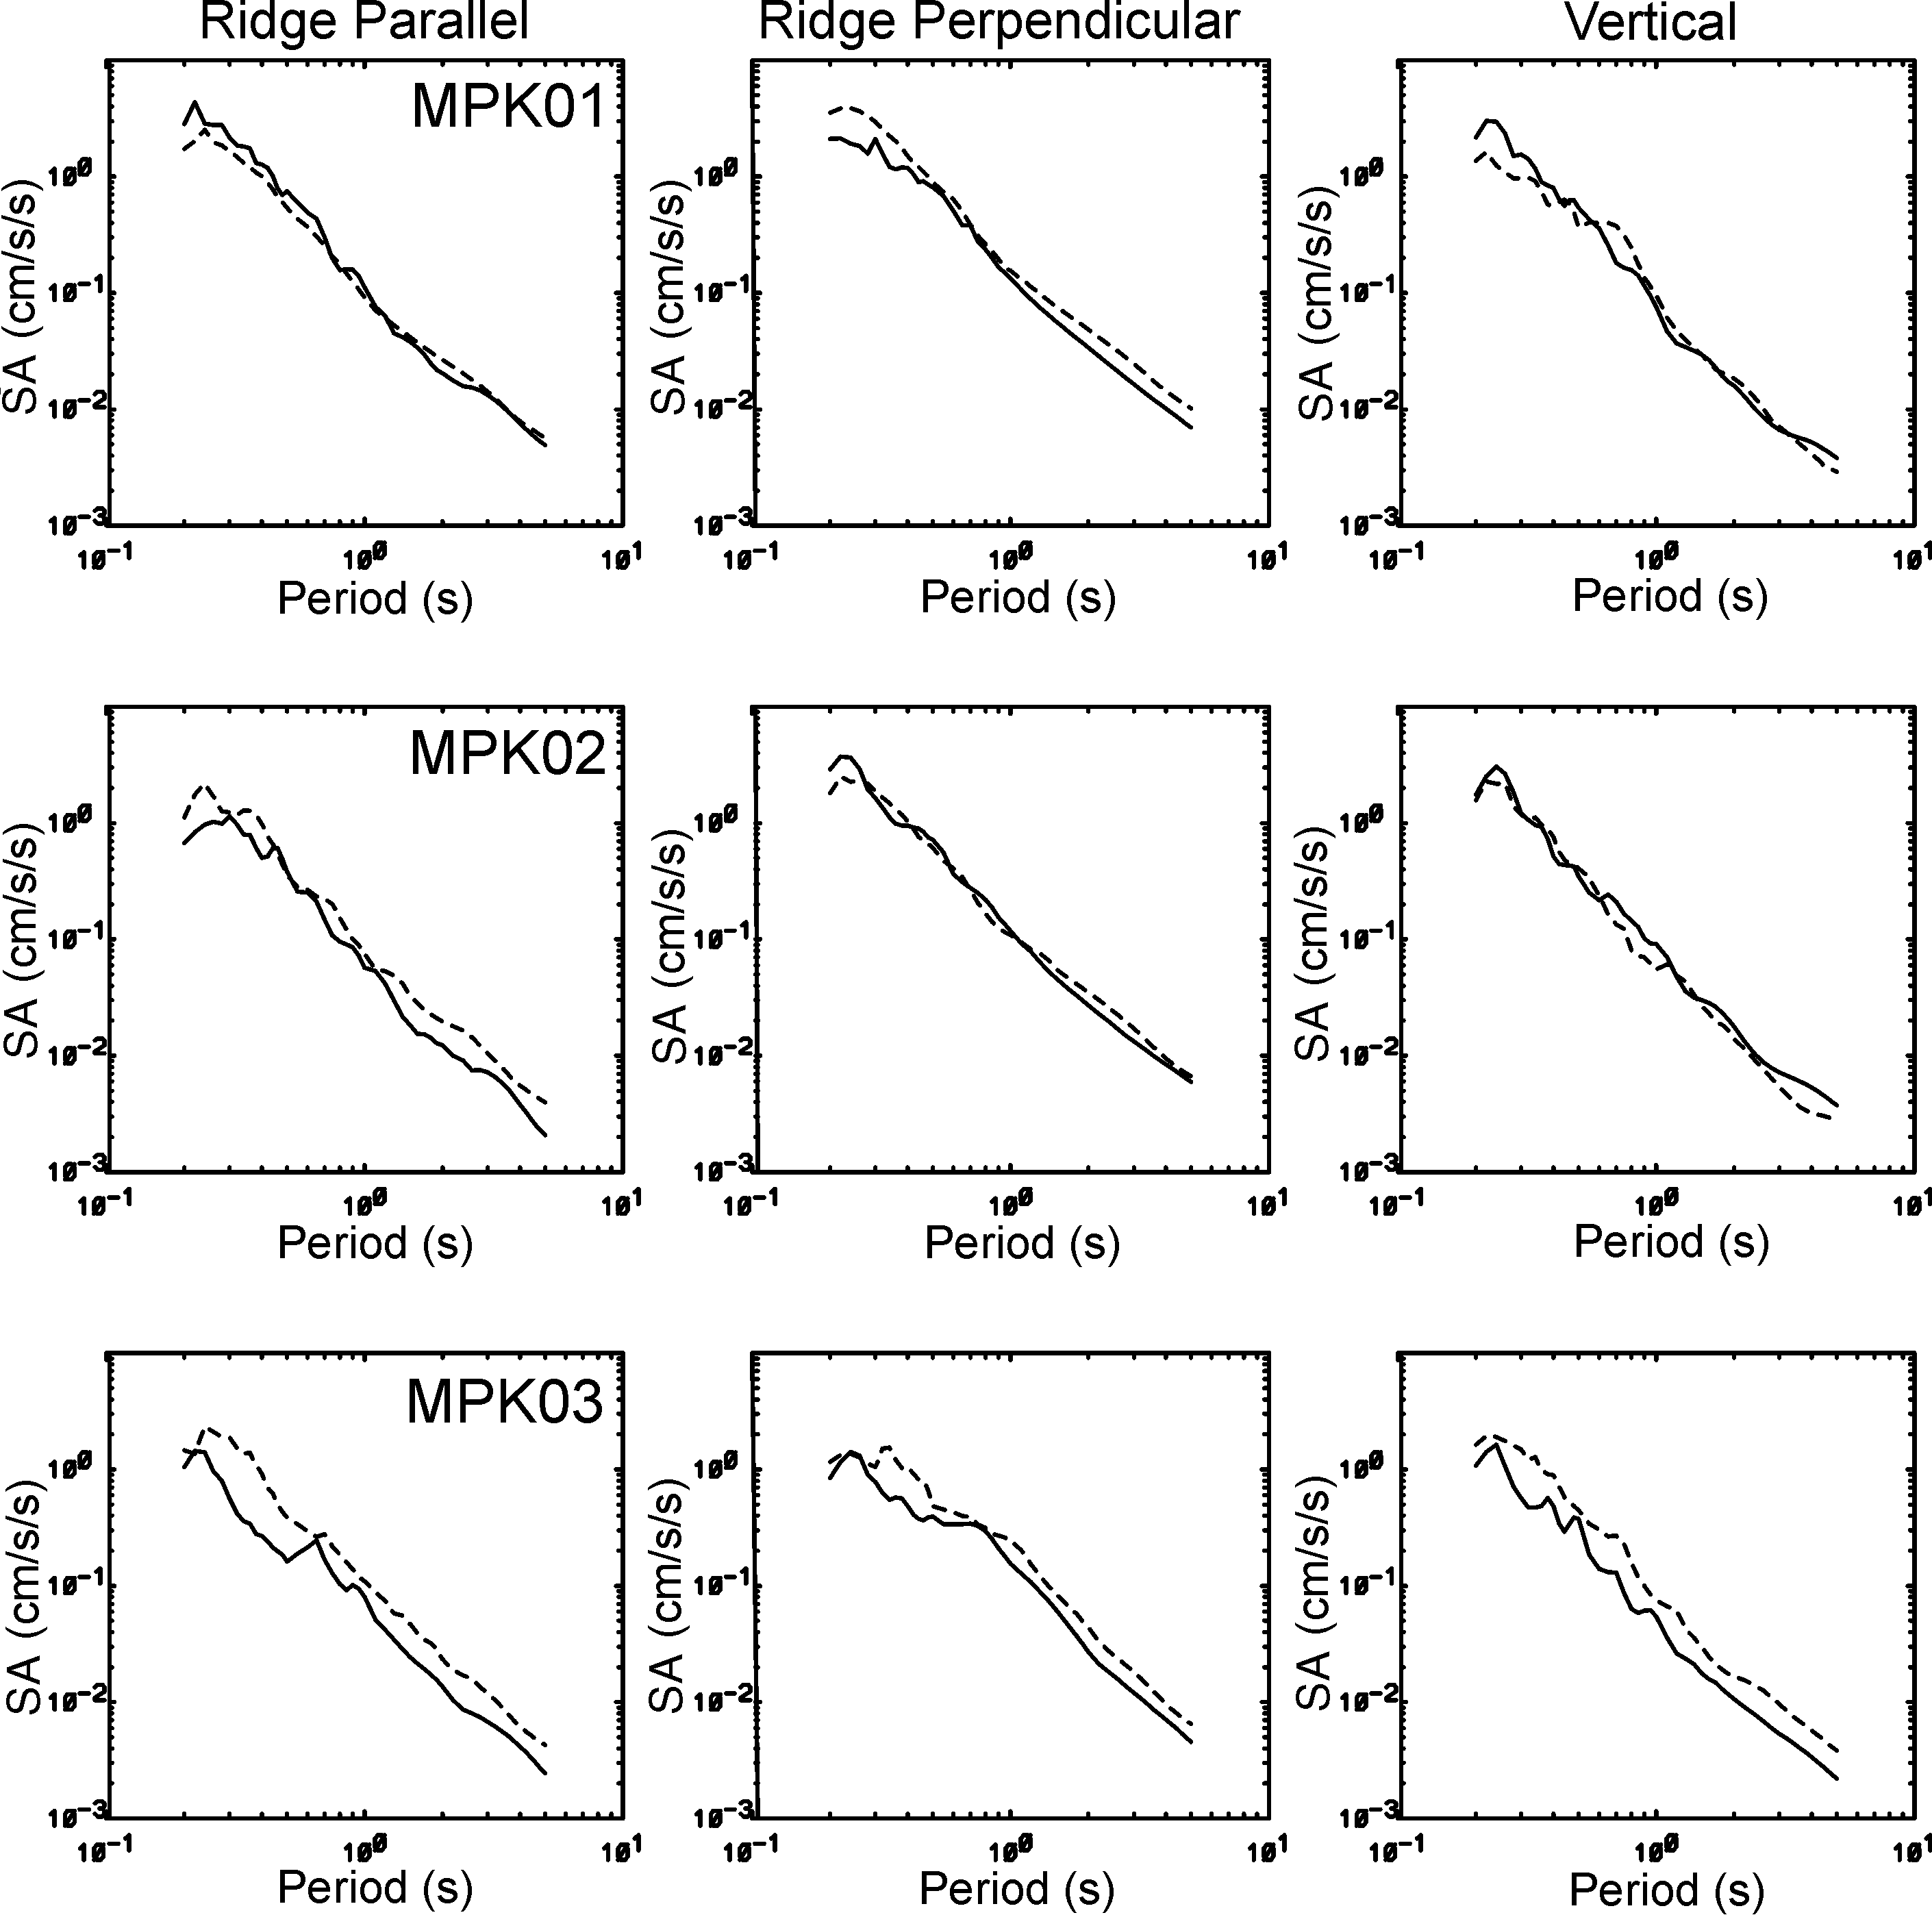
Figure S2. Comparison of 5% damped acceleration response spectra for data (solid traces) and synthetics (dashed traces) for source 13 with Mw 2.88, distance of 5.0 km, and back azimuth of 306° (see Fig. 1 in the main article for location). Spectra are plotted from 0.2 to 5.0 s. (a) Comparison at stations MPK01, MPK02, and MPK03. (b) Comparison at stations MPK04, MPK05, and MPK06. (c) Comparison at stations MPK07 and MPK08.
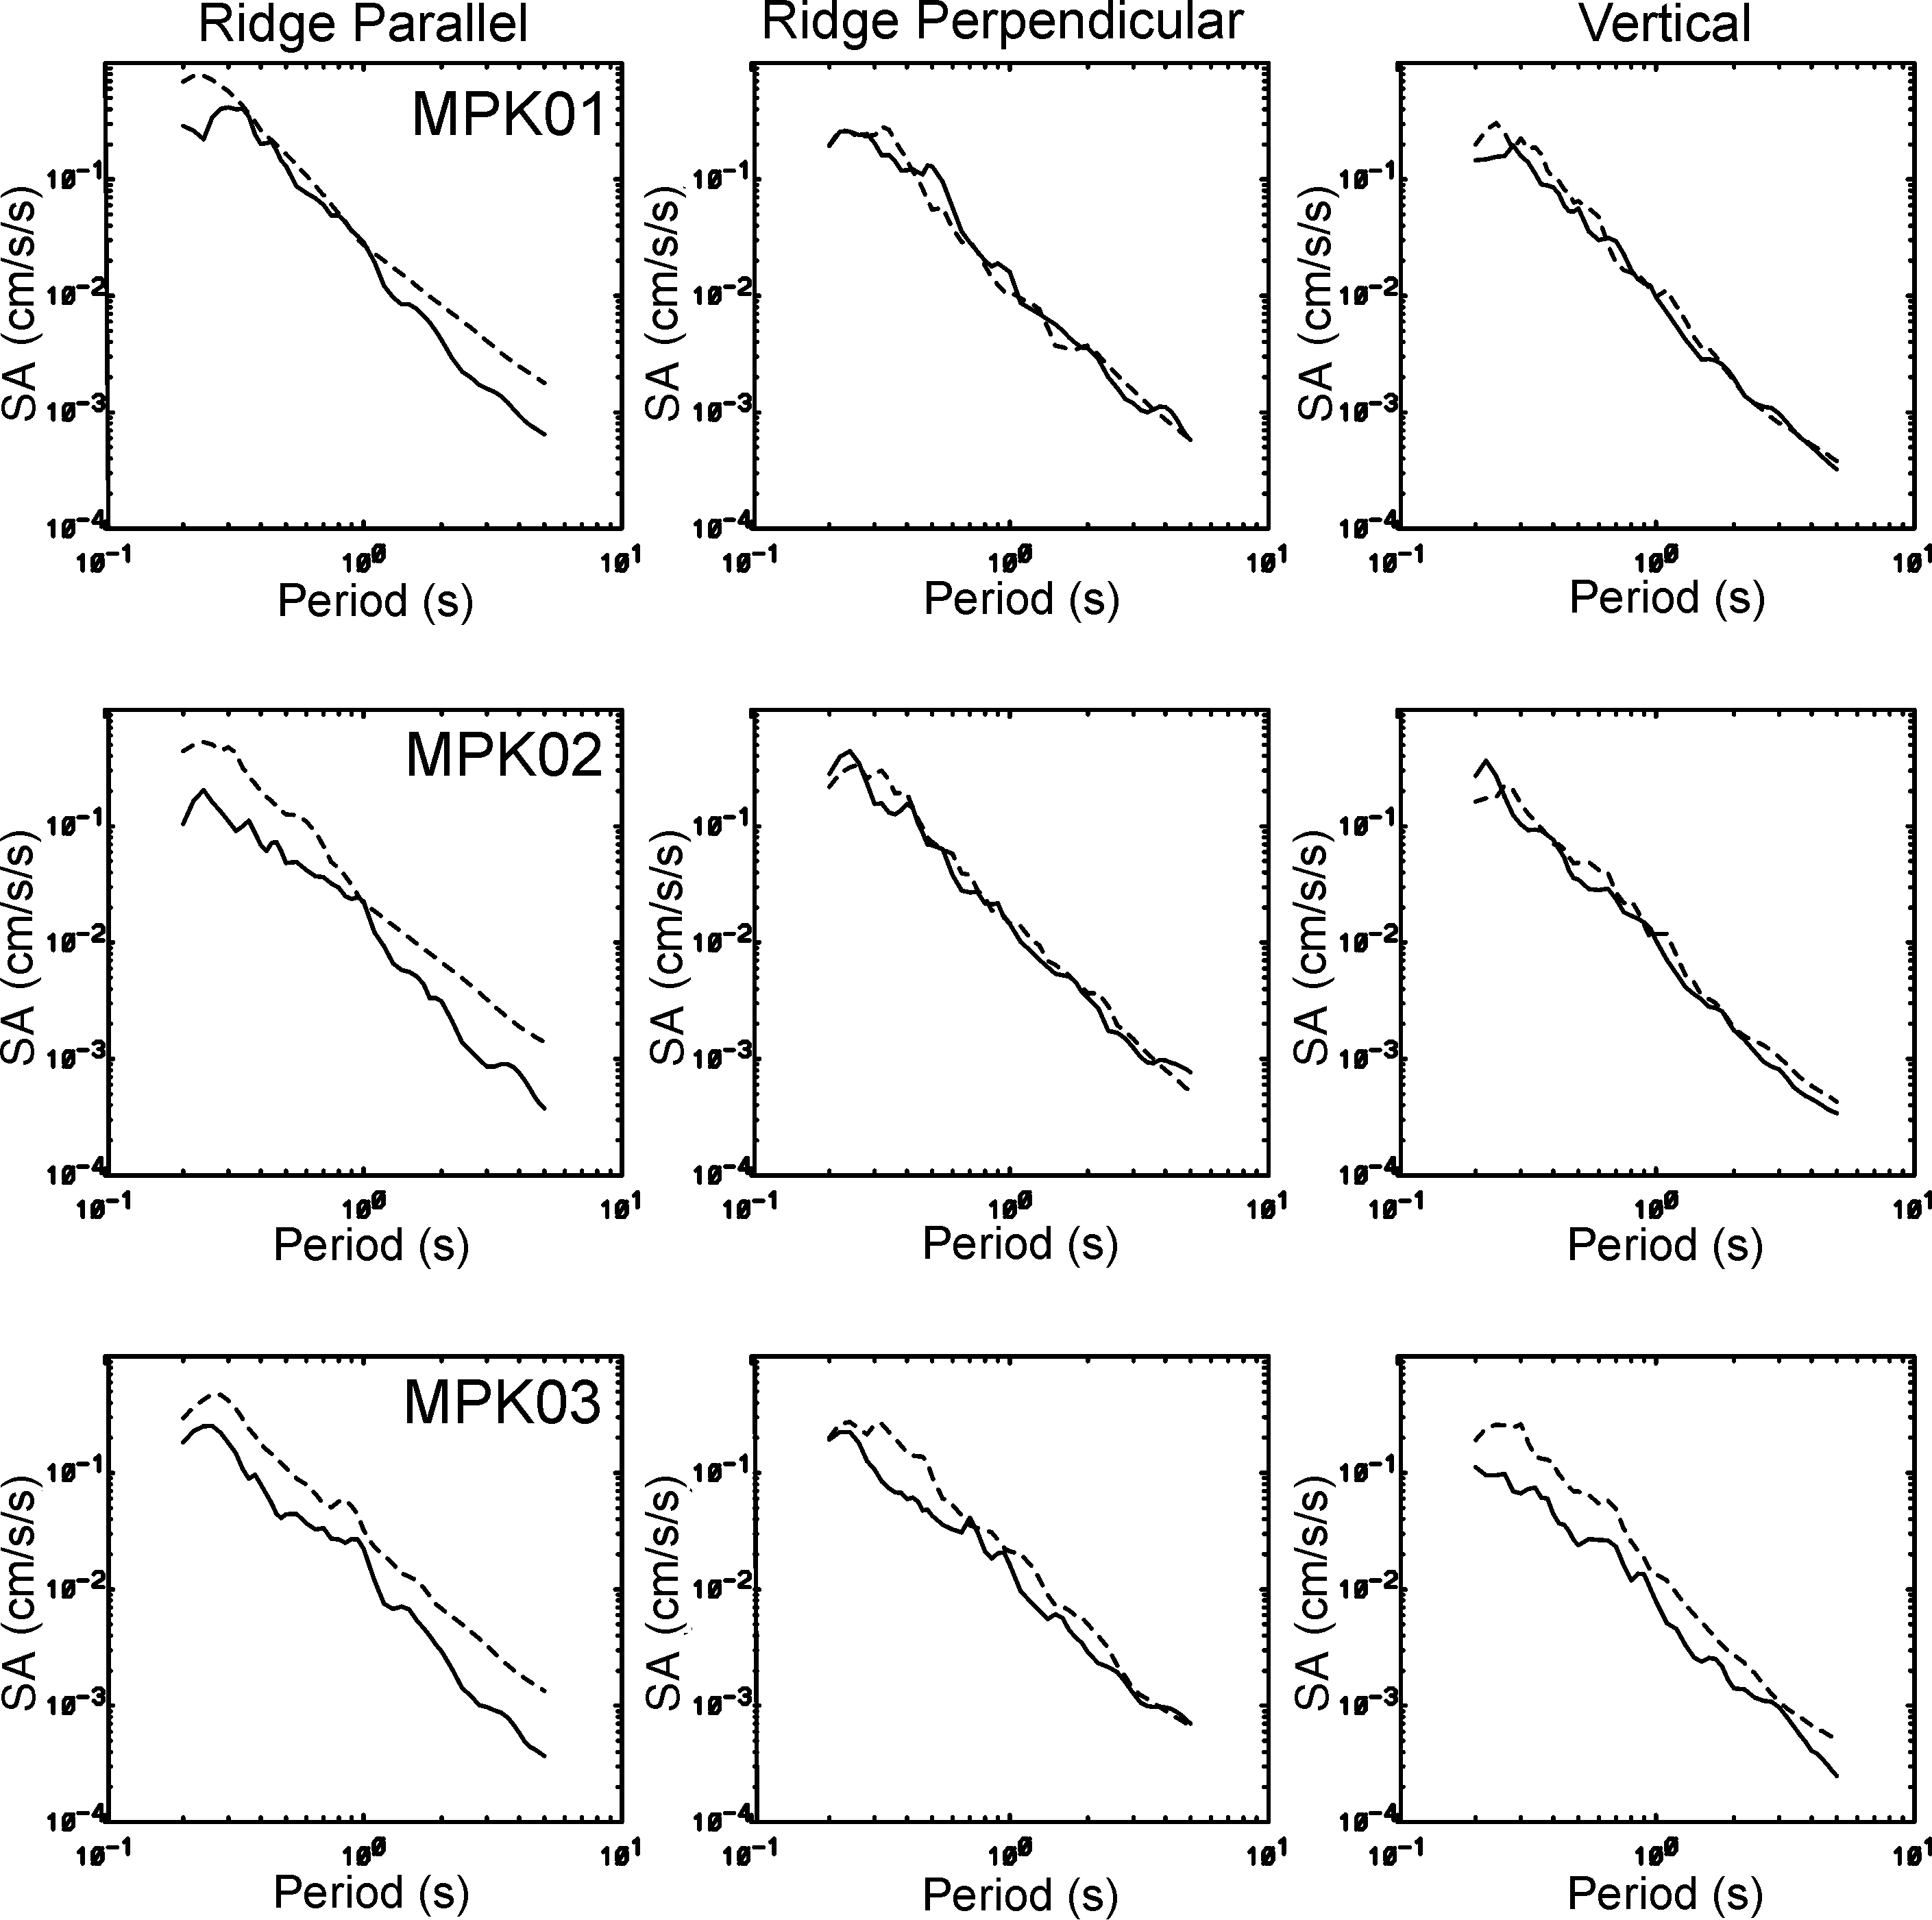
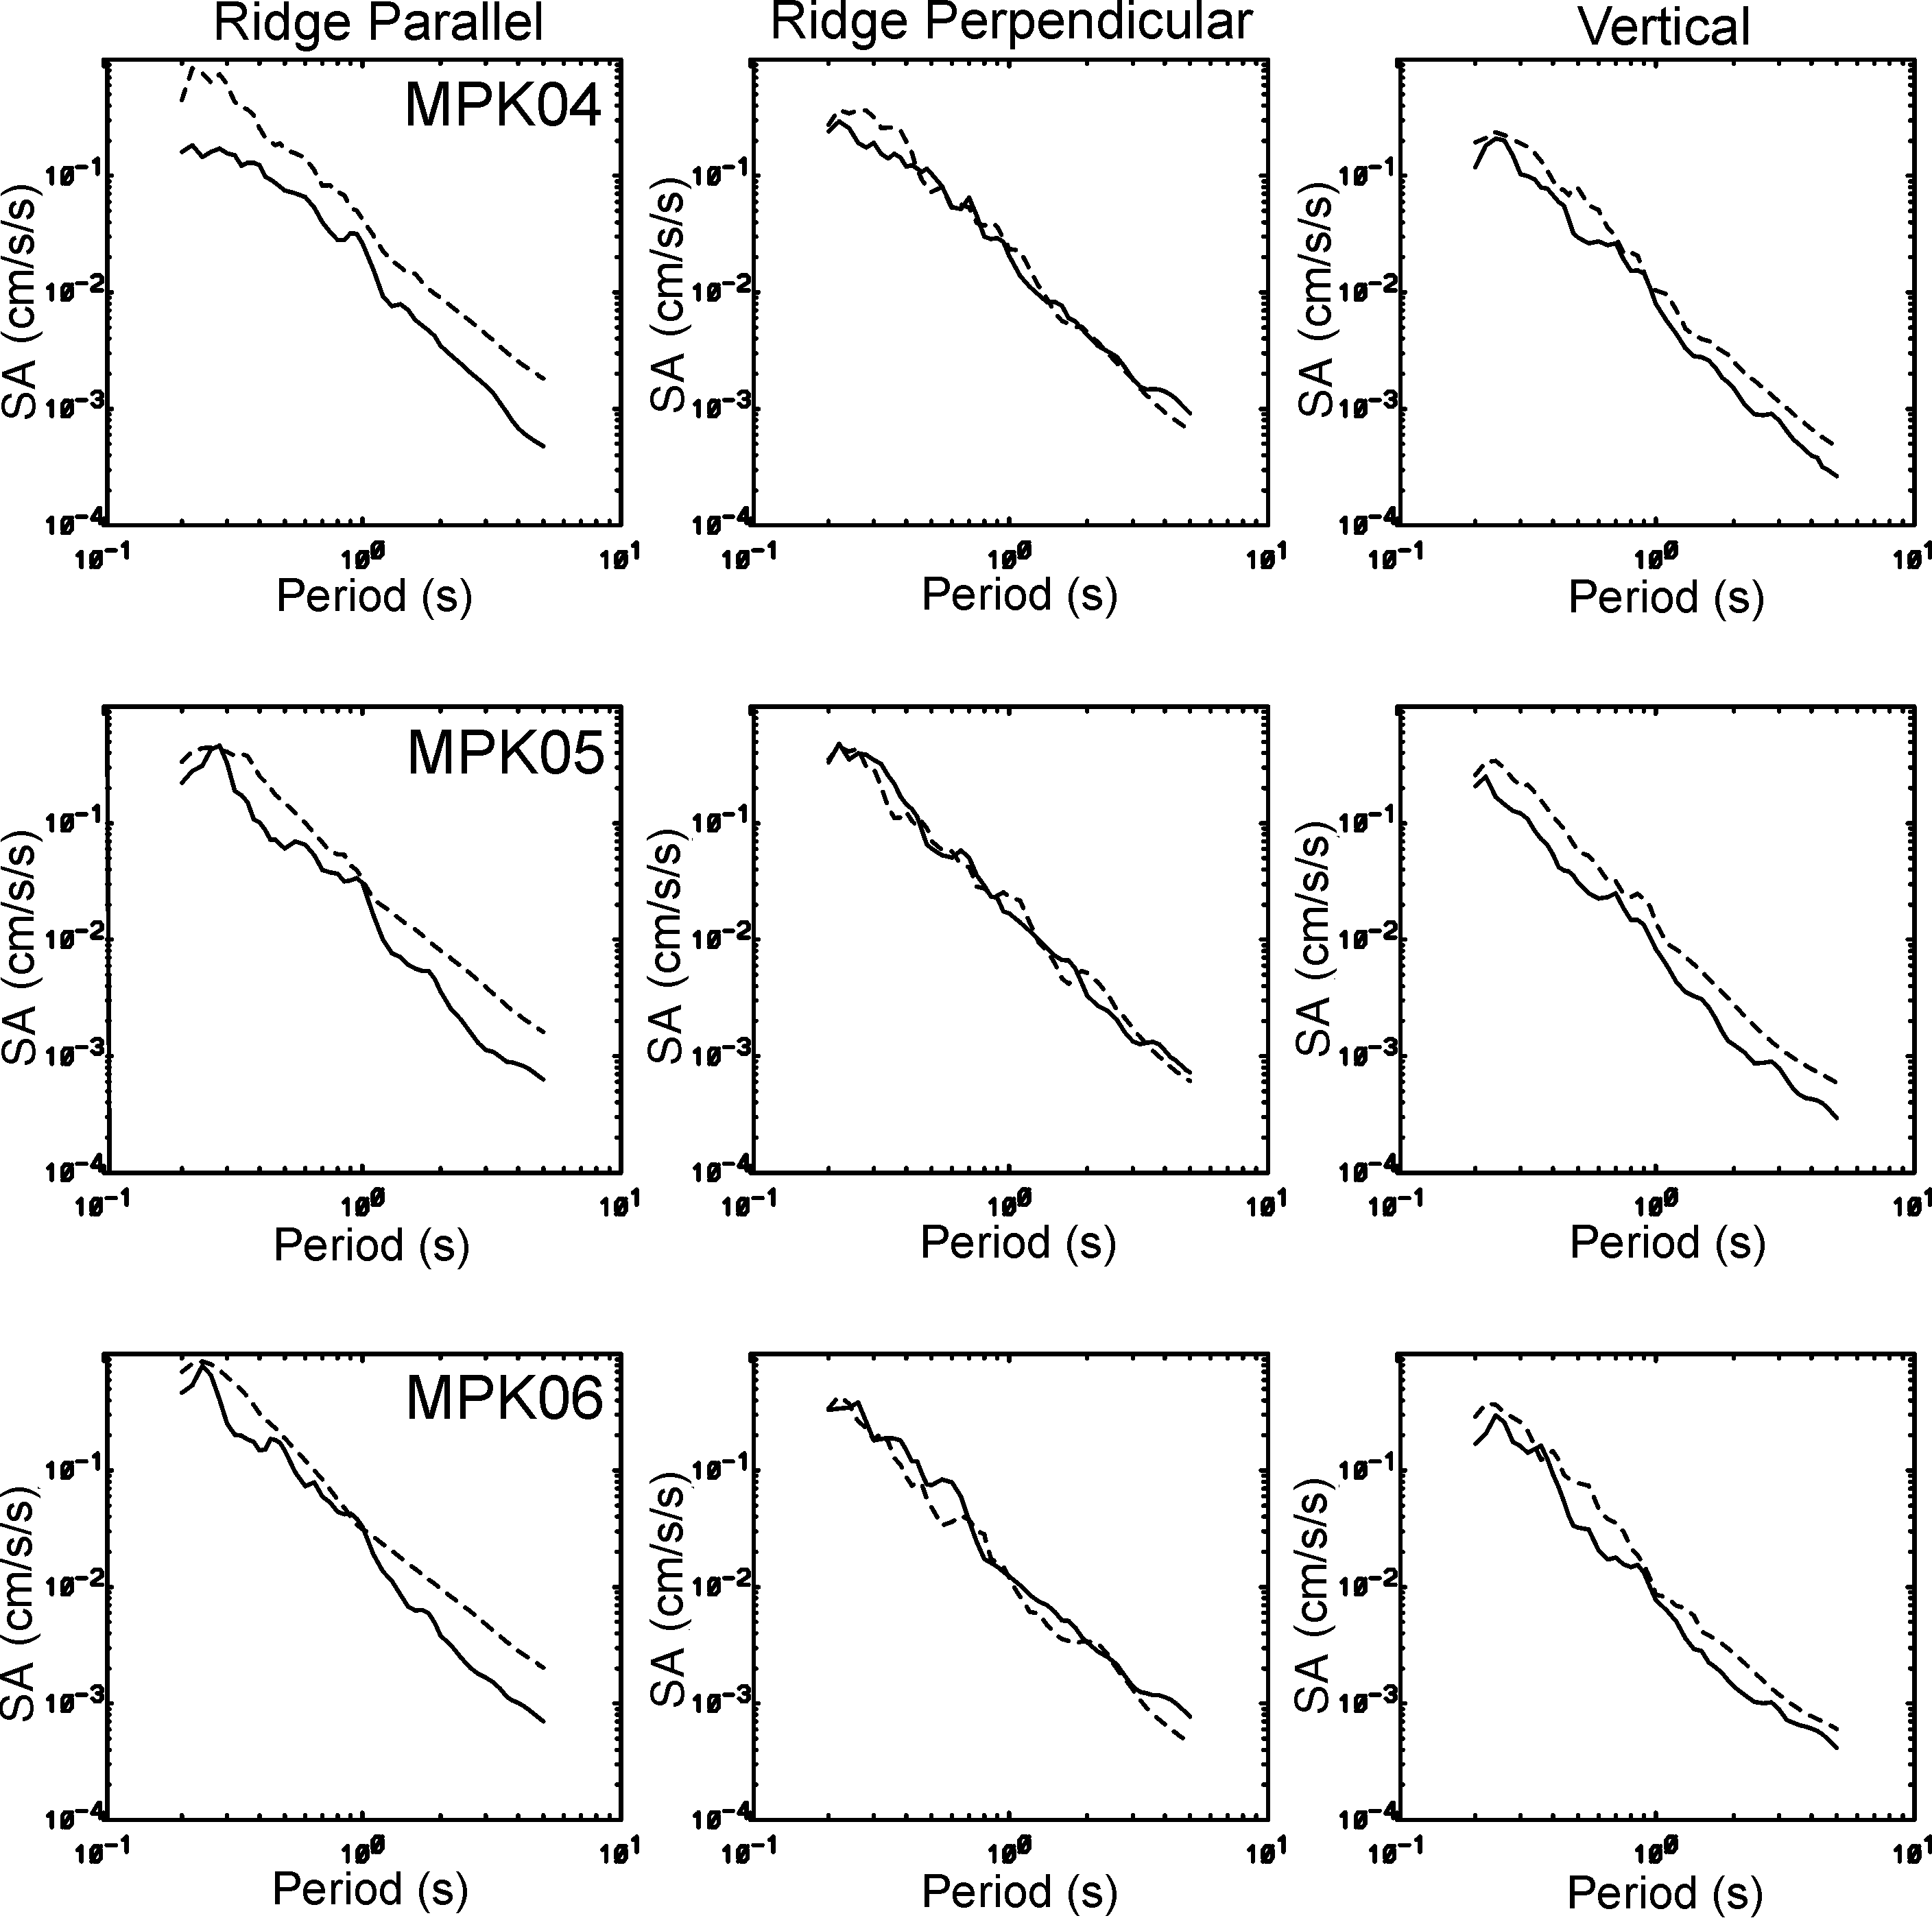
Figure S3. Comparison of 5% damped acceleration response spectra for data (solid traces) and synthetics (dashed traces) for source 17 with Mw 2.39, distance of 6.9 km, and back azimuth of 124° (see Fig. 1 in the main article for location). Spectra are plotted from 0.2 to 5.0 s. (a) Comparison at stations MPK01, MPK02, and MPK03. (b) Comparison at stations MPK04, MPK05, and MPK06. (c) Comparison at stations MPK07 and MPK08.
Figure S4. Earthquake ground-motion directional response as a function of position on Mission Peak calculated using 11 earthquakes that lie within the northeast and southwest quadrants from the array and are more perpendicular to the major axis of Mission Peak. Spectral amplification factors are calculated by rotating the horizontal components into different compass directions in 5° increments and relative to the reference site MPK07.
The elevation data used are derived using the 1/3-arcsec U.S. Geological Survey (USGS) digital elevation model (DEM) of the region, available at http://nationalmap.gov/viewer.html (last accessed March 2016). The 3D velocity model is available from the USGS website, http://earthquake.usgs.gov/data/3dgeologic (last accessed March 2016). These databases have been approved for release and publication by the USGS. Although these databases have been subjected to rigorous review and are substantially complete, the USGS reserves the right to revise the data pursuant to further analysis and review. Furthermore, they are released on condition that neither the USGS nor the U.S. Government may be held liable for any damages resulting from its authorized or unauthorized use. The ground-motion data are available from the Incorporated Research Institutions for Seismology (IRIS; http://www.iris.edu, last accessed March 2016). Images of study are from 2013 Google Earth.
Bielak, J., R. W. Graves, K. B. Olsen, R. Taborda, L. Ramirez-Guzman, S. M. Day, G. P. Ely, D. Roten, T. H. Jordan, P. J. Maechling, et al. (2010). The ShakeOut earthquake scenario: Verification of three simulation sets, Geophys. J. Int. 180, no. 1, 375–404.
Hartzell, S., S. Harmsen, R. A. Williams, D. Carver, A. Frankel, G. Choy, P.-C. Liu, R. C. Jachens, T. M. Brocher, and C. M. Wentworth (2006). Modeling and validation of a 3D velocity structure for the Santa Clara Valley, California, for seismic-wave simulations, Bull. Seismol. Soc. Am. 96, 1851–1881.
Koketsu, K., H. Fujiwara, and Y. Ikegami (2004). Finite-element simulation of seismic ground motion with a voxel mesh, Pure Appl. Geophys. 161, 2183–2198.
Pitarka, A., and K. Irikura (1996). Modeling 3D surface topography by finite-difference method: Kobe-JMA station site, Japan, case study, Geophys. Res. Lett. 23, no. 20, 2729–2732.
Tu, T., H. Yu, L. Ramirez-Guzman, J. Bielak, O. Ghattas, K. L. Ma, and D. O’Hallaron (2006). From mesh generation to scientific visualization: An end-to-end approach to parallel supercomputing, Proc. of the 2006 ACM/IEEE Conf. on Supercomputing, Tampa, Florida, 11–17 November 2006.
[ Back ]