This electronic supplement contains figures of Pn-wave snapshots, first Pn arrival times, and frequency dependence of the Pn amplitudes.
Calculated Pn-wave snapshots in various 1D models with different mantle lid velocity gradients (Figs. S1–S4). First Pn arrival times for the same 1D models (Fig. S5). Frequency dependence of the Pn amplitudes for the same 1D models (Fig. S6). Pn wavefield snapshots for the uniform crustal model (Figs. S7 and S8).
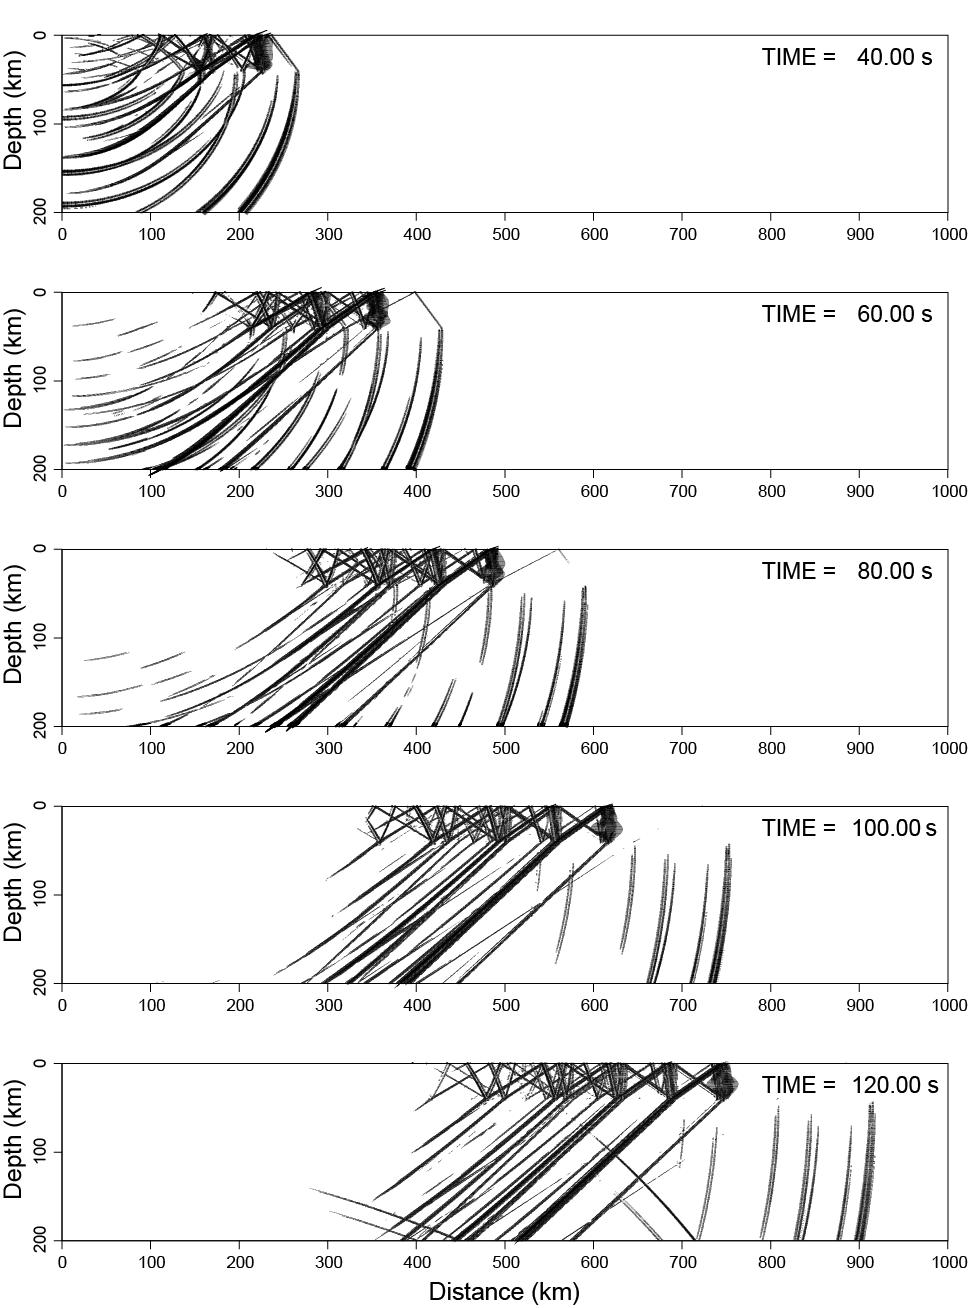
Figure S1. Snapshots of Pn waves propagating in the (constant velocity lid [Const-Lid] w/o earth-flattening transformation [EFT]) model using the enhanced 2D finite-difference code implementation.
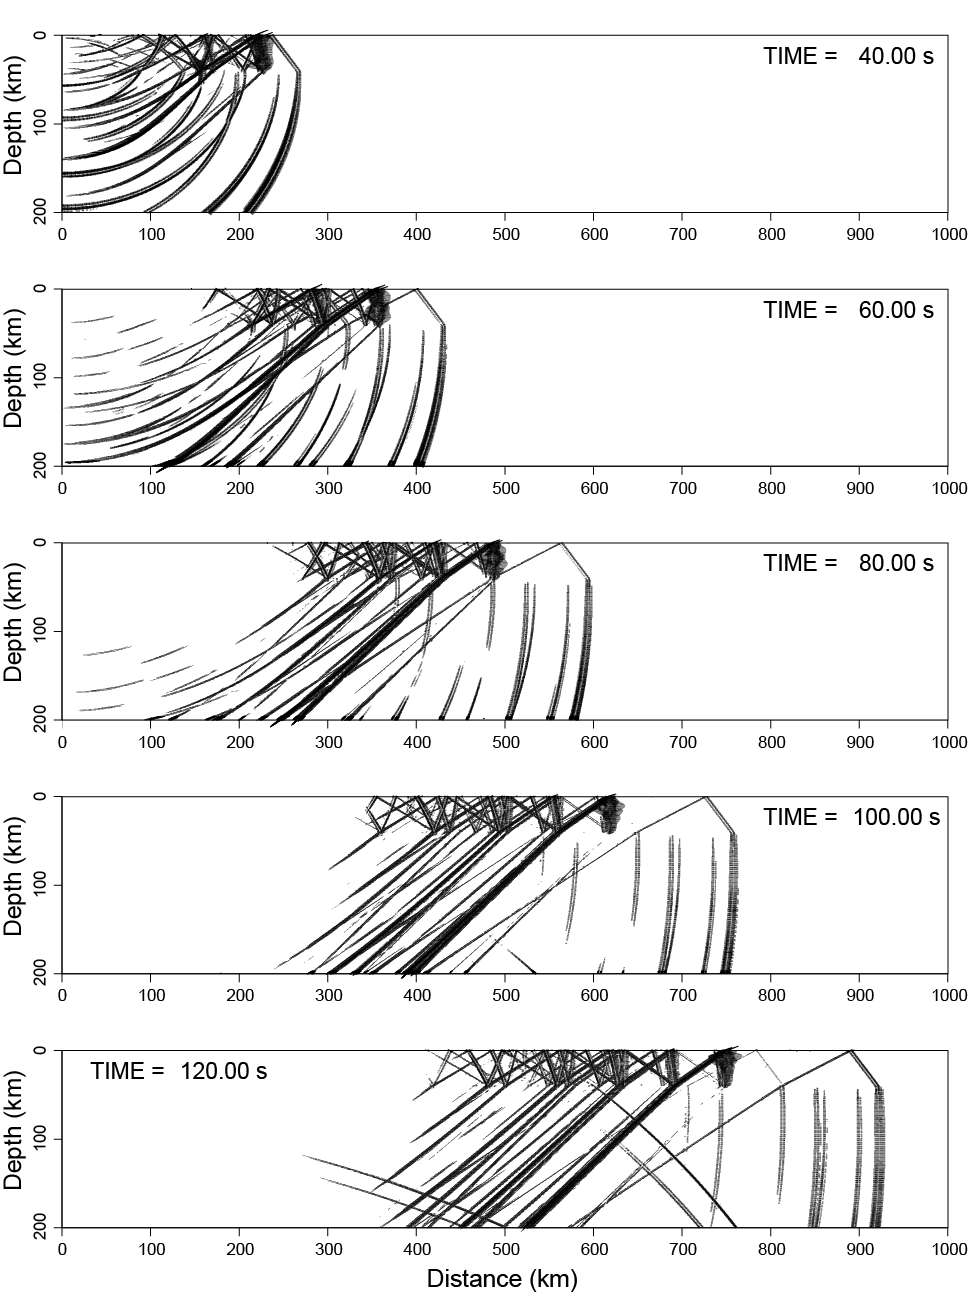
Figure S2. Snapshots of Pn waves propagating in the (Const-Lid) model. Note the enhanced Pn amplitude resulting from the positive velocity gradients from the EFT (compare to Fig. S1).
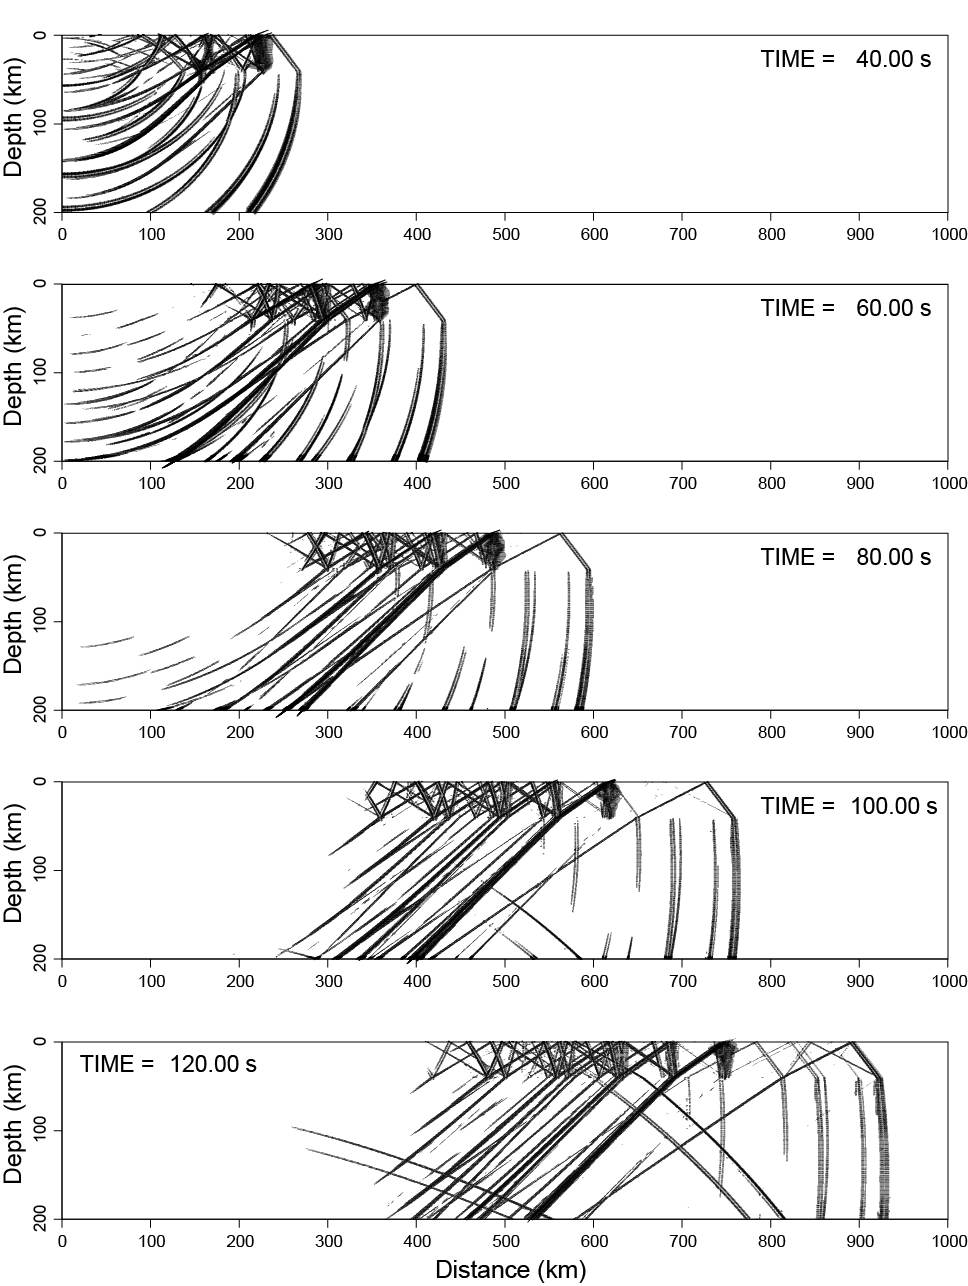
Figure S3. Snapshots of Pn waves propagating in velocity model (Gradient-0.001) with 1 × 10⁻³ s−1 velocity gradient in the upper mantle.
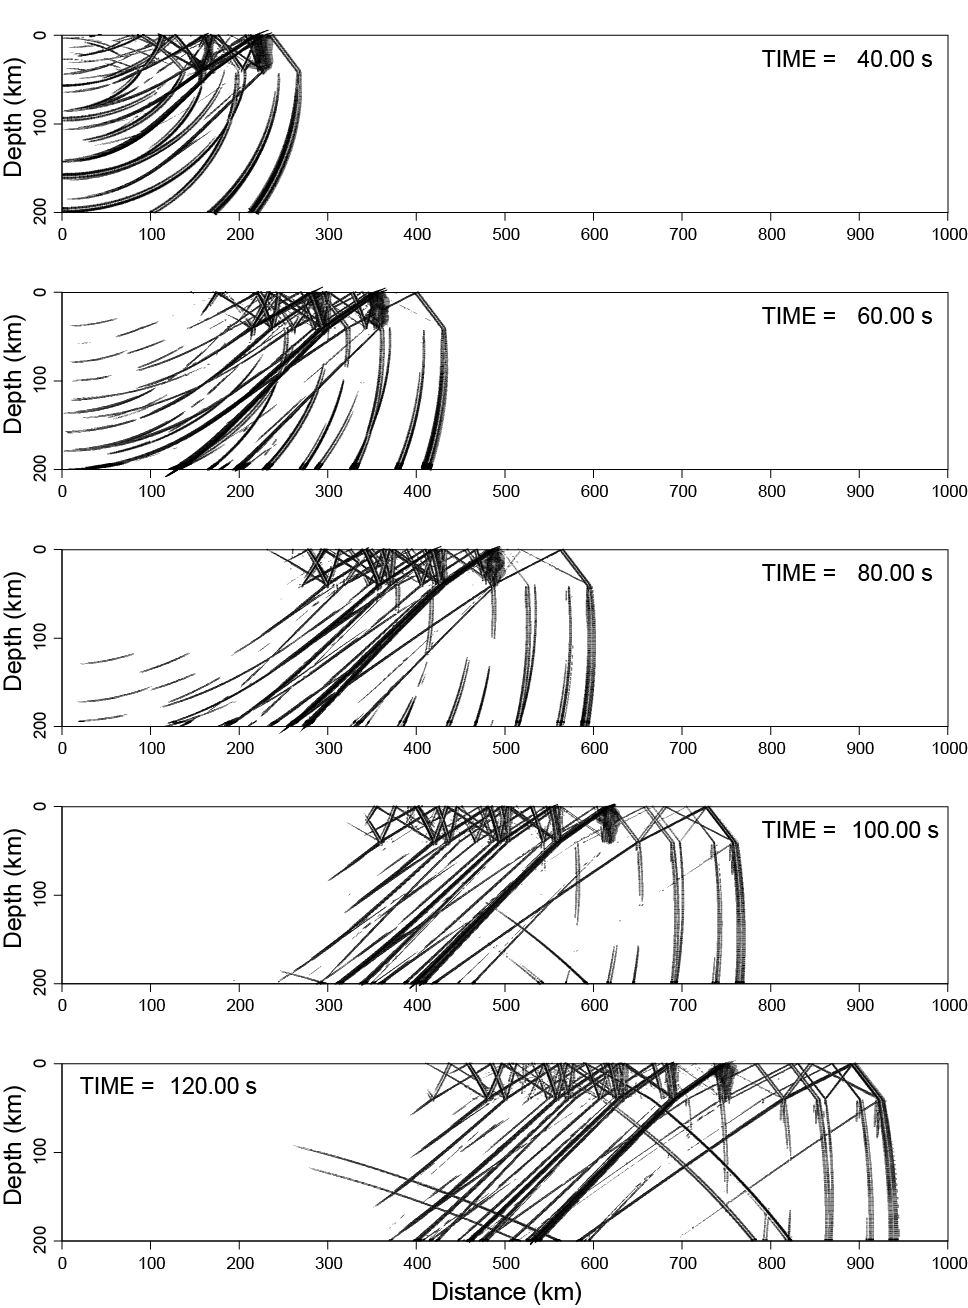
Figure S4. Snapshots of Pn waves propagating in velocity model (Gradient-0.002) with 2 × 10⁻³ s−1 velocity gradient in the upper mantle.
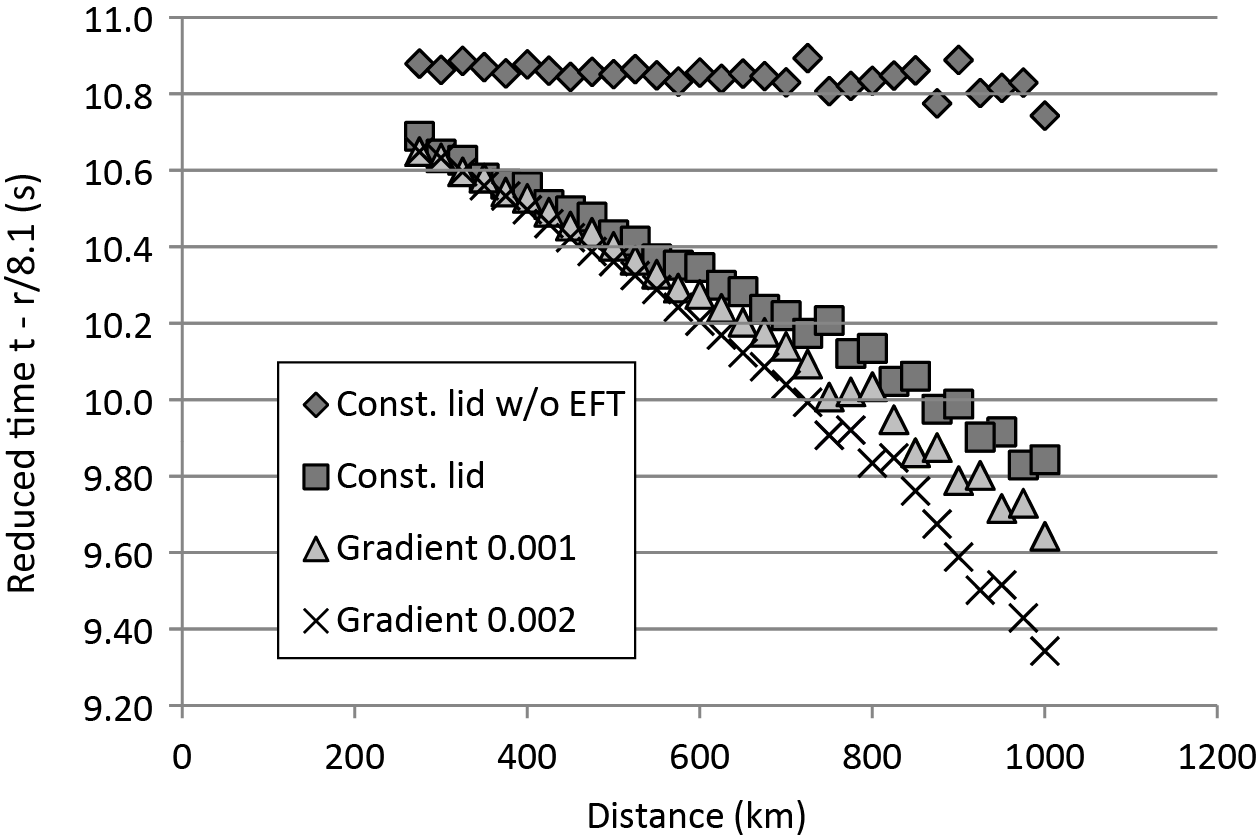
Figure S5. Arrival-time picks from profiles of Pn synthetics in Figure 4 of the main article displaying the weak curvature introduced by linear mantle lid gradients. Although the variations are subtle, given sufficient observations and laterally uniform structure, the mantle gradient can be constrained by Pn arrival-time picks, providing velocity models that can be used for self-consistent regional amplitude spreading calculations.
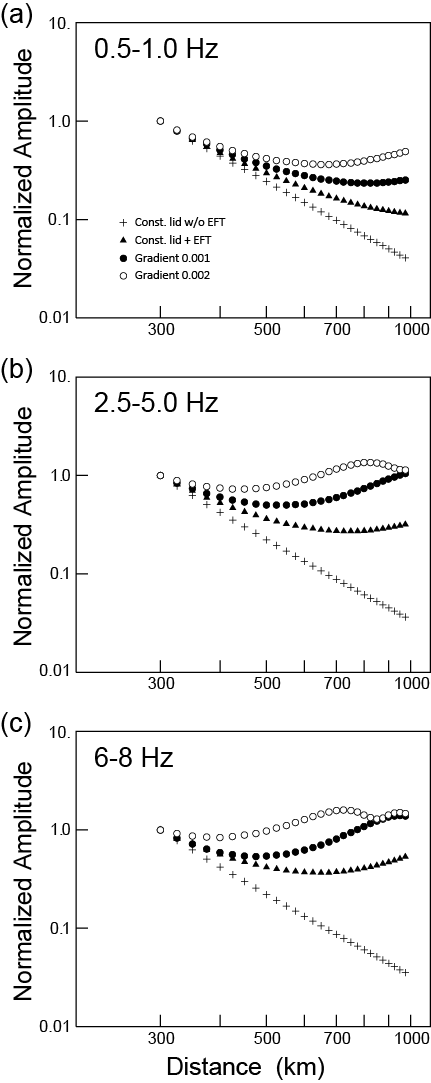
Figure S6. Pn amplitude versus distance on log–log scale for different models, for narrowband-filtered signals with central frequencies and passbands of (a) 0.75 Hz (0.5–1.0 Hz), (b) 3.75 Hz (2.5–5.0 Hz), and (c) 7.0 Hz (6.0–8.0 Hz).
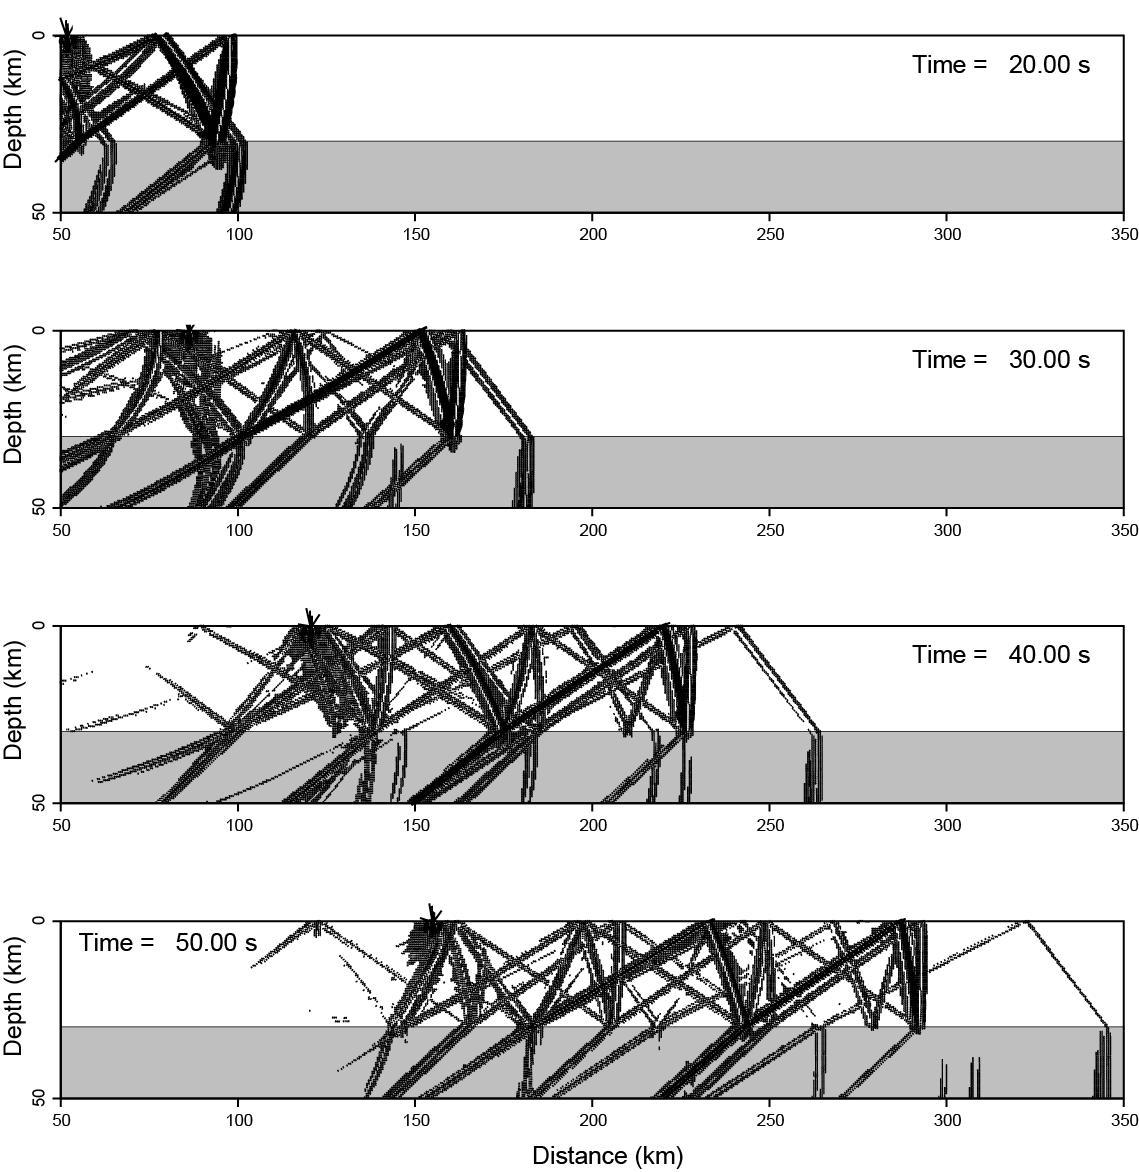
Figure S7. Wavefield snapshots of Pn waves propagating in the entrance section (50–350 km) of the 1D model with a uniform 30-km-thick crust.
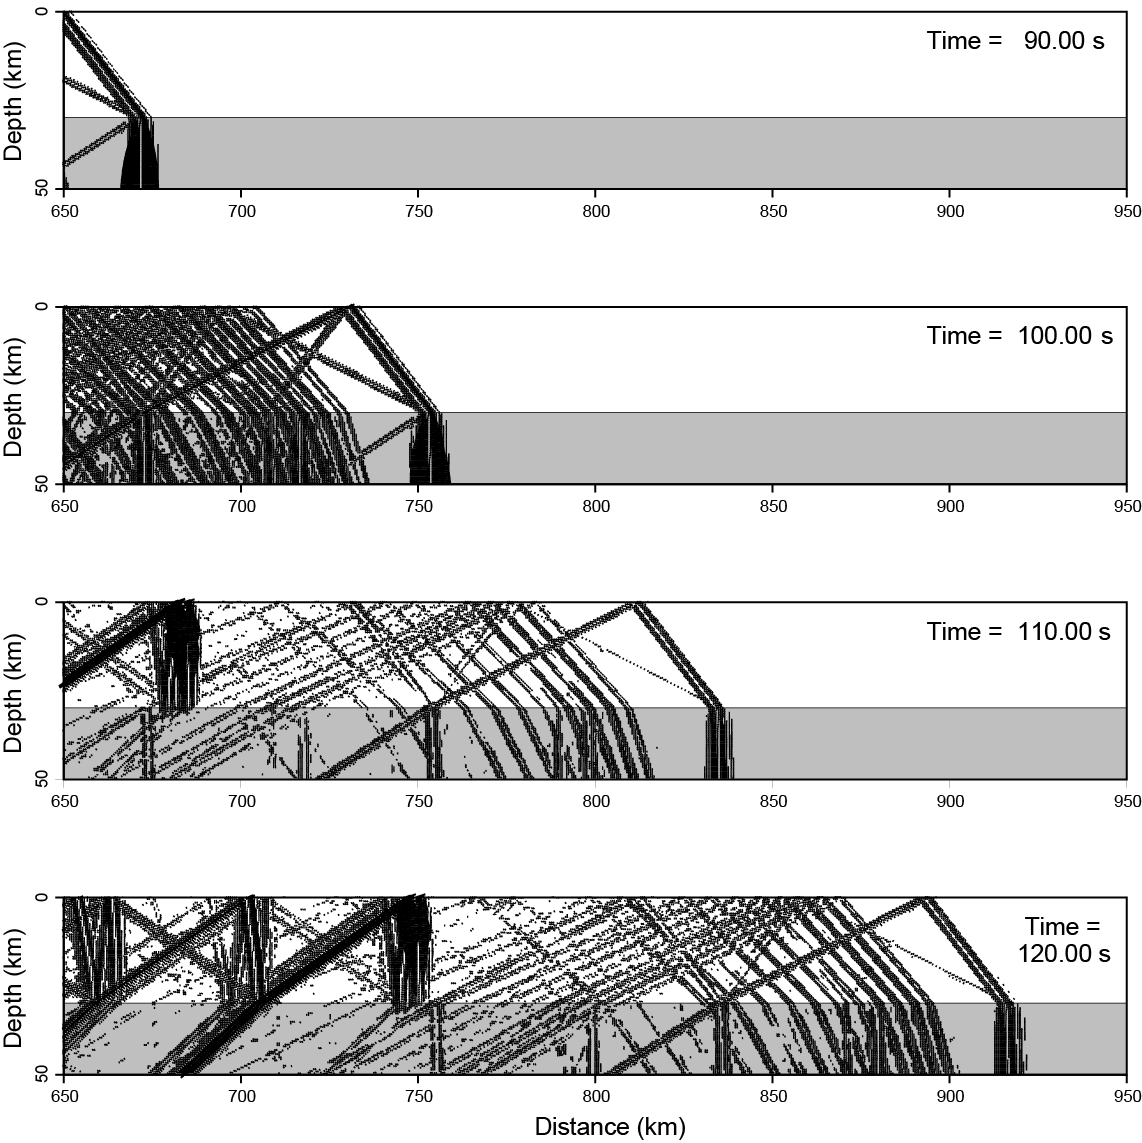
Figure S8. Wavefield snapshots of Pn waves propagating in the exit section (650–950 km) of the uniform 30-km-thick crust model.
[ Back ]