This electronic supplement contains figures showing frequency content of detections.
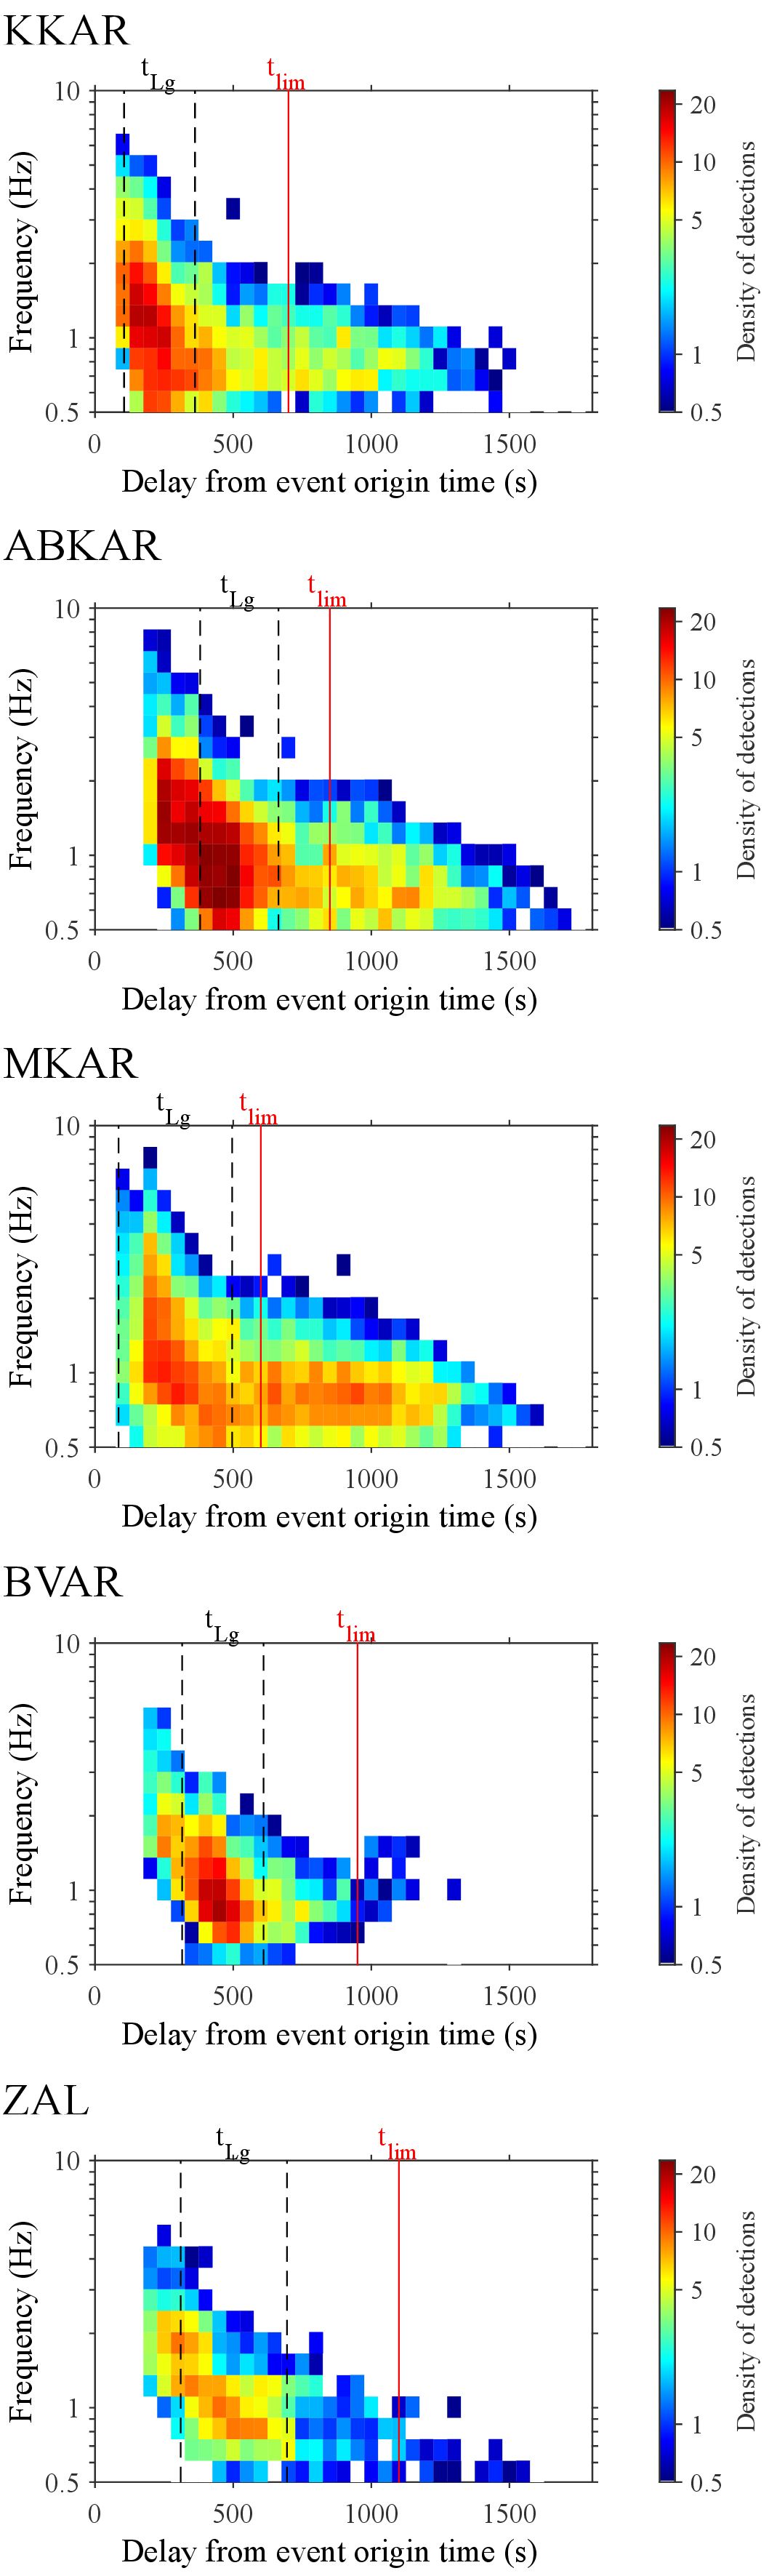
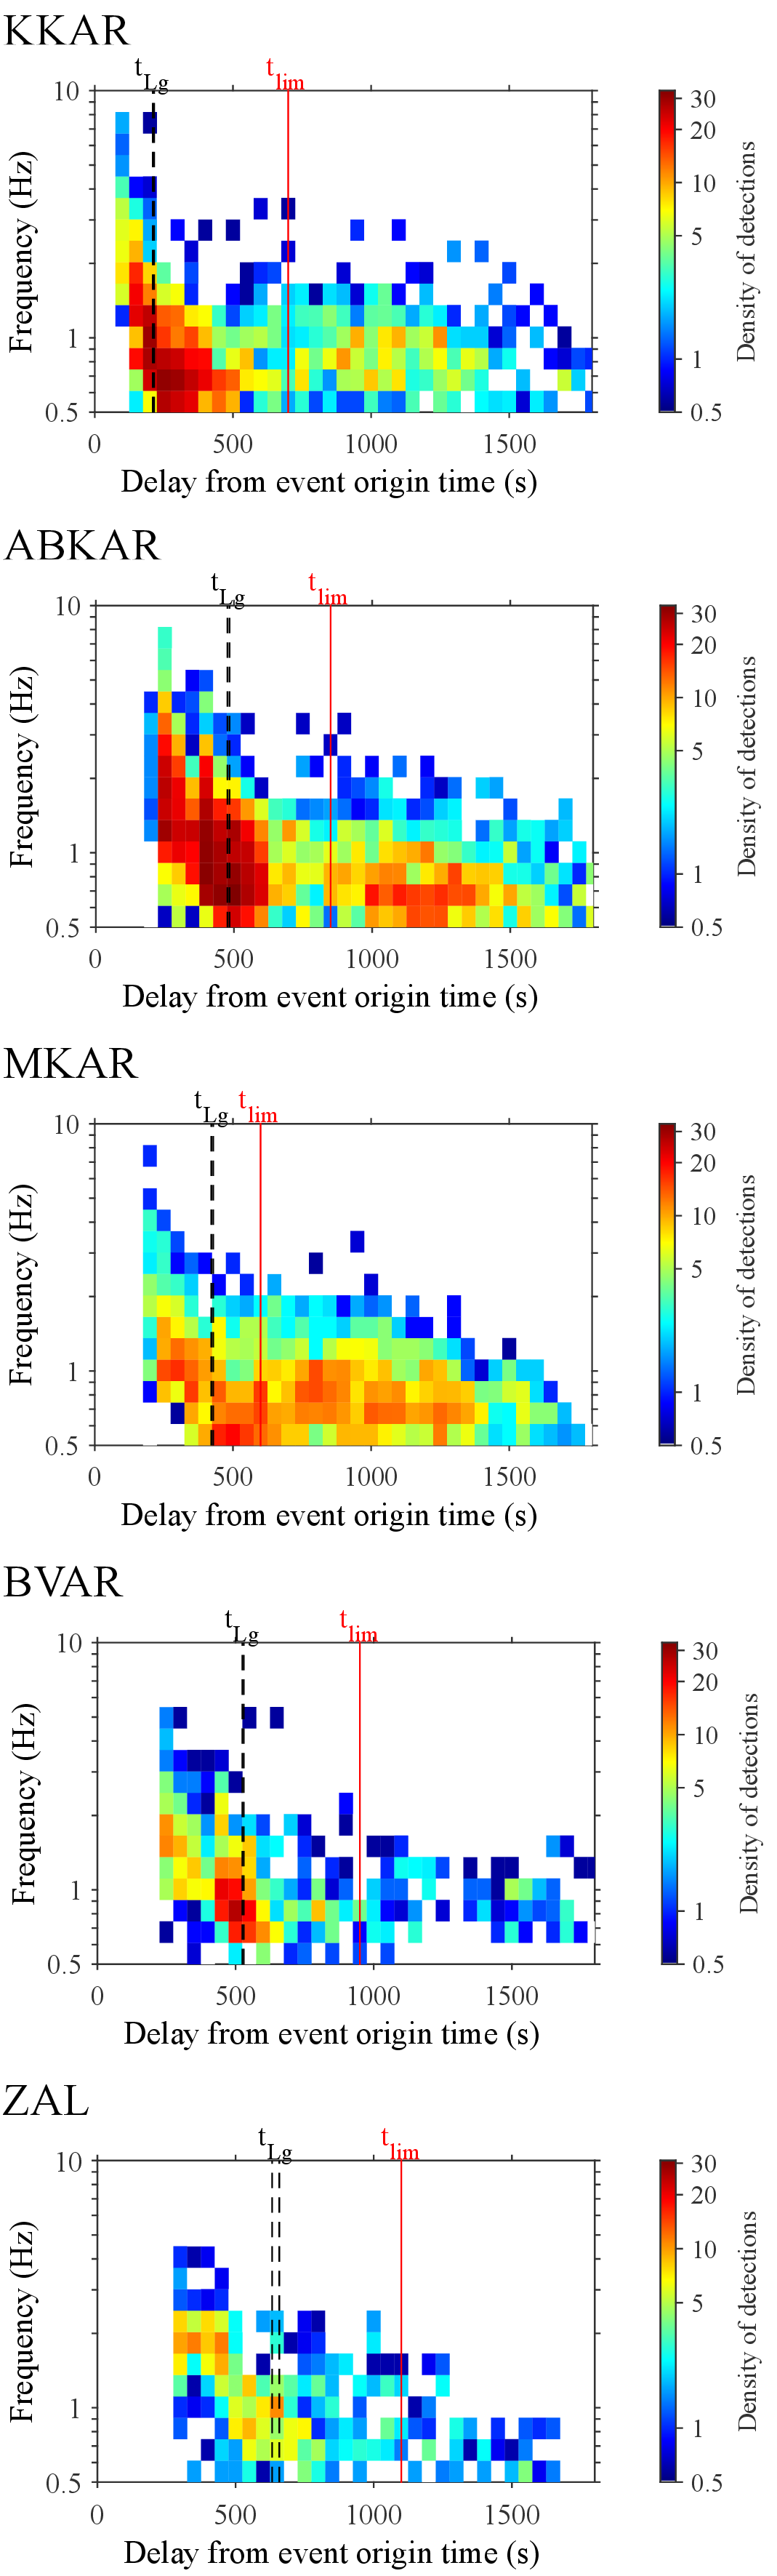
To illustrate the frequency content of the detections mentioned in the main article, Figures S1 and S2 show the density of detections for each array as a function of time and frequency for the crustal events (Fig. S1) and for the intermediate events (Fig. S2).
Figure S1. Density of detections for the crustal events observed by each of the five arrays as a function of time and frequency. The density of detections is defined as the number of progressive multi-channel correlation (PMCC) detections in a time-frequency cell of 50 s length and one frequency bandwidth length divided by the number of available events. The vertical dashed black lines mark the range of theoretical Lg arrivals for all used events. The red vertical line marks the time tlim delimiting the end of the early coda regime and the beginning of the late coda regime.
Figure S2. Density of detections for the intermediate events observed by each of the five arrays as a function of time and frequency. The density of detections is defined as the number of PMCC detections in a time-frequency cell of 50 s length and one frequency bandwidth length divided by the number of available events. The vertical dashed black lines mark the range of theoretical Lg arrivals for all used events. The red vertical line marks the time tlim delimiting the end of the early coda regime and the beginning of the late coda regime.
[ Back ]