This electronic supplement contains figures of waveform comparison and static coulomb stress changes. Using the synthetic waveforms in the perpendicular-strike test (Fig. S1), we can estimate the spatial resolution along the direction perpendicular to the strike by backprojecting these waveforms to the source region (Fig. S2). Using the finite-fault modeling, the waveforms synthesized from slip models 1 and 2 basically fit the observations equally well, as shown in Figures S3 and S4, respectively.
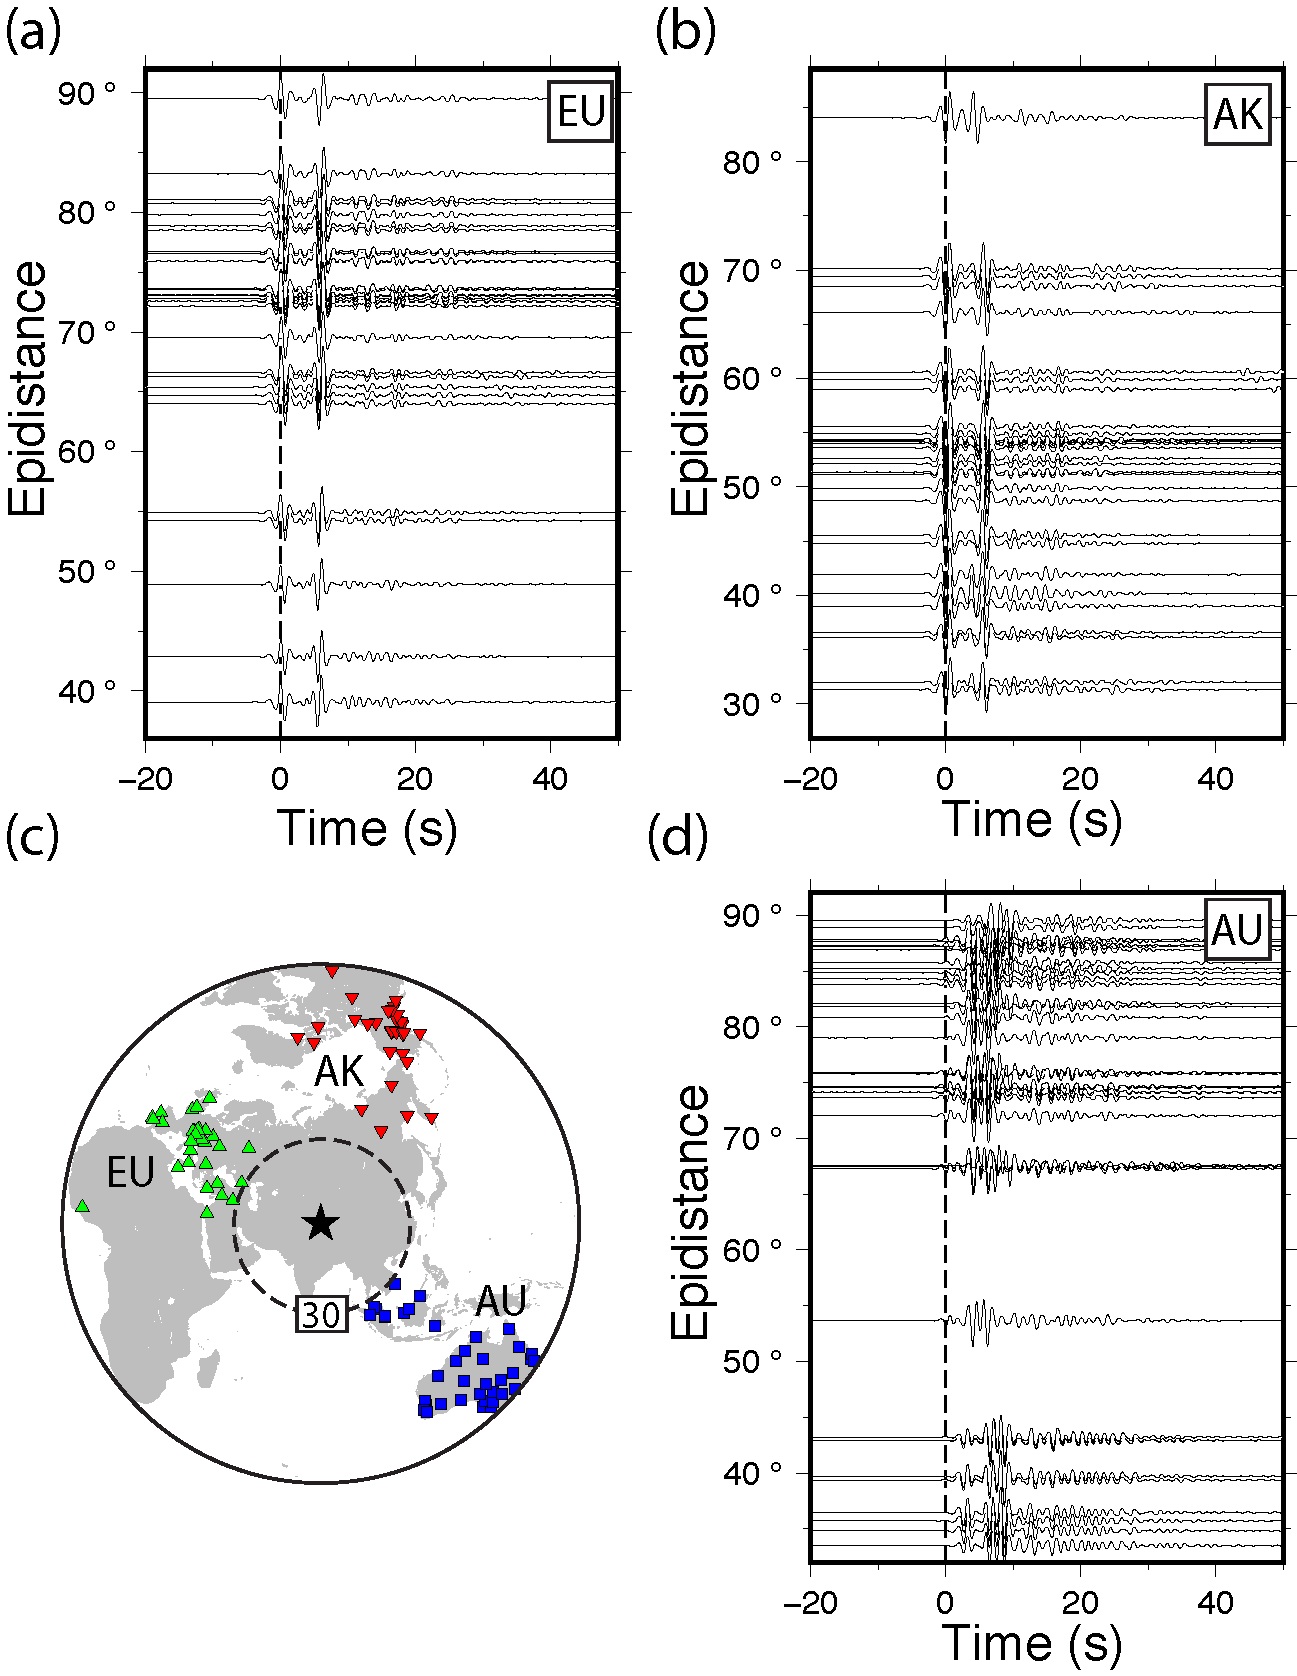
Figure S1. Synthetic direct P wavetrains calculated for the perpendicular-strike test at the (a) European (EU), (b) Alaska (AK), and (d) Australian (AU) arrays. (c) Station distribution of the arrays EU (triangles), AK (inverse triangles), and AU (squares).
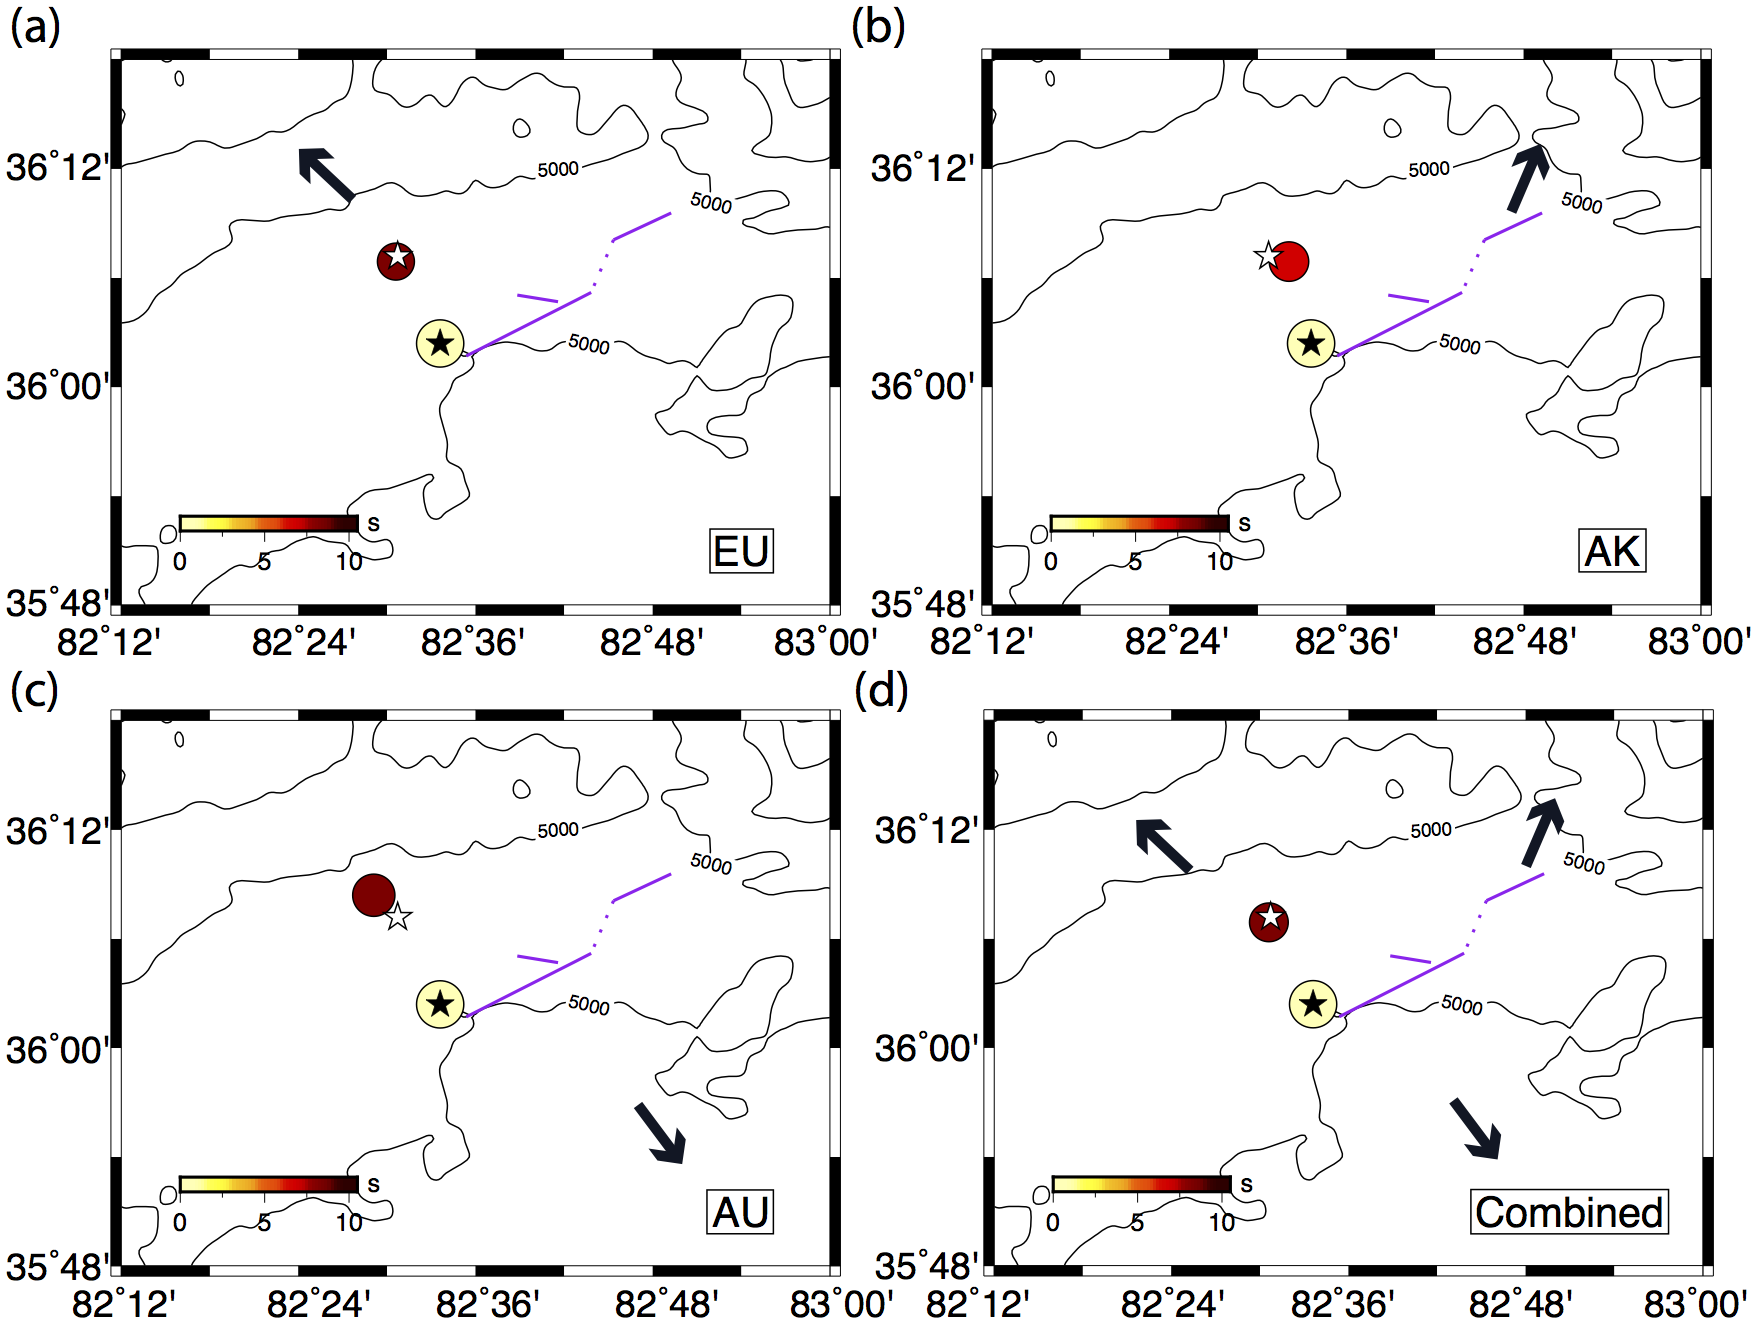
Figure S2. The backprojection imaging results for the perpendicular-strike test for the arrays (a) EU, (b) AK, and (c) AU, and (d) their combination. The circles represent the subevents with areas proportional to the powers and colors depicting the rupture times. The black star indicates the first source at the epicenter, and the white star indicates the second source 10 km northwest of the epicenter. The arrows point to the azimuthal directions of the three arrays.
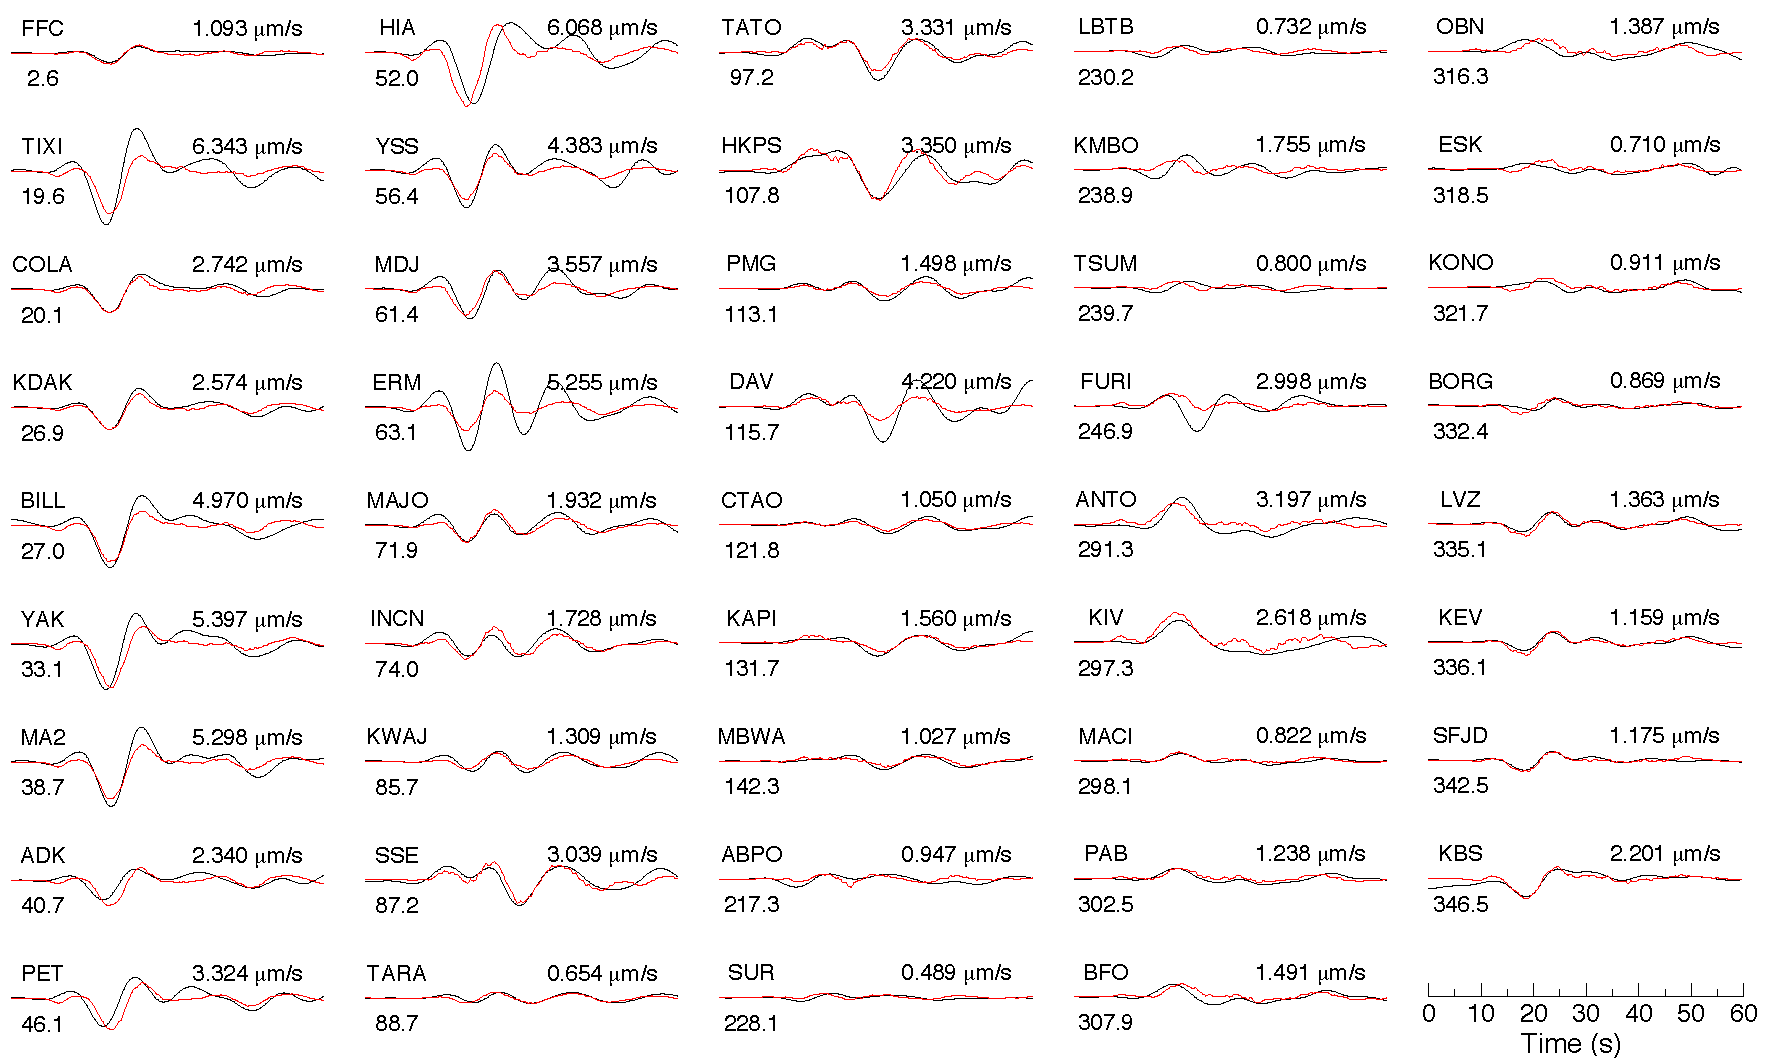
Figure S3. Comparison of the observed P waves (black curved lines) and those (red curved lines) synthesized from the slip model 1. All the waveforms are scaled relative to the maximum amplitude of these waveforms.
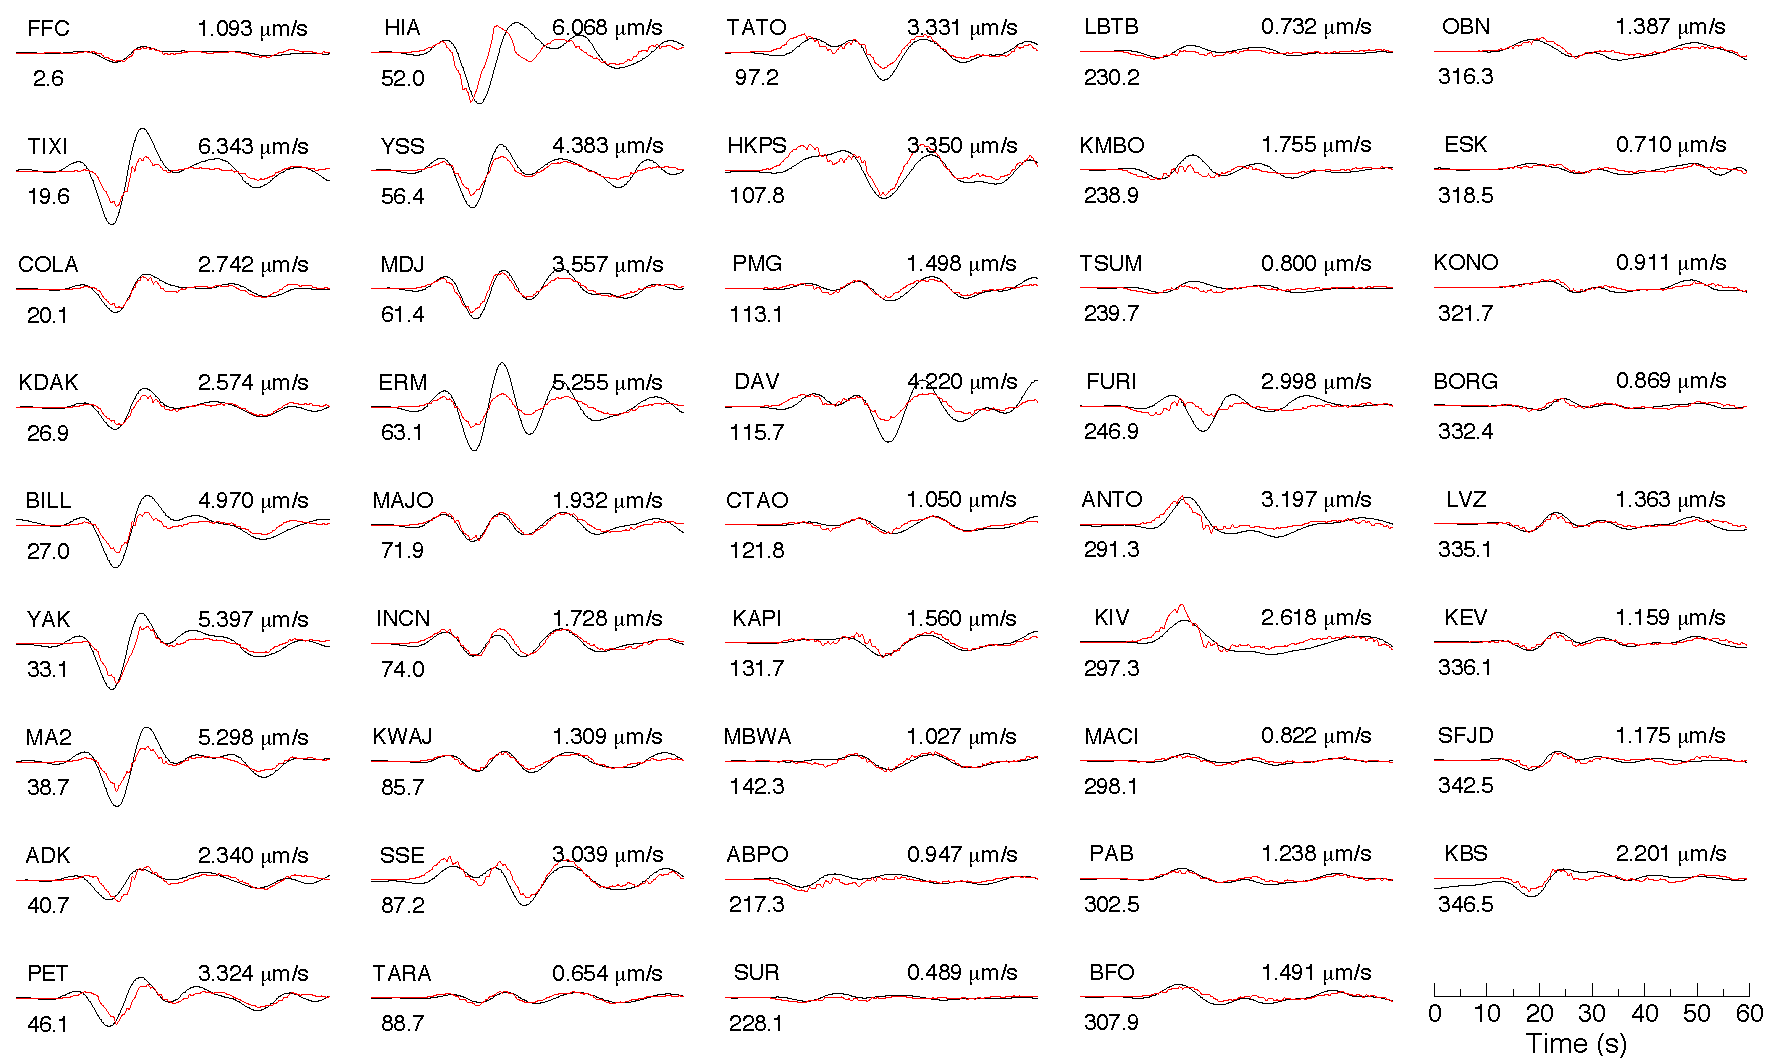
Figure S4. Comparison of the observed P waves (black curved lines) and those (red curved lines) synthesized from the slip model 2. All the waveforms are scaled relative to the maximum amplitude of these waveforms.
[ Back ]