This electronic supplement contains movies of simulated wave propagation, figures of surface-to-downhole standard spectral ratio (SSR), group delay duration lengthening (GDDL), earthquake horizontal-to-vertical ratio (EHVR), and synthetic waveforms.
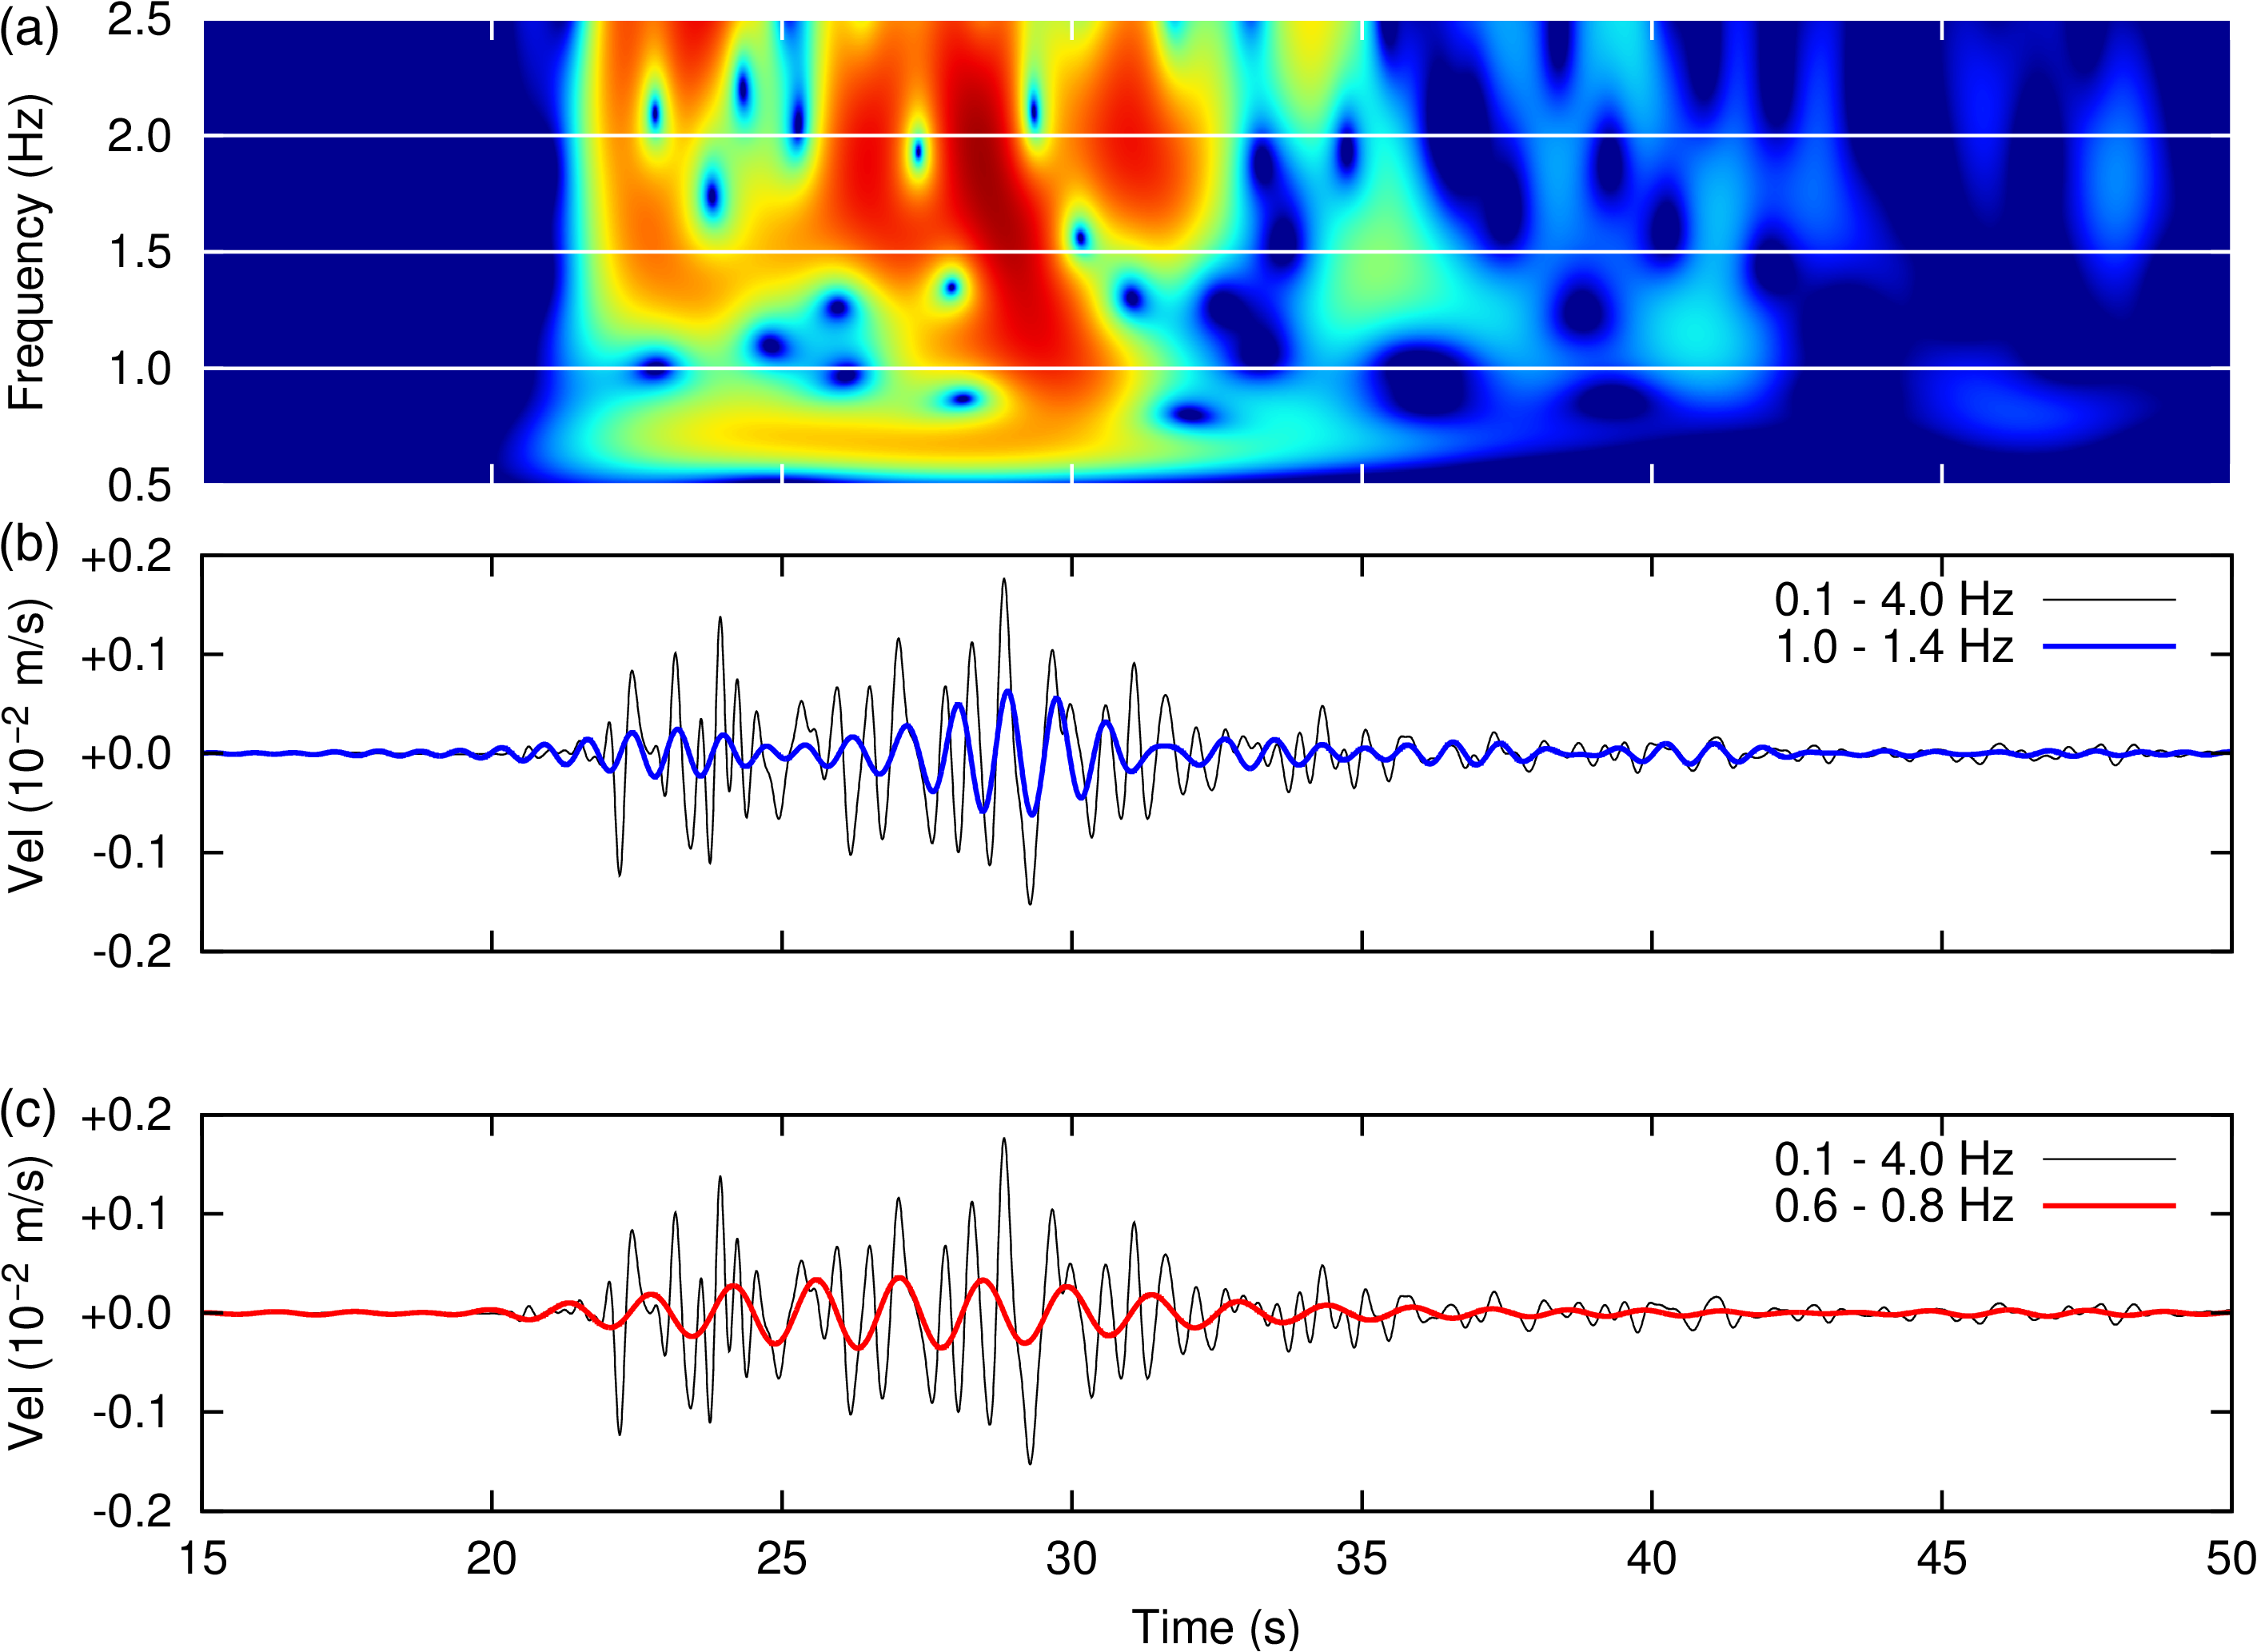
In Figure S1, we show the time–frequency distribution of the east–west (EW) component of ground velocity recorded at the TST surface station for a local ML 4 event that occurred on 9 October 2005 at 07:12 (see Table 1 in the main article for details). Looking at the time series in different frequency bands suggests that late arrivals, consisting most probably of local surface waves, are responsible for the maximal duration lengthening. This trend is more clearly seen on synthetic seismograms (see Figs. S2 and S3), and on average, by considering the full set of 12 events (see Fig. 2 in the main article).
We performed 19 direct simulations of the response of the Mygdonian basin to point-like double-couple sources corresponding to local events recorded by the Euroseistest accelerometric array. The analysis of the full set of results and their comparison to observations are presented in Maufroy et al. (2016).
Here we present two movies showing the time evolution of horizontal ground motion computed for two of those local events: event E1—labeled S2 in Maufroy et al. (2016)—corresponds to an ML 3.59 event that occurred on 17 August 2006, about 20 km south–southeast from TST, and event E2—labeled S3 in Maufroy et al. (2016)—to an ML 4.4 event that occurred on 12 September 2005, about 13 km northeast of TST. The depth of the two events is 11 km for E1 and 10 km for E2.
For event E1, a P wave is emitted toward the center of the basin and hits the southern edge around 3 s. A first train of local Rayleigh surface waves diffracted off the southern (resp. northern) edge can be seen from 4 s (resp. 5 s) on; they interfere with the direct S wave from 5 s on. Other local surface waves converted from the S wave can be seen, in particular those which progressively detach from the southern edge from about 7 s. Note the amplitude variations along the surface wavefronts caused by the irregular shape of the basin edge.
The same basic features can be seen for event E2 but because E2 is closer than E1 to the basin, the excitation of surface waves seems to be more symmetric than for the case of E1, and surface waves diffracted off both northern and southern edges can be seen from 7 s on and interfere in the center of the basin around 8 s.
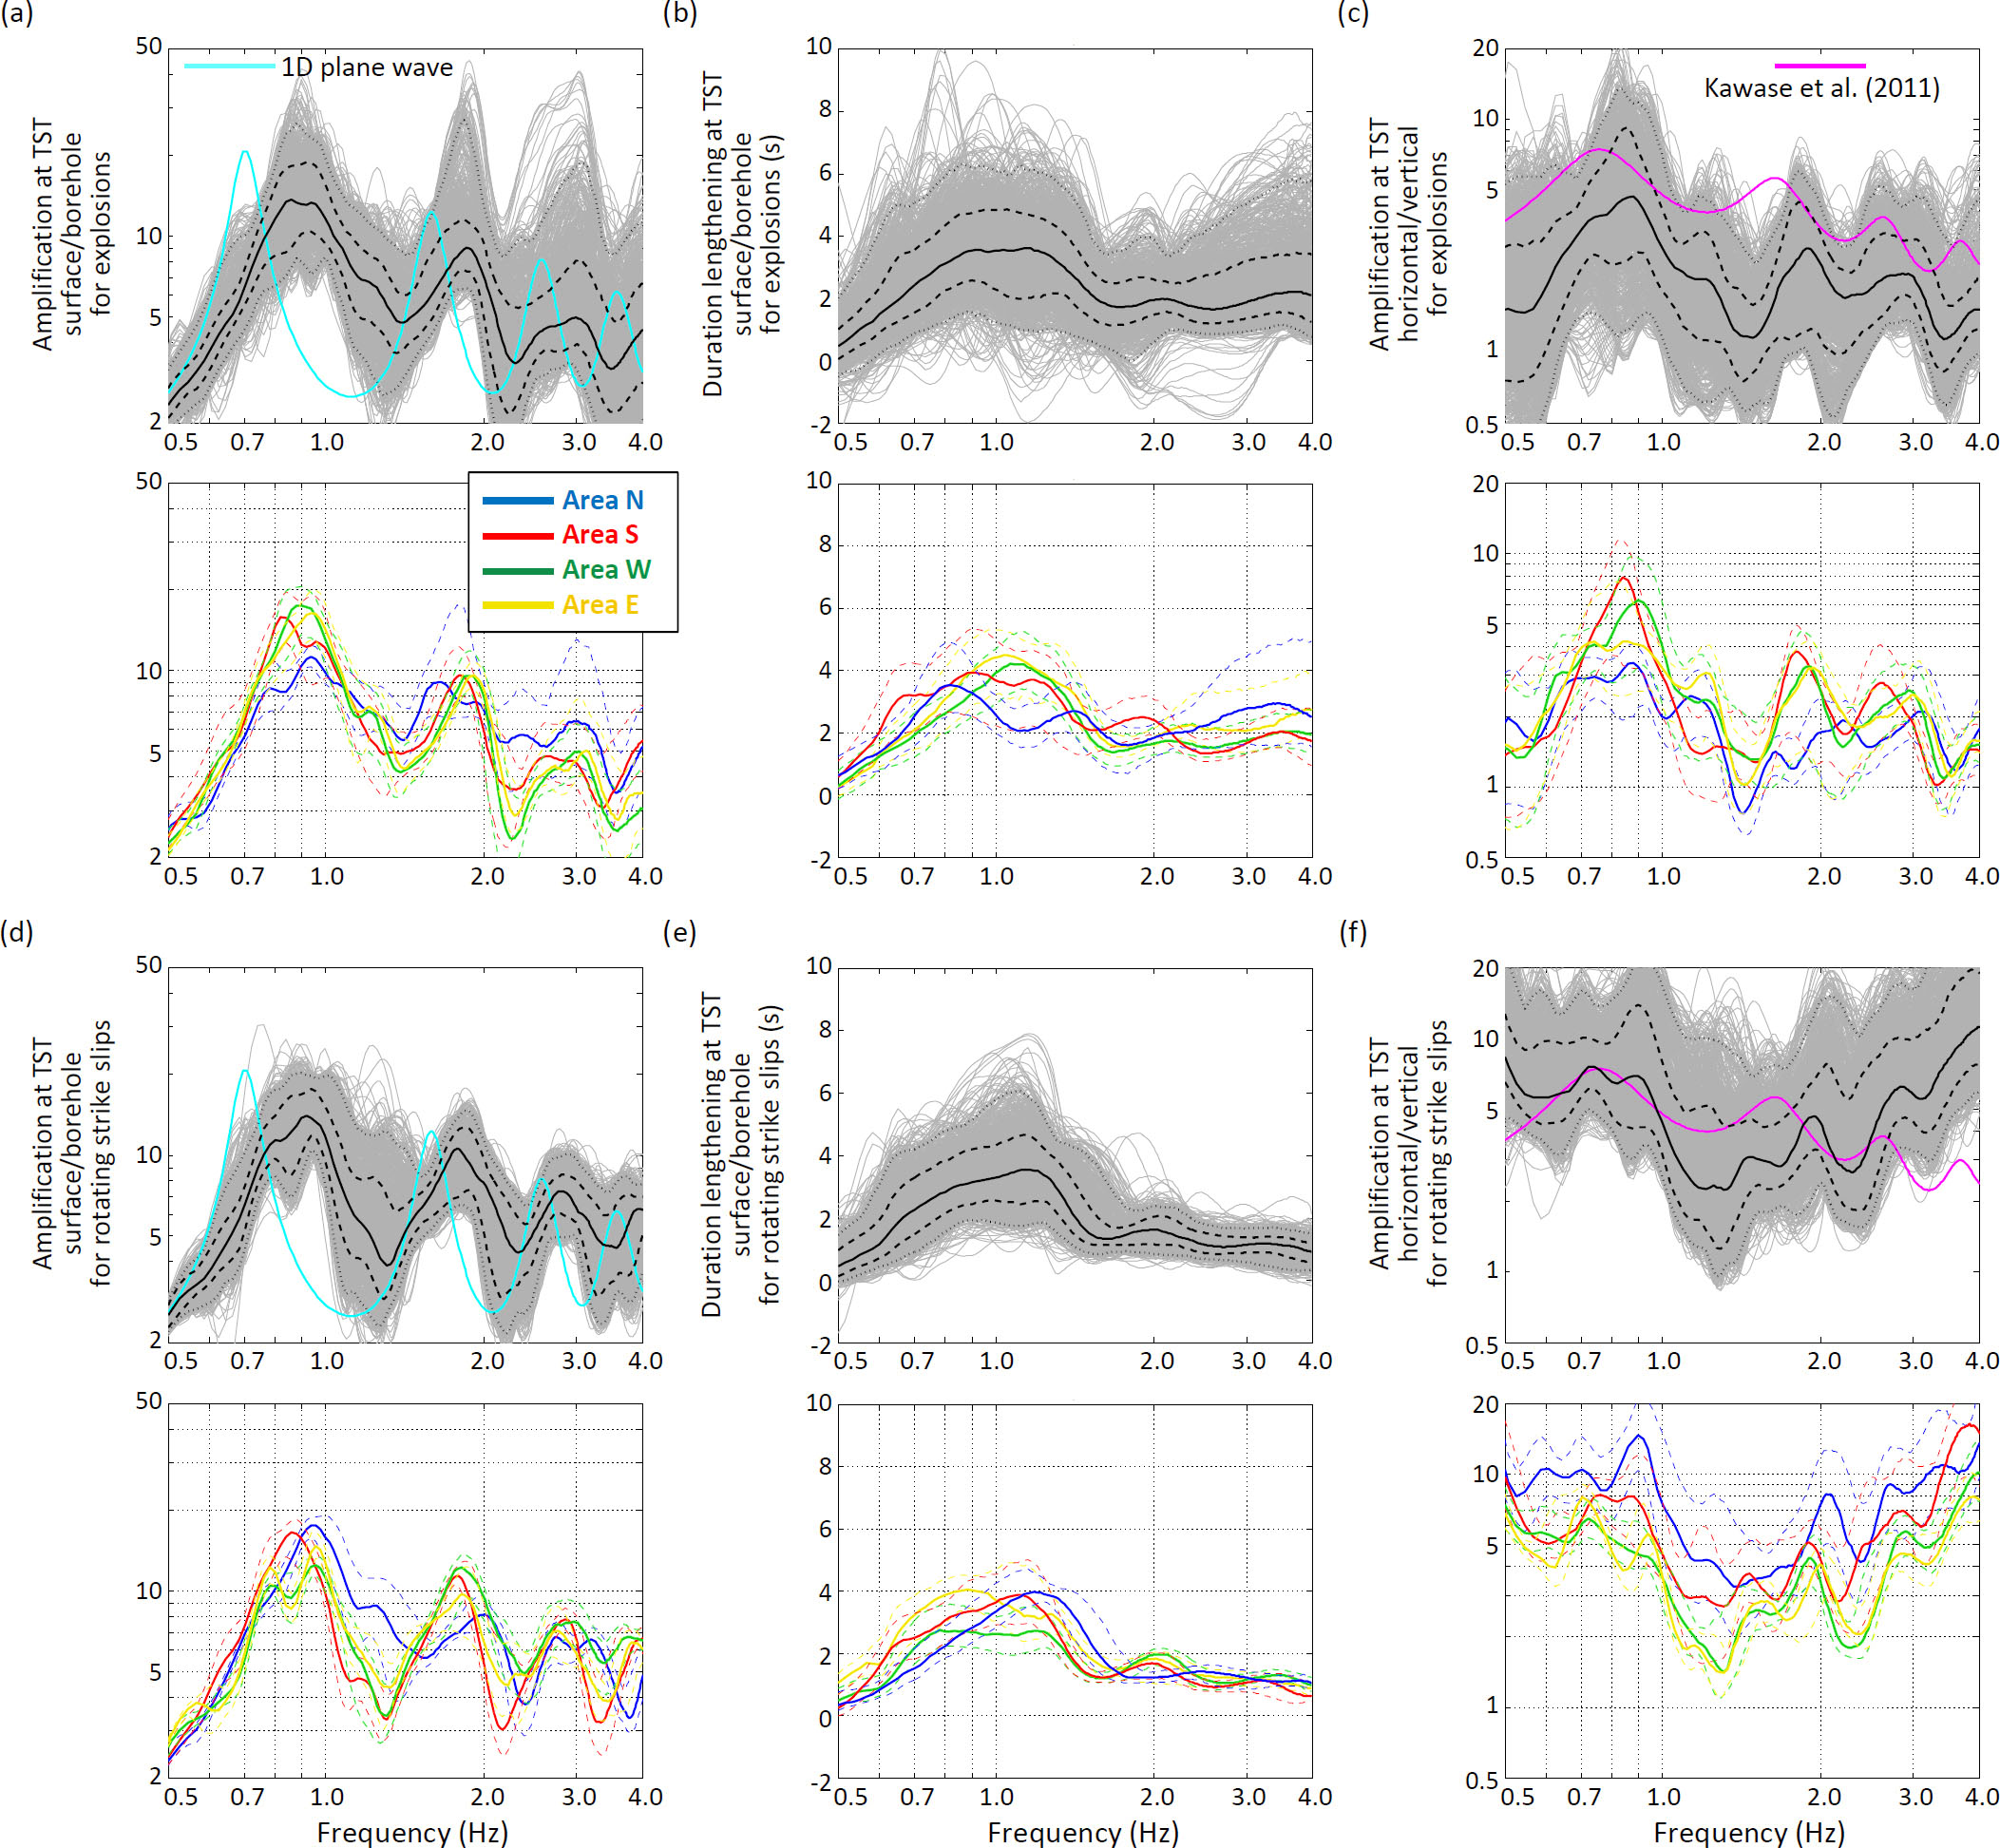
We use two canonical source catalogs to better understand how the composition of the wavefield affects the different site-effects indicators. The first catalog consists of explosive sources, the second of pure vertical strike-slip sources, the strike of which is defined to radiate SH waves with maximal amplitude toward TST. Given the overall 2D geometry of the basin around TST, the seismic wavefield radiated by the explosive sources (resp. vertical strike slip) from the northern and southern clusters is dominated by P–SV (resp. SH) body waves and Rayleigh (resp. Love) surface waves diffracted off the edges of the basin. Figure S2 shows the distributions of SSR, GDDL, and EHVR measured on the horizontal radial (resp. transverse) component for the explosive (resp. strike slip) sources.
The strike-slip northern sources cause the maximum amplification and lengthening of duration of the transverse horizontal component around 1.2 Hz (Fig. S2d, bottom), which we attribute to the efficient generation of Love waves at the northern basin edge (see also Fig. S3). Those diffracted Love waves are also excited by explosive sources from the eastern and western areas. Around 0.95 Hz, both Rayleigh waves (excited by northern and southern explosions) and Love waves (by northern strike-slip sources) contribute to the local maximum amplification. The eastern and western strike slips also contribute to the peak, probably through the excitation of Rayleigh waves, and because they also excite the main body-wave resonance around 0.8 Hz, their SSRs show a typical double peak, which is reported in the article for eastern sources of the RR catalog.
Both the overall shape of EHVR as a function of frequency and the level of EHVR strongly vary (the latter by a factor between 2 and 5) following the type of excitation (Fig. S2c,f, top). Although difficult to relate to the composition of the wavefield, we also observe a strong north–south (NS) asymmetry of the values of EHVR, and almost no EW asymmetry (Fig. S2c,f, bottom). The sign of the NS asymmetry of EHVR depends on the type of excitation itself, which suggests that the prediction of such asymmetry for realistic wavefield is not an easy task.
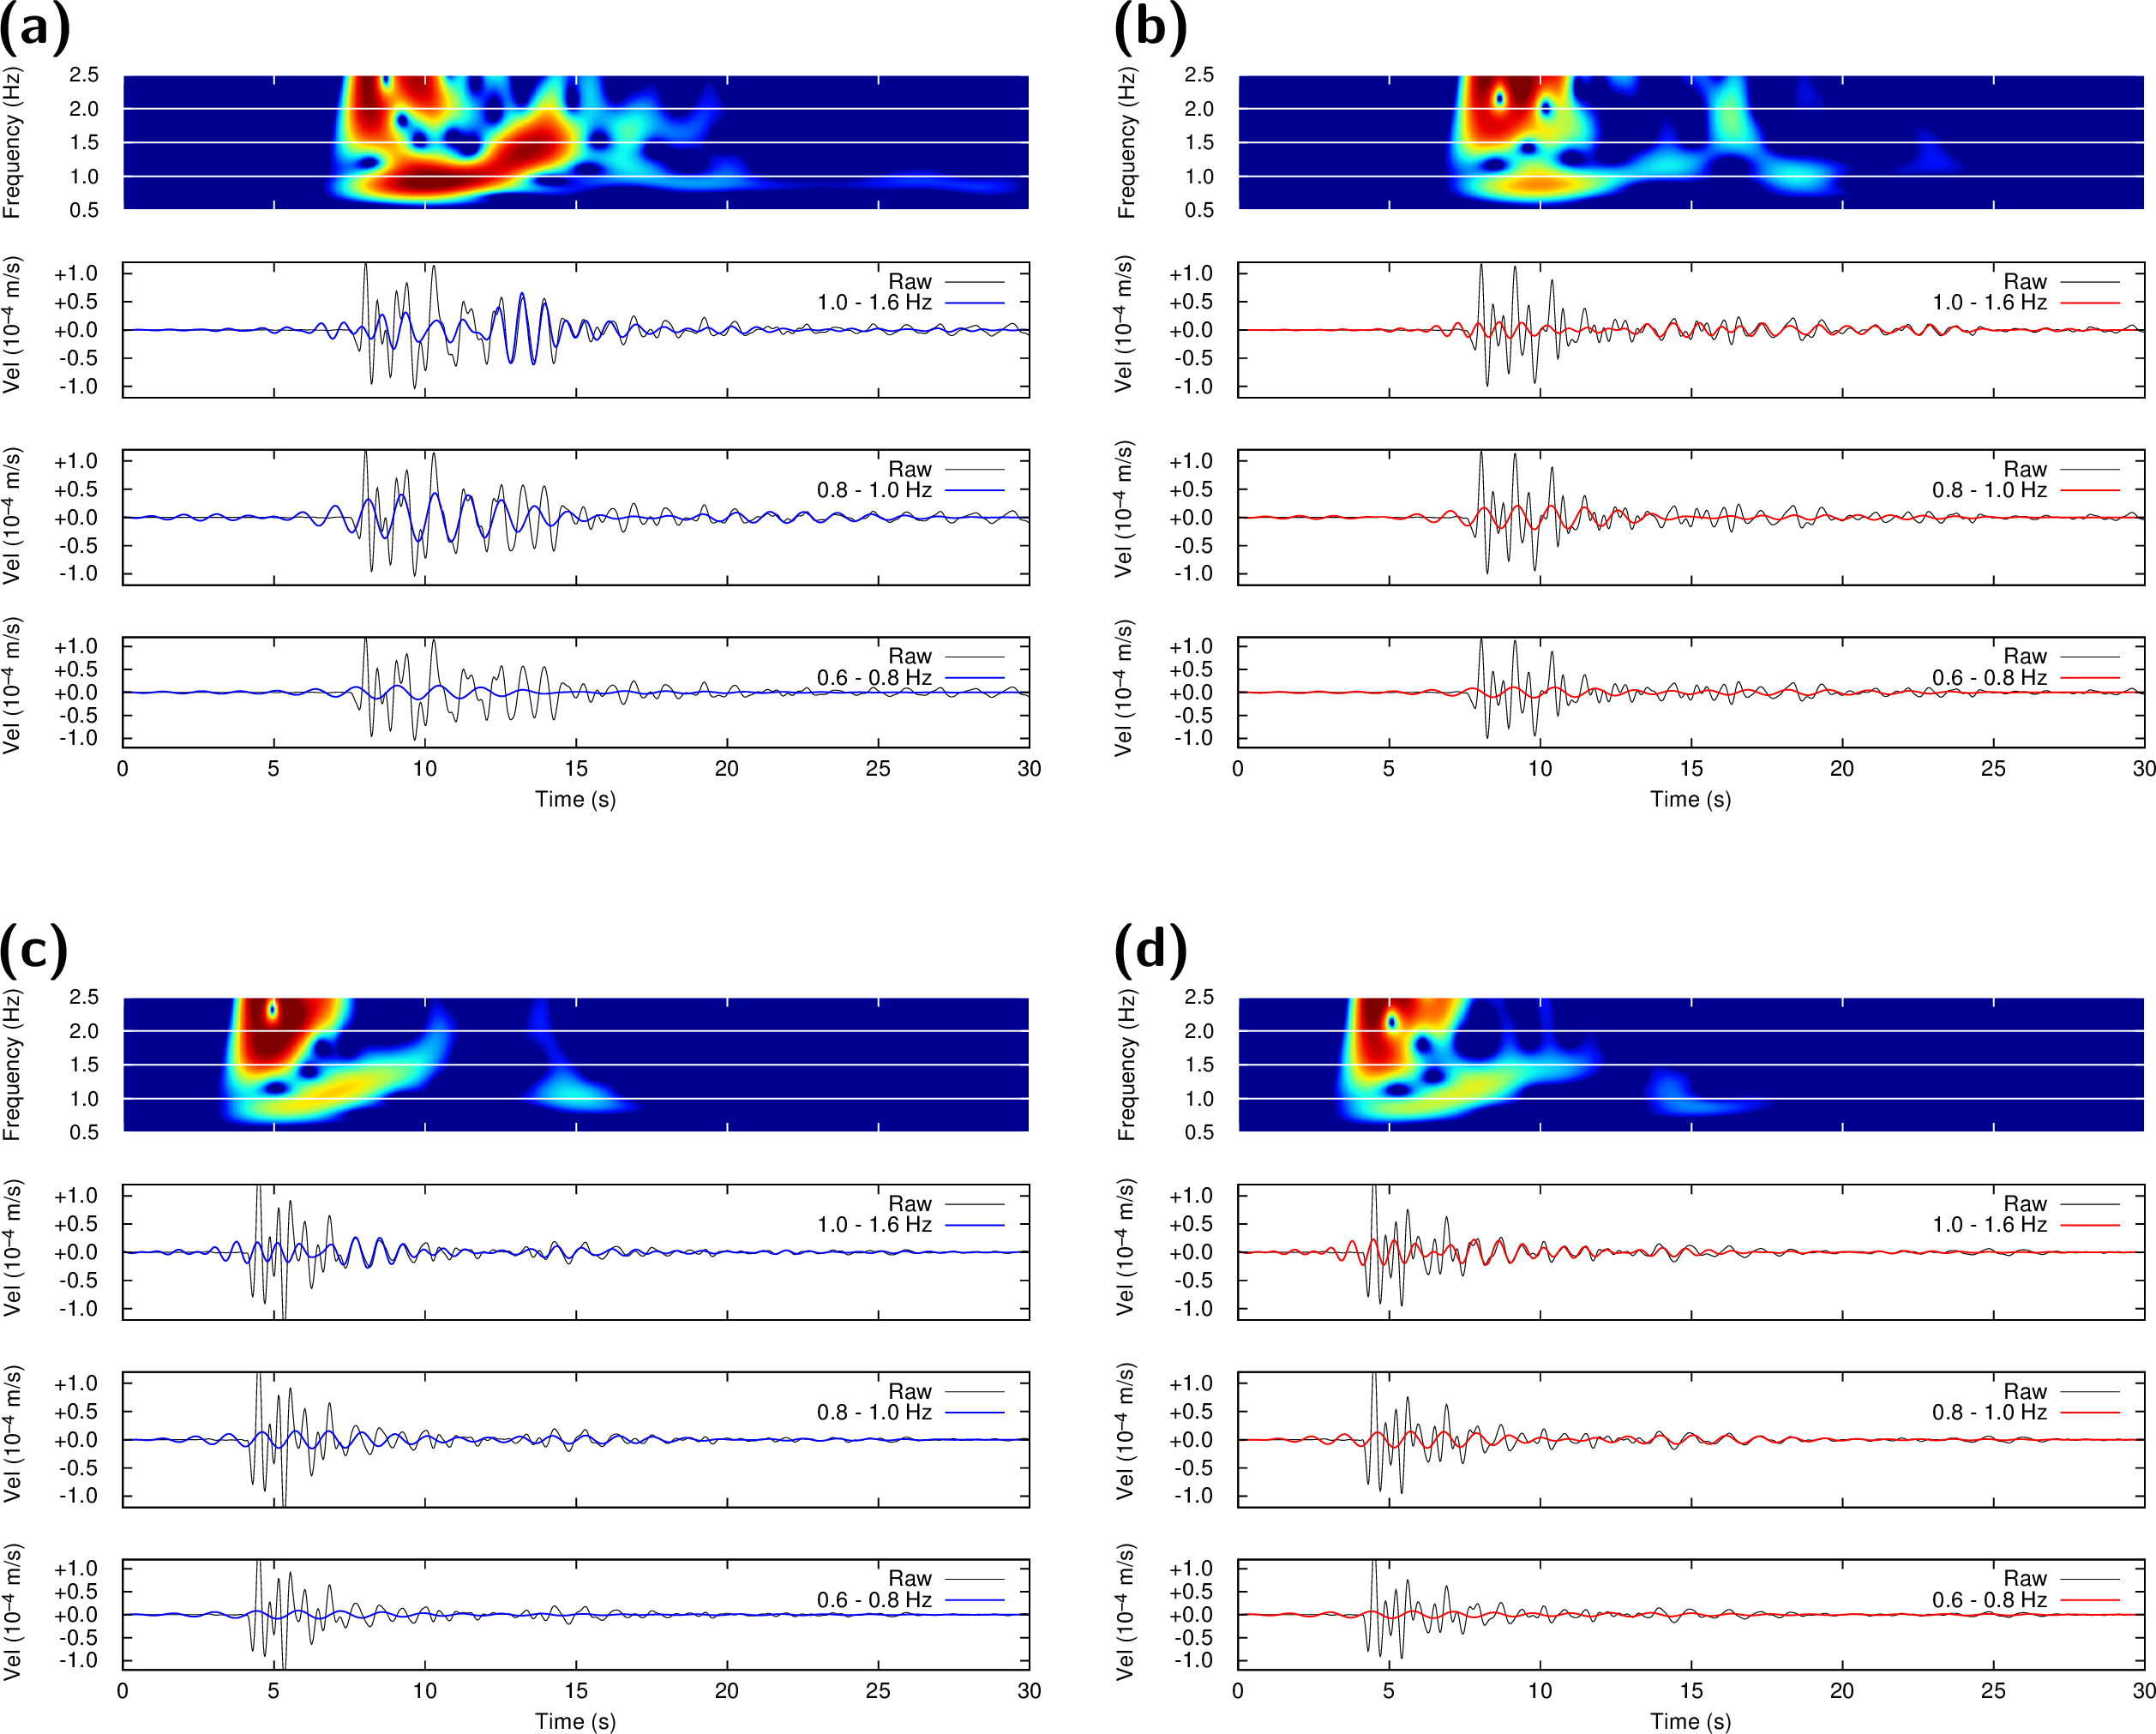
We illustrate the NS asymmetry of the seismic wavefield diffracted by the basin in Figure S3. Two pairs of sources from the SS catalog are considered: one couple located to the north of the central TST station (with back azimuth baz = 0°), the other one located to the south (baz = 180°). Each couple is composed of one source in the deep close cluster (located at 10 km depth and 5 km epicentral distance), and one in the shallow far cluster (located at 2.5 km depth and 20 km epicentral distance). Comparing the time–frequency distributions of the ground velocities at TST helps us understand how the surface waves diffracted by the northern basin edge contribute to the amplification for northern sources and to the lengthening of duration for both northern and southern sources. The asymmetry is clearly seen for shallow, far sources but disappears for deep, close sources.
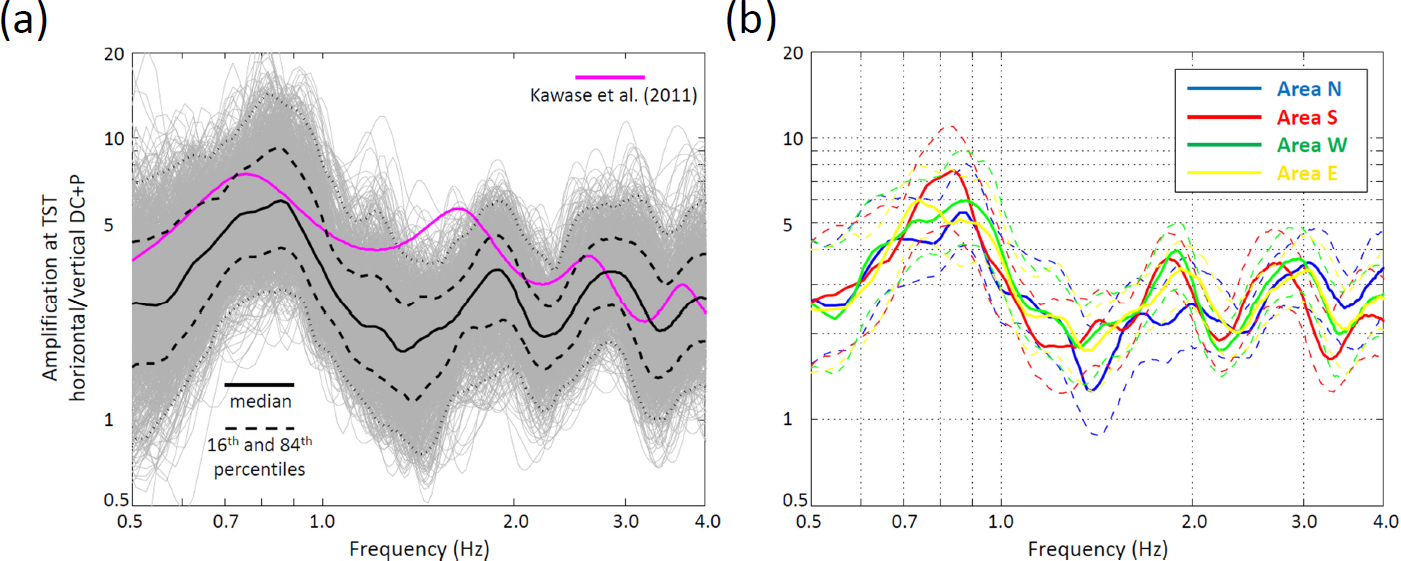
Following Kawase et al. (2011), we compute EHVR for a catalog of double-couple sources that are tuned so as to radiate a seismic wavefield with an S/P energy ratio equal to 5, which is the ratio obtained for body-wave equipartition at the free surface of a Poisson solid. The EHVR results are shown in Figure S4 and analyzed in the main article.
Figure S1. EW component of ground velocity recorded at the TST surface station for a local ML 4 event that occurred on 9 October 2005 at 07:12 (see Table 1 in the main article for details). (a) A spectrogram of the ground velocity for frequencies between 0.5 and 2.5 Hz; (b) and (c) the corresponding time series filtered: below 4 Hz (black lines), around 0.7 Hz (red line) at which the median amplification is maximal (see Fig. 2a in the main article), and around 1.2 Hz (blue line) at which the median amplification is minimal, and the lengthening of duration is close to maximal (see Fig. 2c in the main article). The overall group delay around 1.2 Hz is influenced by late arrivals, consisting probably of local surface waves, and therefore appears to be larger (of a few seconds) than around 0.7 Hz.
Figure S2. (a,d) Surface to downhole SSR, (b,e) GDDL between TST and TST_196, and (c,f) EHVR computed for (a–c) explosive and (d–f) vertical strike-slip sources. The top figure in each panel displays the site response indicator (SSR, GDDL, and EHVR) for the whole catalog of sources (thin lines correspond to individual events and the solid black line to their median value; dashed black lines correspond to the 16th and 84th percentiles of the distribution). The bottom figure in each panel represents the median values (solid lines, surrounded by dashed lines of the same color for the 16th and 84th percentiles) obtained for sources in different back-azimuth areas. The cyan bold line in the SSR corresponds to the 1D vertical transfer function at TST and the magenta bold line in the EHVR to the prediction of Kawase et al. (2011).
Figure S3. Transverse (EW) component of ground velocity at the TST central station computed for two couples of sources located either in the (a,b) shallow far cluster or the (c,d) deep close cluster. Within each couple, one source is located to the north (resp. south) of TST, and the resulting seismograms are represented in blue (resp. red) on the left (resp. right) panel. Within each subfigure, we show the time–frequency representation of the signal (top), the raw time series (black solid line), and the band-pass filtered traces (colored solid lines) in three frequency ranges: [0.6–0.8 Hz], [0.8–1.0 Hz], and [1.0–1.6 Hz]. The asymmetry of the basin’s response due to the azimuth of the source (summarized in Figs. S2d,e) is clearly seen in the filtered traces for the shallow far sources: higher amplitudes and durations are obtained for the northern sources compared to the southern sources in the two higher frequency bands [0.8–1.0 Hz] and [1.0–1.6 Hz] and for increasing arrival times. We believe this is caused by the efficiency of the excitation of local surface waves (here of Love type, given the focal mechanisms of the SS catalog) at the northern basin edge. The asymmetry disappears for the (c,d) deep close sources. The maximum duration seems to be systematically related to the higher frequency bands, consistently with the results shown in Figure S2.
Figure S4. EHVR measured on 3D synthetics at the central surface station TST. (a) The ratios obtained for a catalog in which each source is modified to radiate a wavefield with a fixed S/P energy ratio (gray), their median (solid black curve), and the 16th and 84th percentiles (black dashed lines). The magenta solid lines refers to the theoretical prediction of Kawase et al. (2011), which assumes an equipartition of energy between vertically propagating body waves. (b) The EHVR grouped by source clusters and a slight NS asymmetry of the peak value, around 0.8 Hz.
Movie S1 [h.264-encoded MPEG4 movie; ~78.1 MB]. The time evolution of horizontal ground motion (norm of the two horizontal components) caused by an ML 3.59 event located 11 km below the black dot. The simulation was performed with the EFISPEC software.
Movie S2 [h.264-encoded MPEG4 movie; ~59.7 MB]. The time evolution of horizontal ground motion (norm of the two horizontal components) caused by an ML 4.4 event located 10 km below the black dot. The simulation was performed with the EFISPEC software.
The synthetic data sets computed for the catalogs random regional (RR), explosion (EX), and strike slip (SS) are available upon request from the authors (E. M. and E. C.).
Kawase, H., F. J. Sanchez-Sesma, and S. Matsushima (2011). The optimal use of horizontal-to-vertical spectral ratios of earthquake motions for velocity inversions based on diffuse-field theory for plane waves, Bull. Seismol. Soc. Am. 101, 2001–2014.
Maufroy, E., E. Chaljub, F. Hollender, P.-Y. Bard, J. Kristek, P. Moczo, F. De Martin, N. Theodoulidis, M. Manakou, C. Guyonnet-Benaize, et al. (2016). 3D numerical simulation and ground motion prediction: Verification, validation and beyond—Lessons from the E2VP project, Soil Dynam. Earthq. Eng. 91, 53–71, doi: 10.1016/j.soildyn.2016.09.047.
[ Back ]