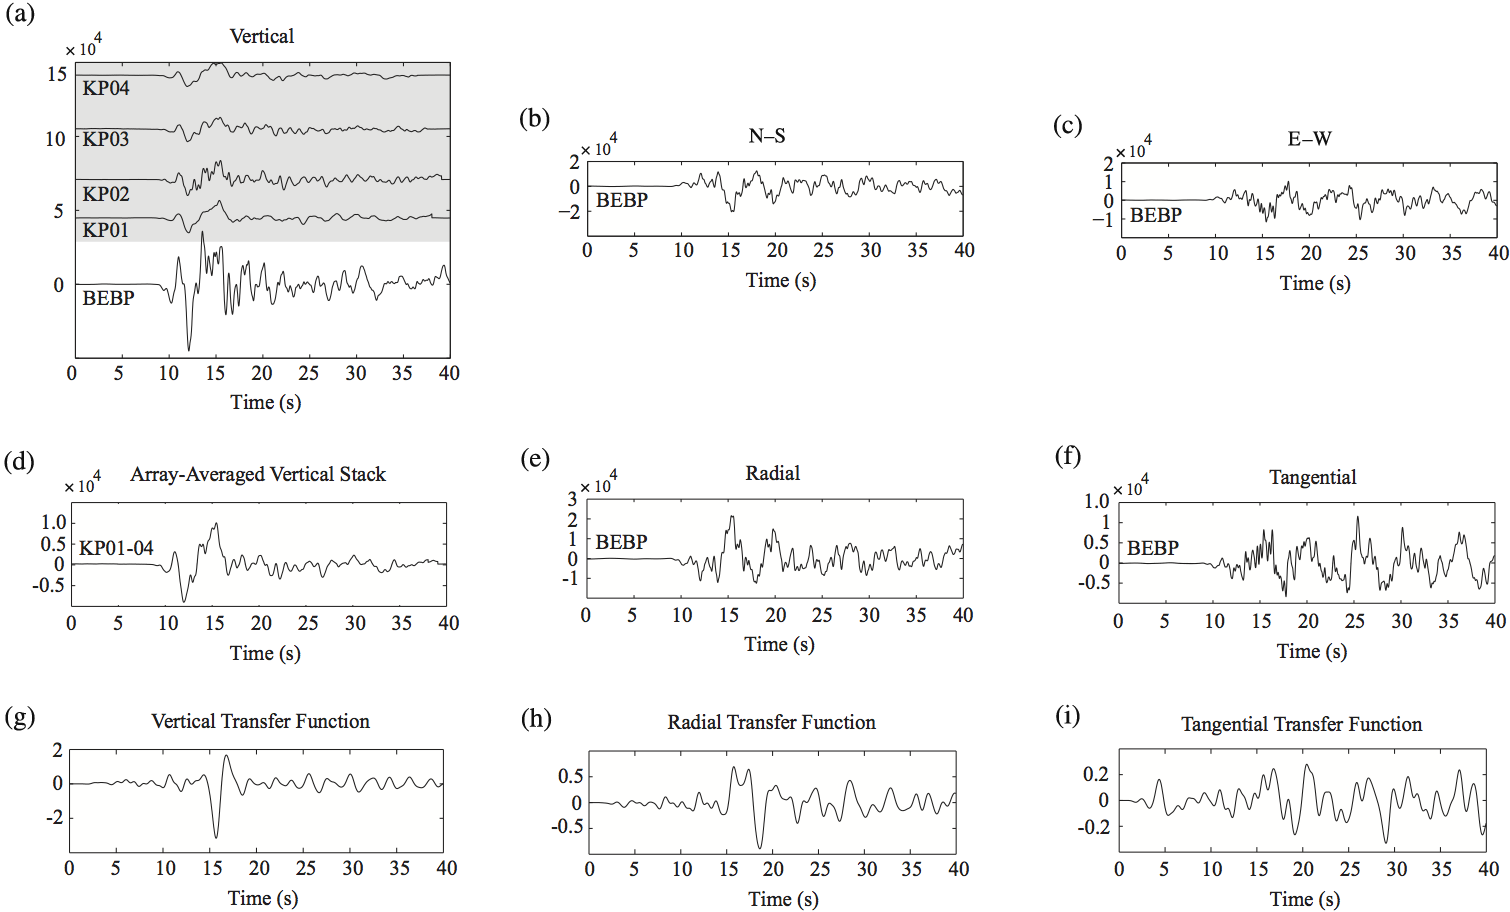
This electronic supplement contains a figure which is an example of the P-wave equalization process for the 23 May 2013 event and illustrates the steps taken to compute the transfer functions used in our analyses. Figure S1 shows the original data, the rotated data, the vertical-component stack used in deconvolution, and the resultant vertical, radial, and tangential transfer functions.
Figure S1. Example showing the original waveforms, stack, and deconvolution for Transantarctic Mountains Northern Network (TAMNNET) station BEBP from the 23 May 2013 event (Table 1 of the main article). (a–f) All velocity seismograms are displayed in counts. (g–i) Transfer functions are displayed in units of 1/s. (a) All vertical components from station BEBP and from KPSN stations KP01–KP04. All seismograms are displayed on the same vertical axis, with each trace time shifted. The gray shading indicates the stations used in the stacking procedure. (b) The north–south (N–S) component for station BEBP. (c) The east–west (E–W) component for station BEBP. (d) The array-averaged vertical component (composed from the traces in the shaded area in a). This array-averaged component is deconvolved from the (a; unshaded trace) vertical, (e) radial, and (f) tangential components of station BEBP to obtain the (g) vertical, (h) radial, and (i) tangential transfer functions. The (g) vertical and (h) radial transfer functions are then used in the downward continuation and decomposition analyses.
[ Back ]