This electronic supplement contains plots of the seismograms (Figs. S1 and S3) used in this study as well as of the hypocenter locations of the seismicity induced by the geothermal project in Basel (Fig. S2). The two plots of the seismograms show the degree of similarity among the signals recorded from each of the two earthquake clusters as well as the S phases used for determining ML and Mw.
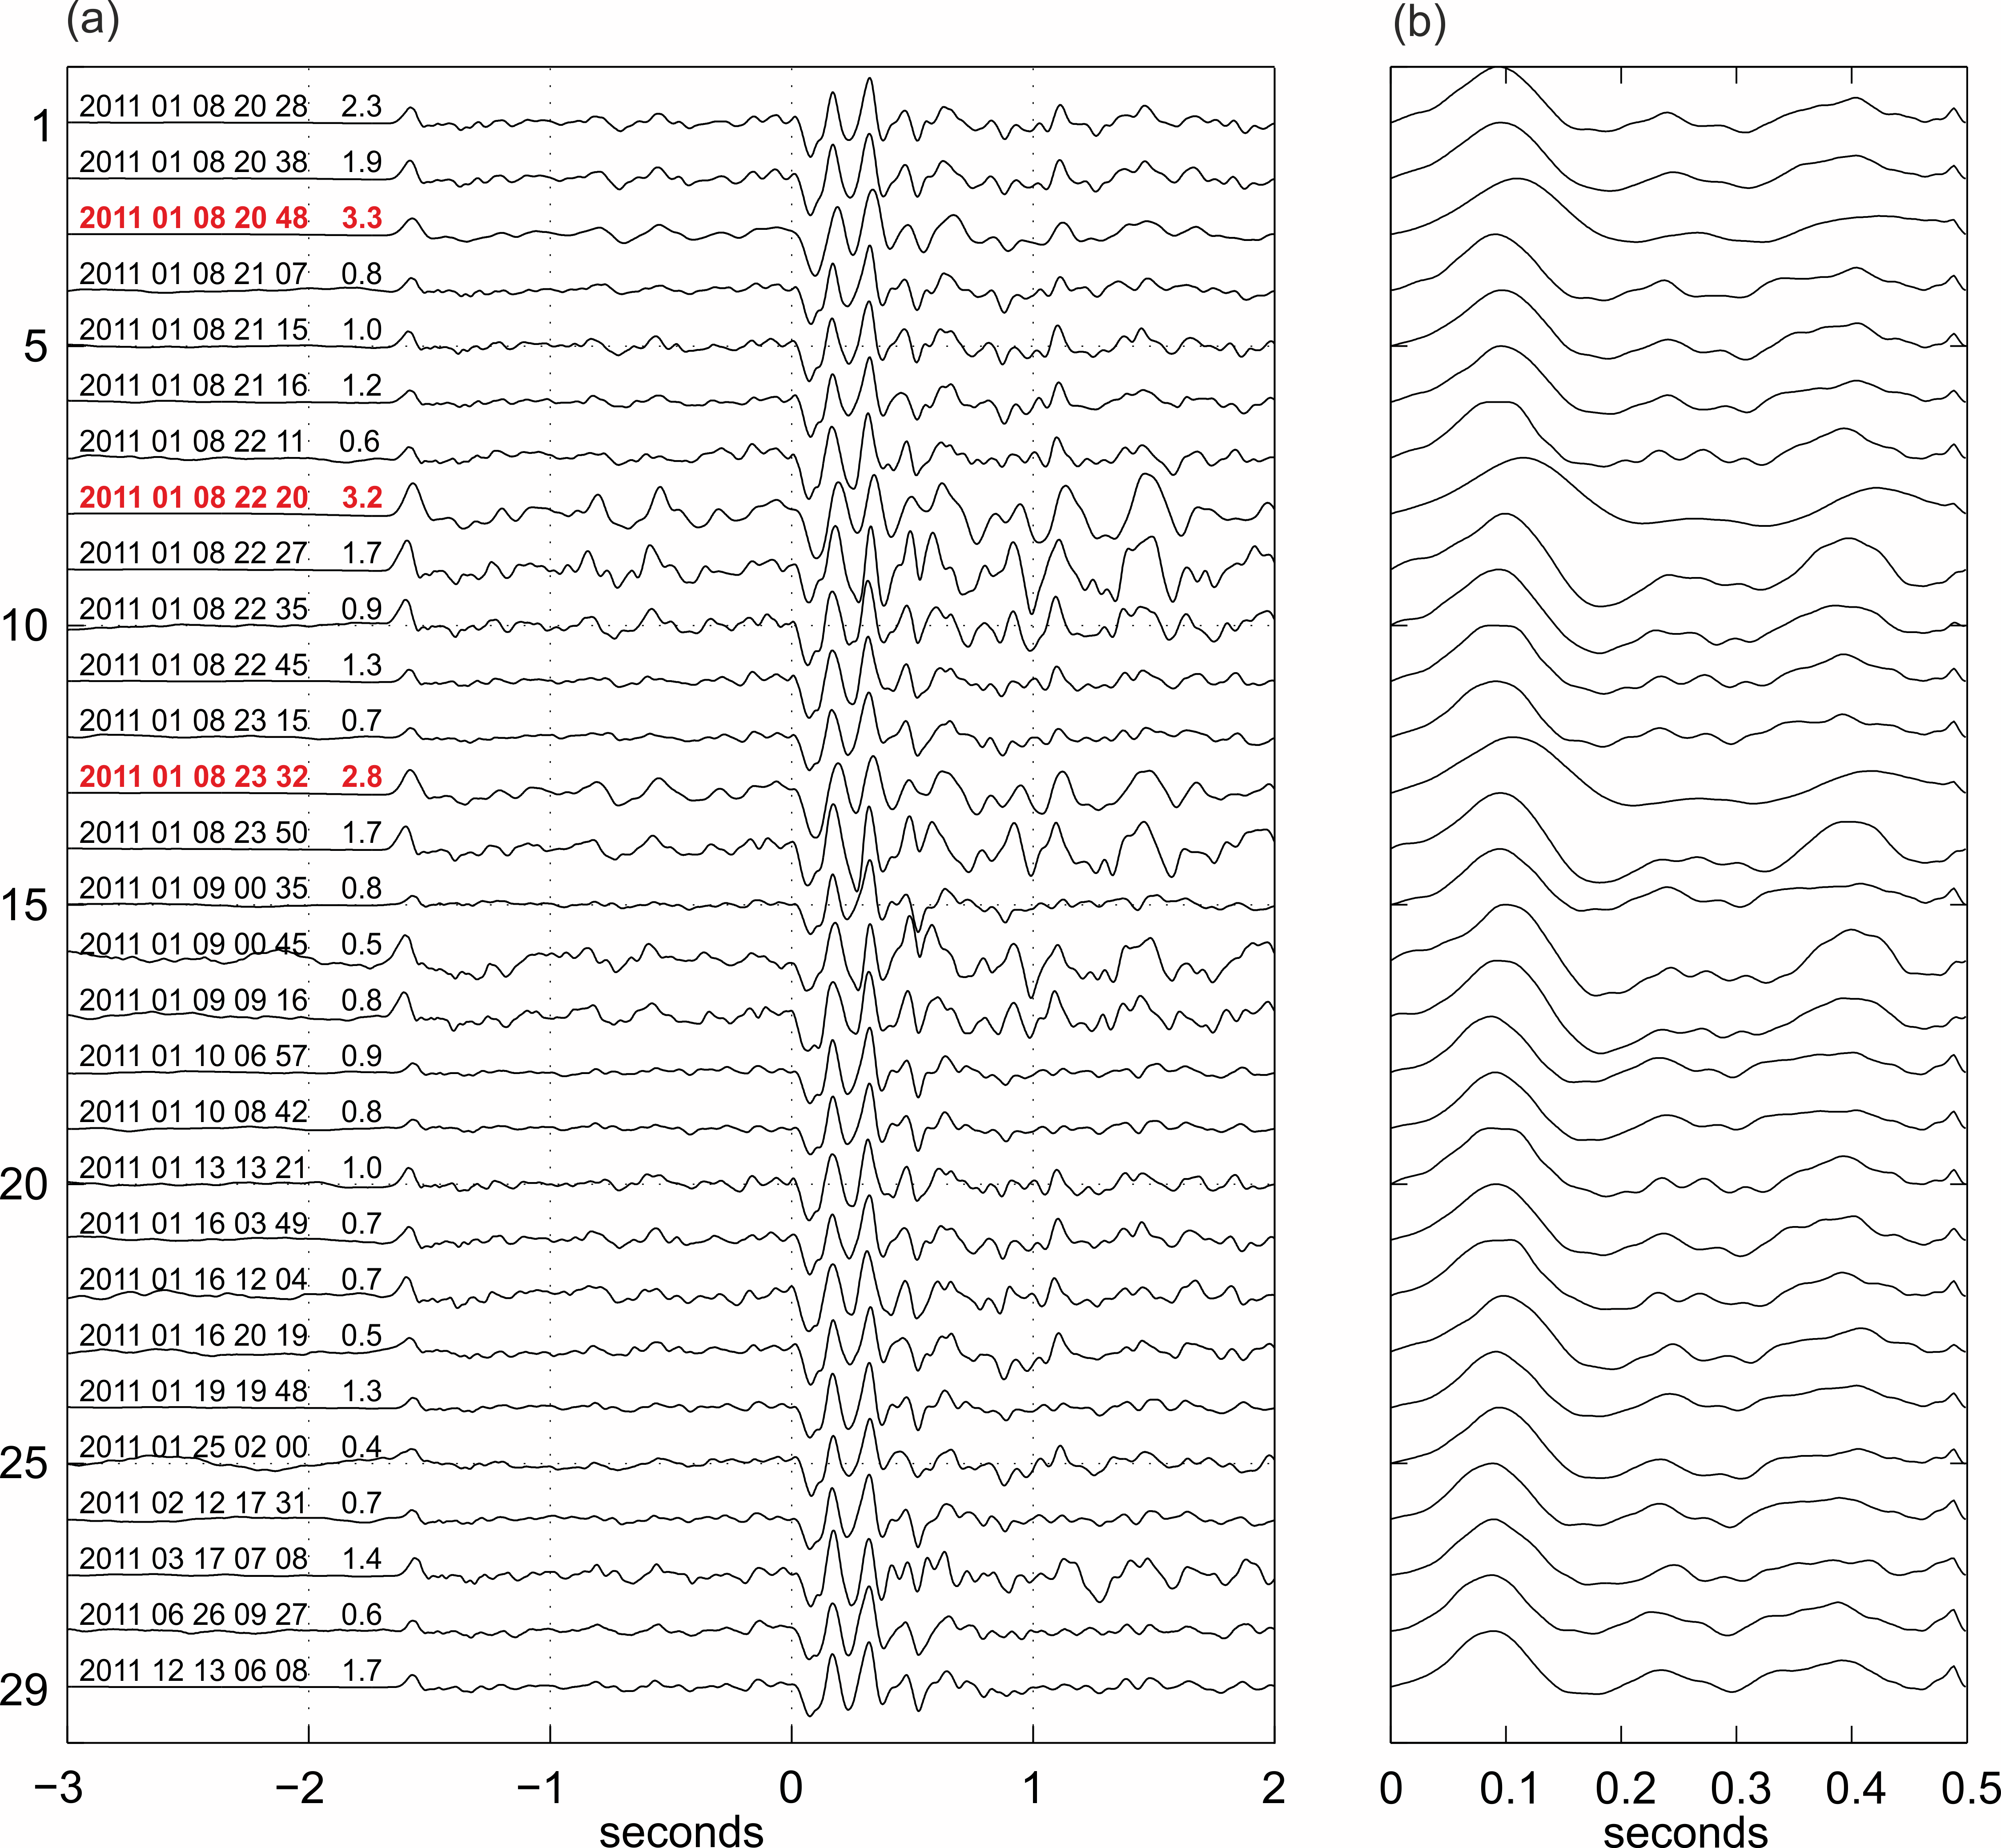
Figure S1. Seismograms of the 29 events of the Sierre sequence recorded at station LKBD and analyzed in the main article: (a) vertical displacement, band-pass filter 0.5–20 Hz; the numbers after the date and time above each trace is the catalog ML determined from the records of the national network of the Swiss Seismological Service; the labels of the three strongest events are highlighted in red; (b) 0.5-s-long time window starting at the S-wave onset of the horizontal displacement, rotated to maximum amplitude of the Sg phase.
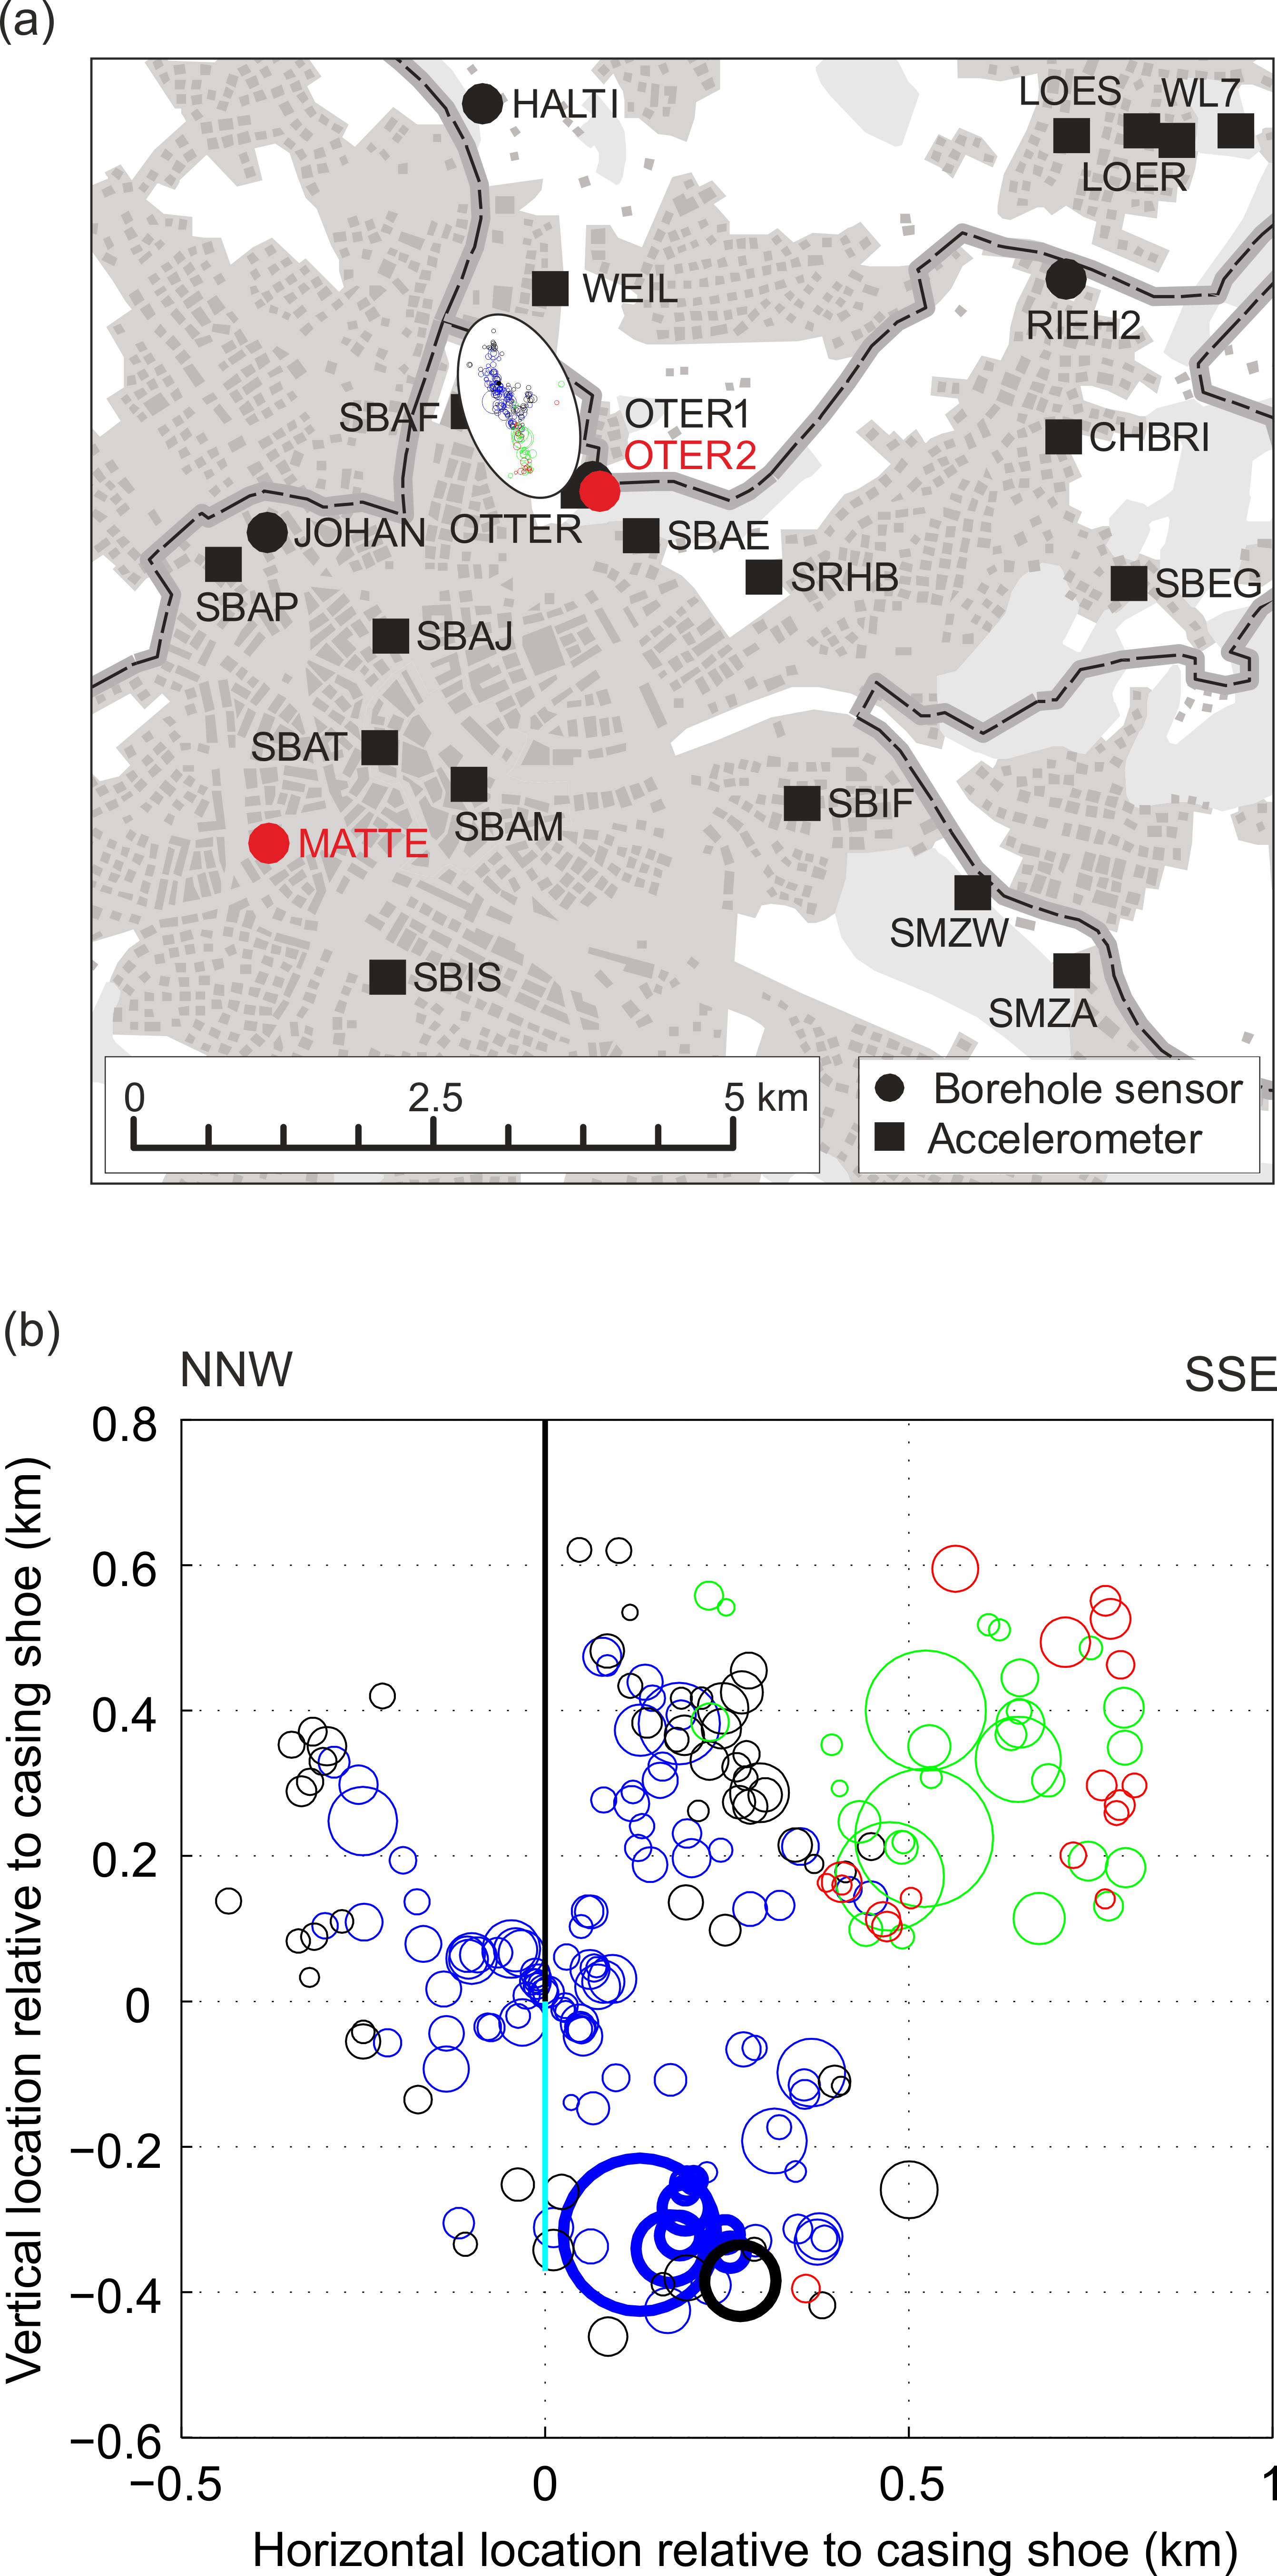
Figure S2. (a) Map of the city of Basel with the location of the sensors and the epicenters of the induced events detected by the surface network of the Swiss Seismological Service between December 2006 and October 2016 (highlighted by the white ellipse); the two borehole sensors (MATTE and OTER2) mentioned in the main article are shown in red; the heavy dashed lines are the national borders between France and Germany in the north and Switzerland in the south. (b) Depth cross section through the hypocenters of the events shown in (a); blue, 3–8 December 2006 (bleed-off); black, 3–31 December 2006; green, 1 January–30 November 2007; red, after 30 November 2007; the size of the circles corresponds to the source dimension for a stress drop of 10 MPa; the bold circles at the bottom of the plot are part of cluster 82, mentioned in the main article; the vertical line marks the location of the borehole (cased in black and open in blue).
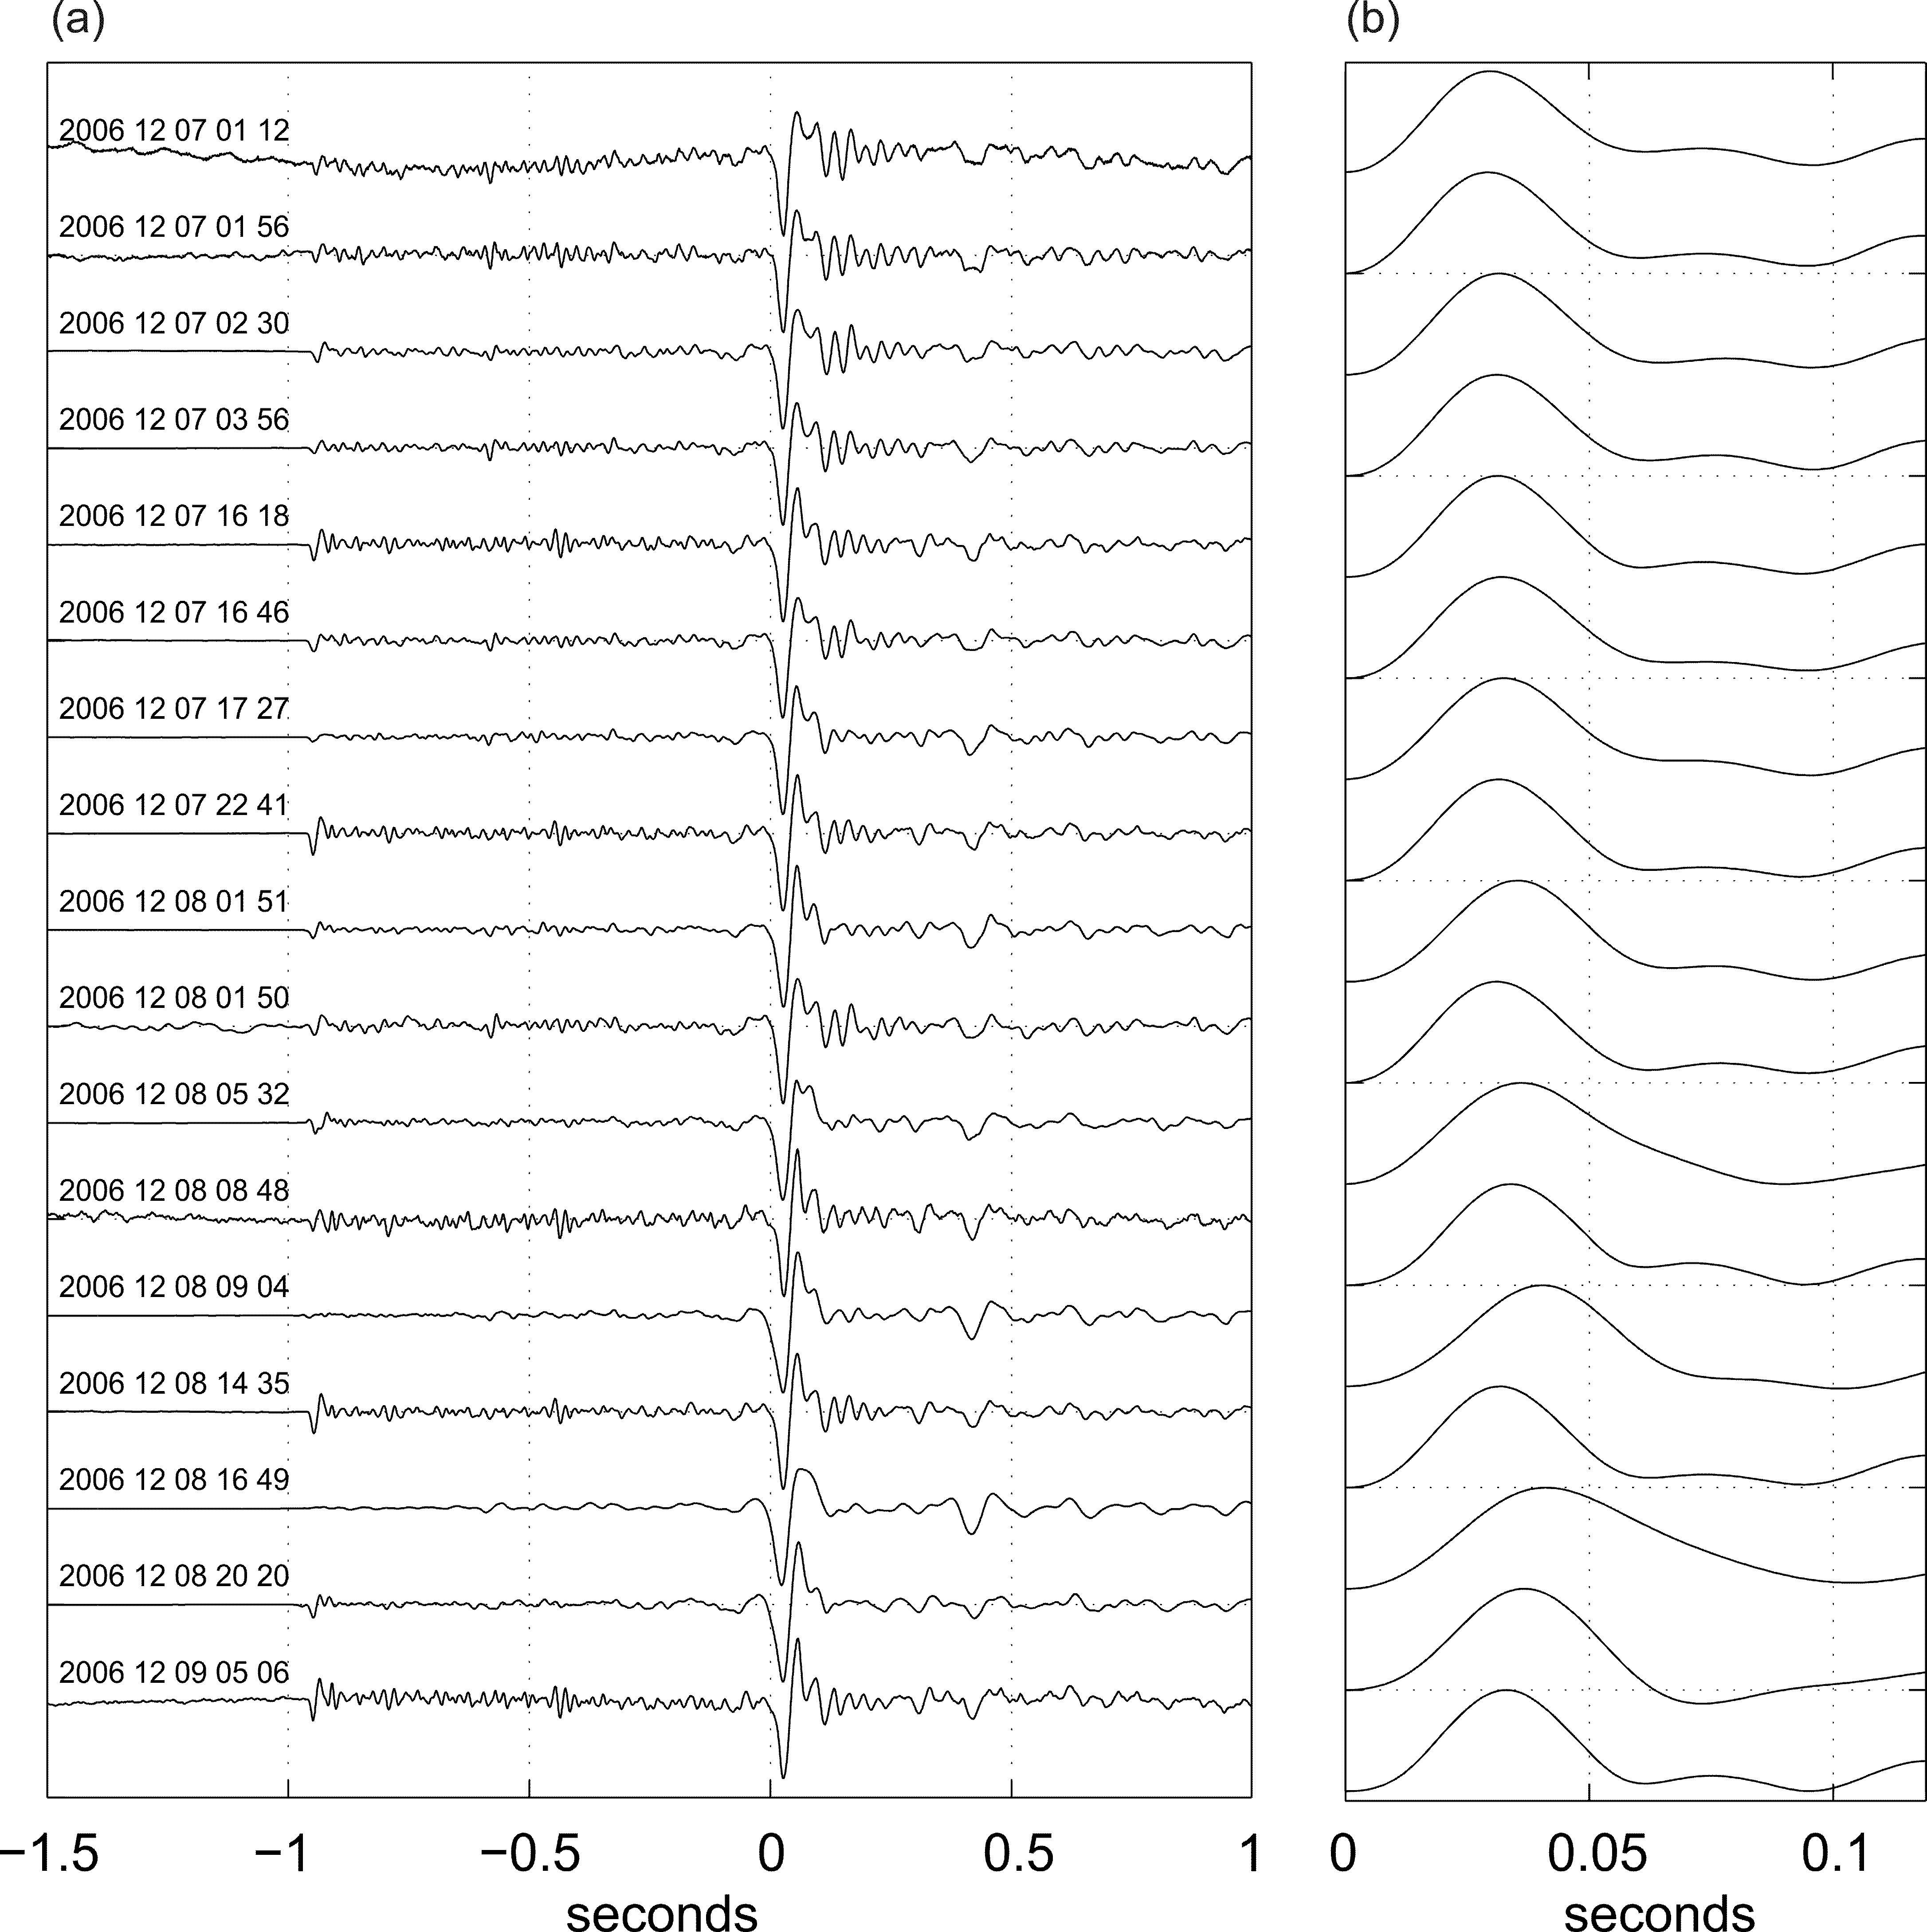
Figure S3. Seismograms of the 17 events of cluster 82 of the Basel-induced seismicity recorded at a depth of 553 m by the borehole sensor at station MATTE and analyzed in the main article: (a) component B, instrument corrected velocity; (b) components A and B, instrument corrected displacement, rotated to maximum amplitude of the Sg phase.
[ Back ]