This electronic supplement contains four figures and five tables. Figures S1 and S2 show the arrival times determined automatically by the algorithm of the P and S waves on strong-motion recordings of Mexican earthquakes. Figures S3 and S4 show the location of the strong-motion stations relative to the epicenter of the 2010 Chile and 2011 Tohoku earthquakes, respectively.
Table S1 shows the hypocentral data of the earthquakes recorded by Seismic Alert System of Mexico (SASMEX) for which an alert was issued from 1991 to 2014, making use of the algorithm 2(tS–tP). Table S2 includes the focal parameters of earthquakes along the Mexican subduction zone that propitiated an early warning alert in Mexico City, together with the (tS–tP) time, parameters a and m, and a comparison between the magnitude obtained from the algorithm (m2(tS–tP)) and the magnitude reported by official agencies. Table S3 shows the list of subduction earthquakes with Mw>6.0 recorded by other networks, which occurred from 1985 to 2014. Table S3 also shows the results of the performance test of the algorithm 2(tS–tP) for these earthquakes. Tables S4 and S5 show the strong-motion stations and the results of the performance test of the 2010 Mw 8.8 Maule, Chile, and the 2011 Mw 9.0 Tohoku, Japan, earthquakes, respectively.
Table S1. List of earthquakes used in the performance tests of the SASMEX from 1991 to 2014 with data recorded by SASMEX sensors. Hypocentral information is from the Mexican Seismological Service (Servicio Sismológico Nacional [SSN]) and the Global Centroid Moment Tensor (Global CMT).
Table S2. Performance tests using SASMEX stations with S–P times of less than 10 s. Performance of SASMEX using SASMEX strong-motion stations located close to the epicenter with S–P times less than 10 s and comparison of seismic magnitudes mb versus m2(tS–tP).
Table S3. Performance evaluation of the 2(tS–tP) algorithm for earthquakes with Mw ≥6.0, located at distances of at least 600 km to Mexico City, which occurred from 1985 to 2004 and was recorded by at least two near-field seismic sensors. Hypocentral data are based on the Global CMT catalog.
Table S4. Performance evaluation of the 2(tS–tP) algorithm for the 27 February 2010 Mw 8.8 Maule, Chile, earthquake.
Table S5. Performance evaluation of the 2(tS–tP) algorithm for the 11 March 2011 Mw 9.0 Tohoku, Japan, earthquake.
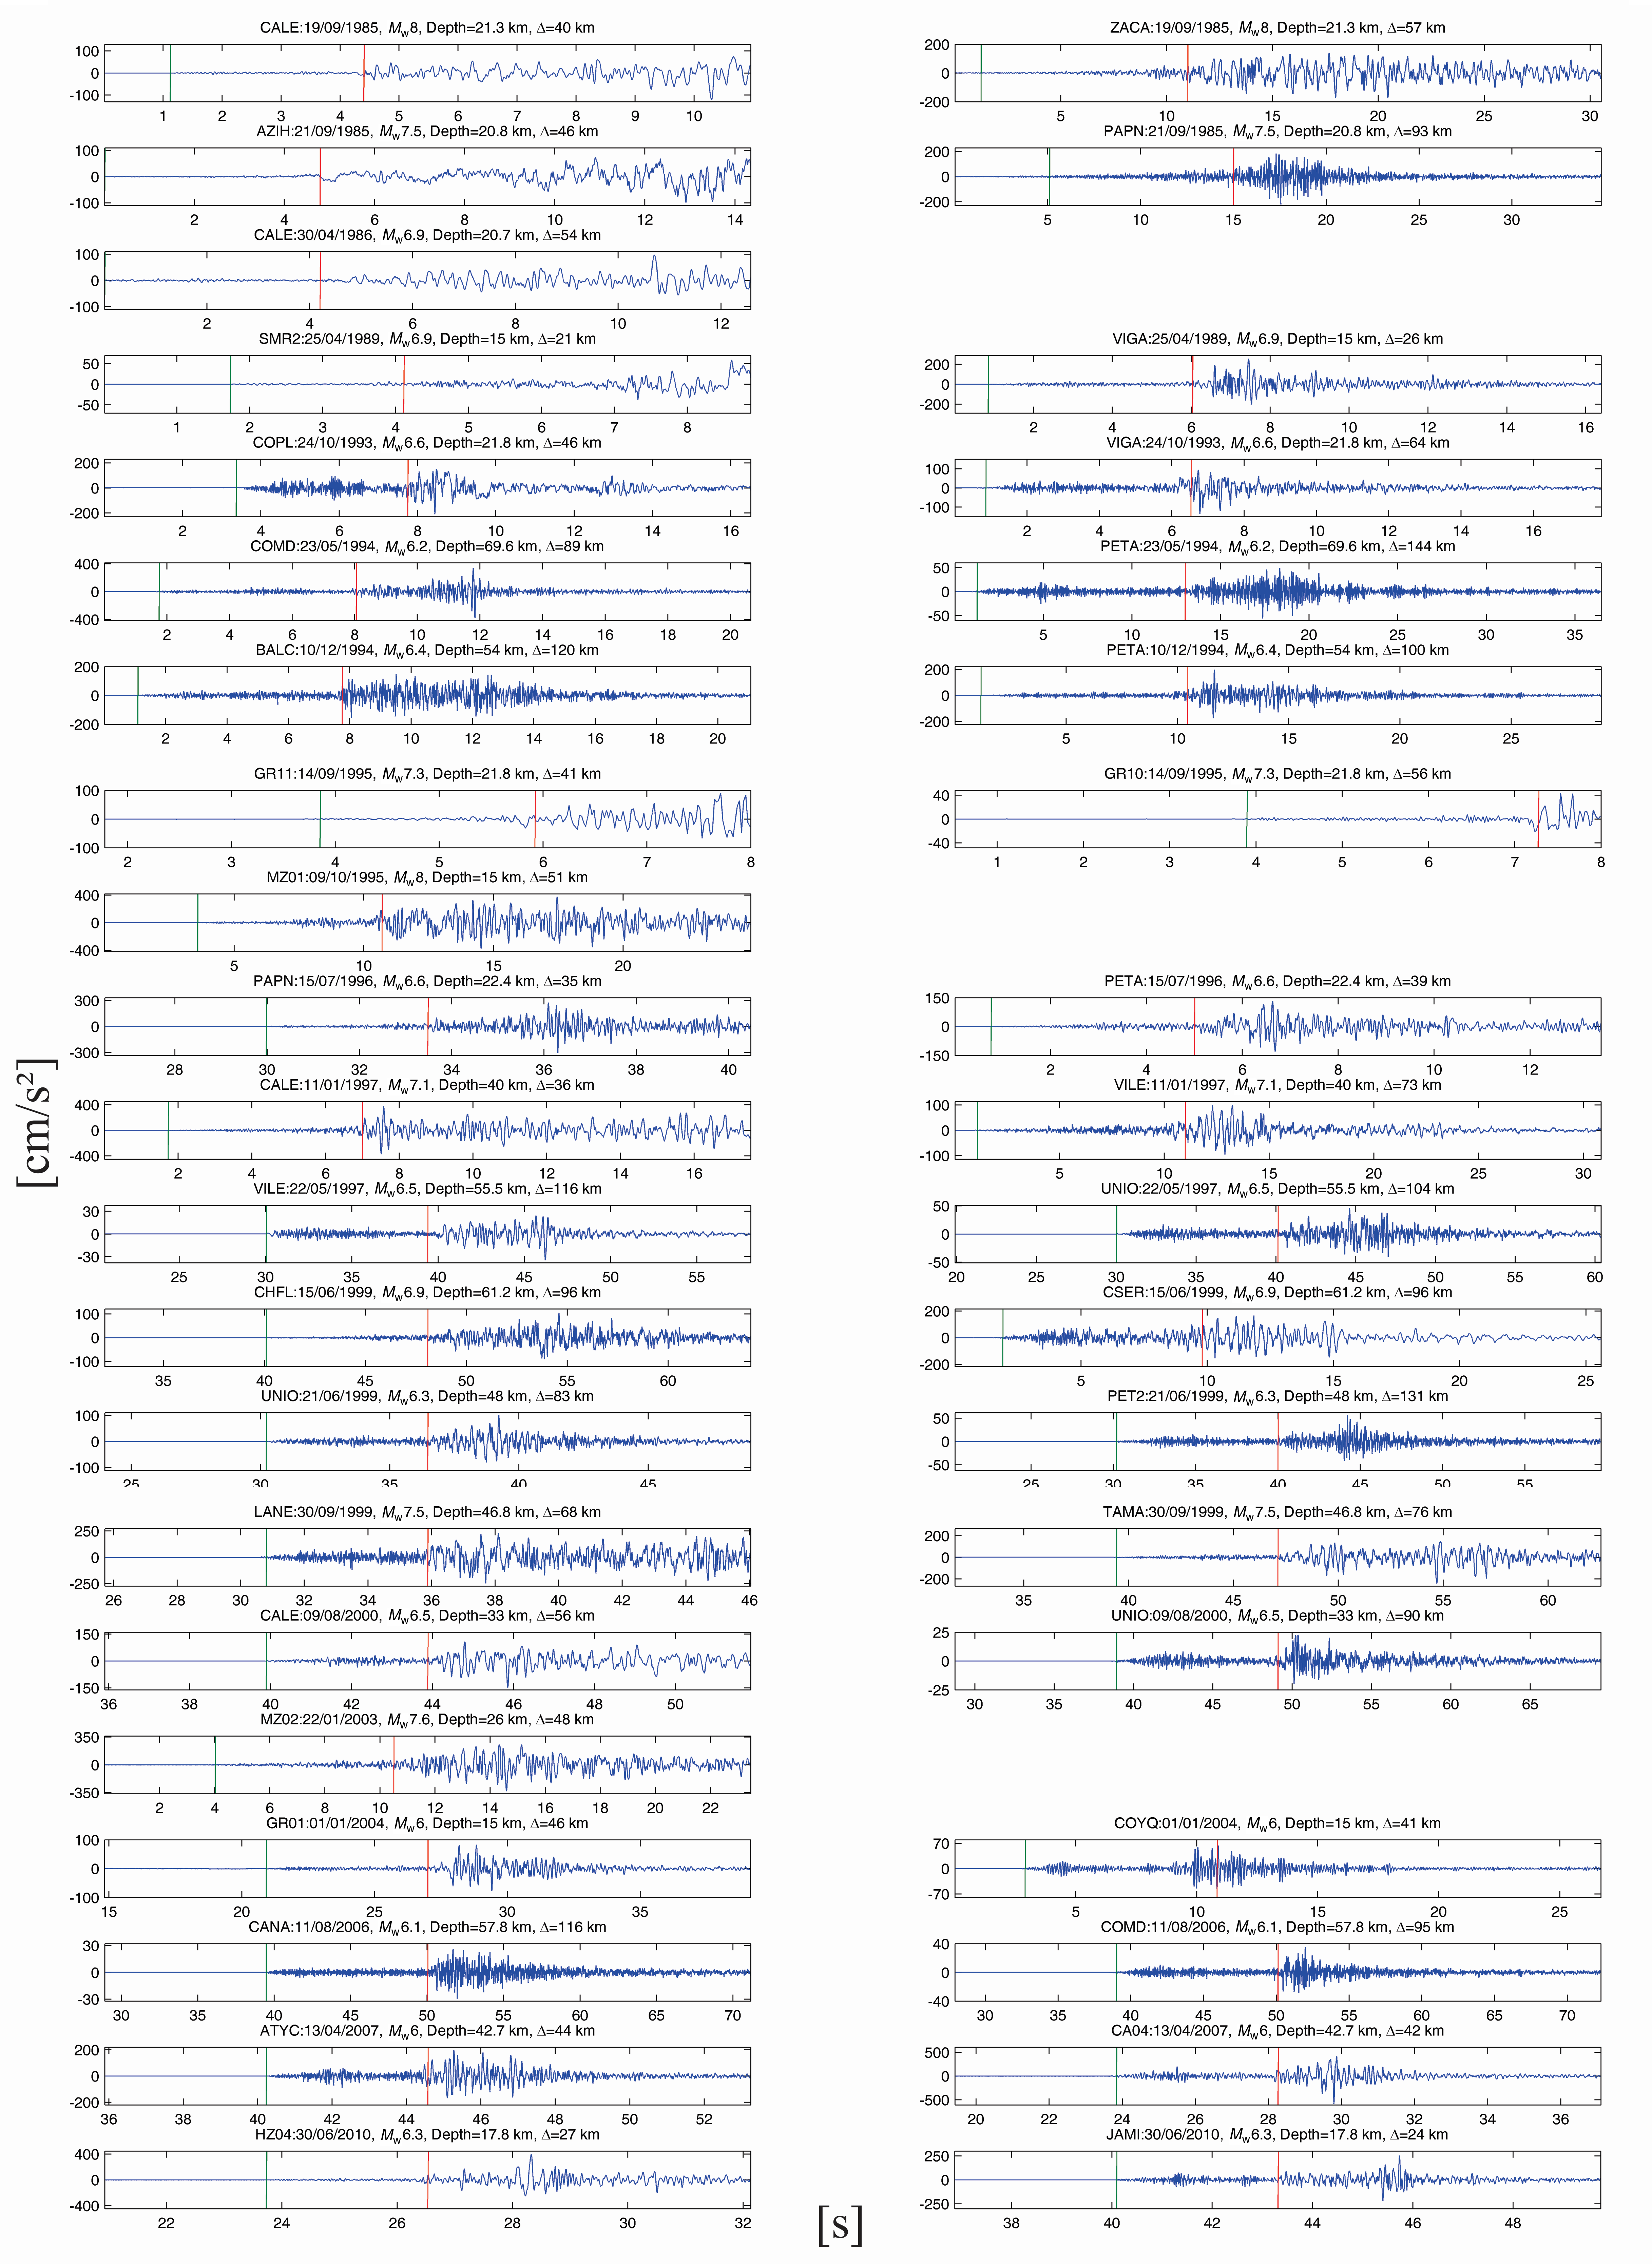
Figure S1. Strong-motion records of Mexican earthquakes from 1985 to 2010, showing the detection of the P and S waves as green and red tick marks, respectively, as determined automatically by the 2(tS–tP) algorithm.
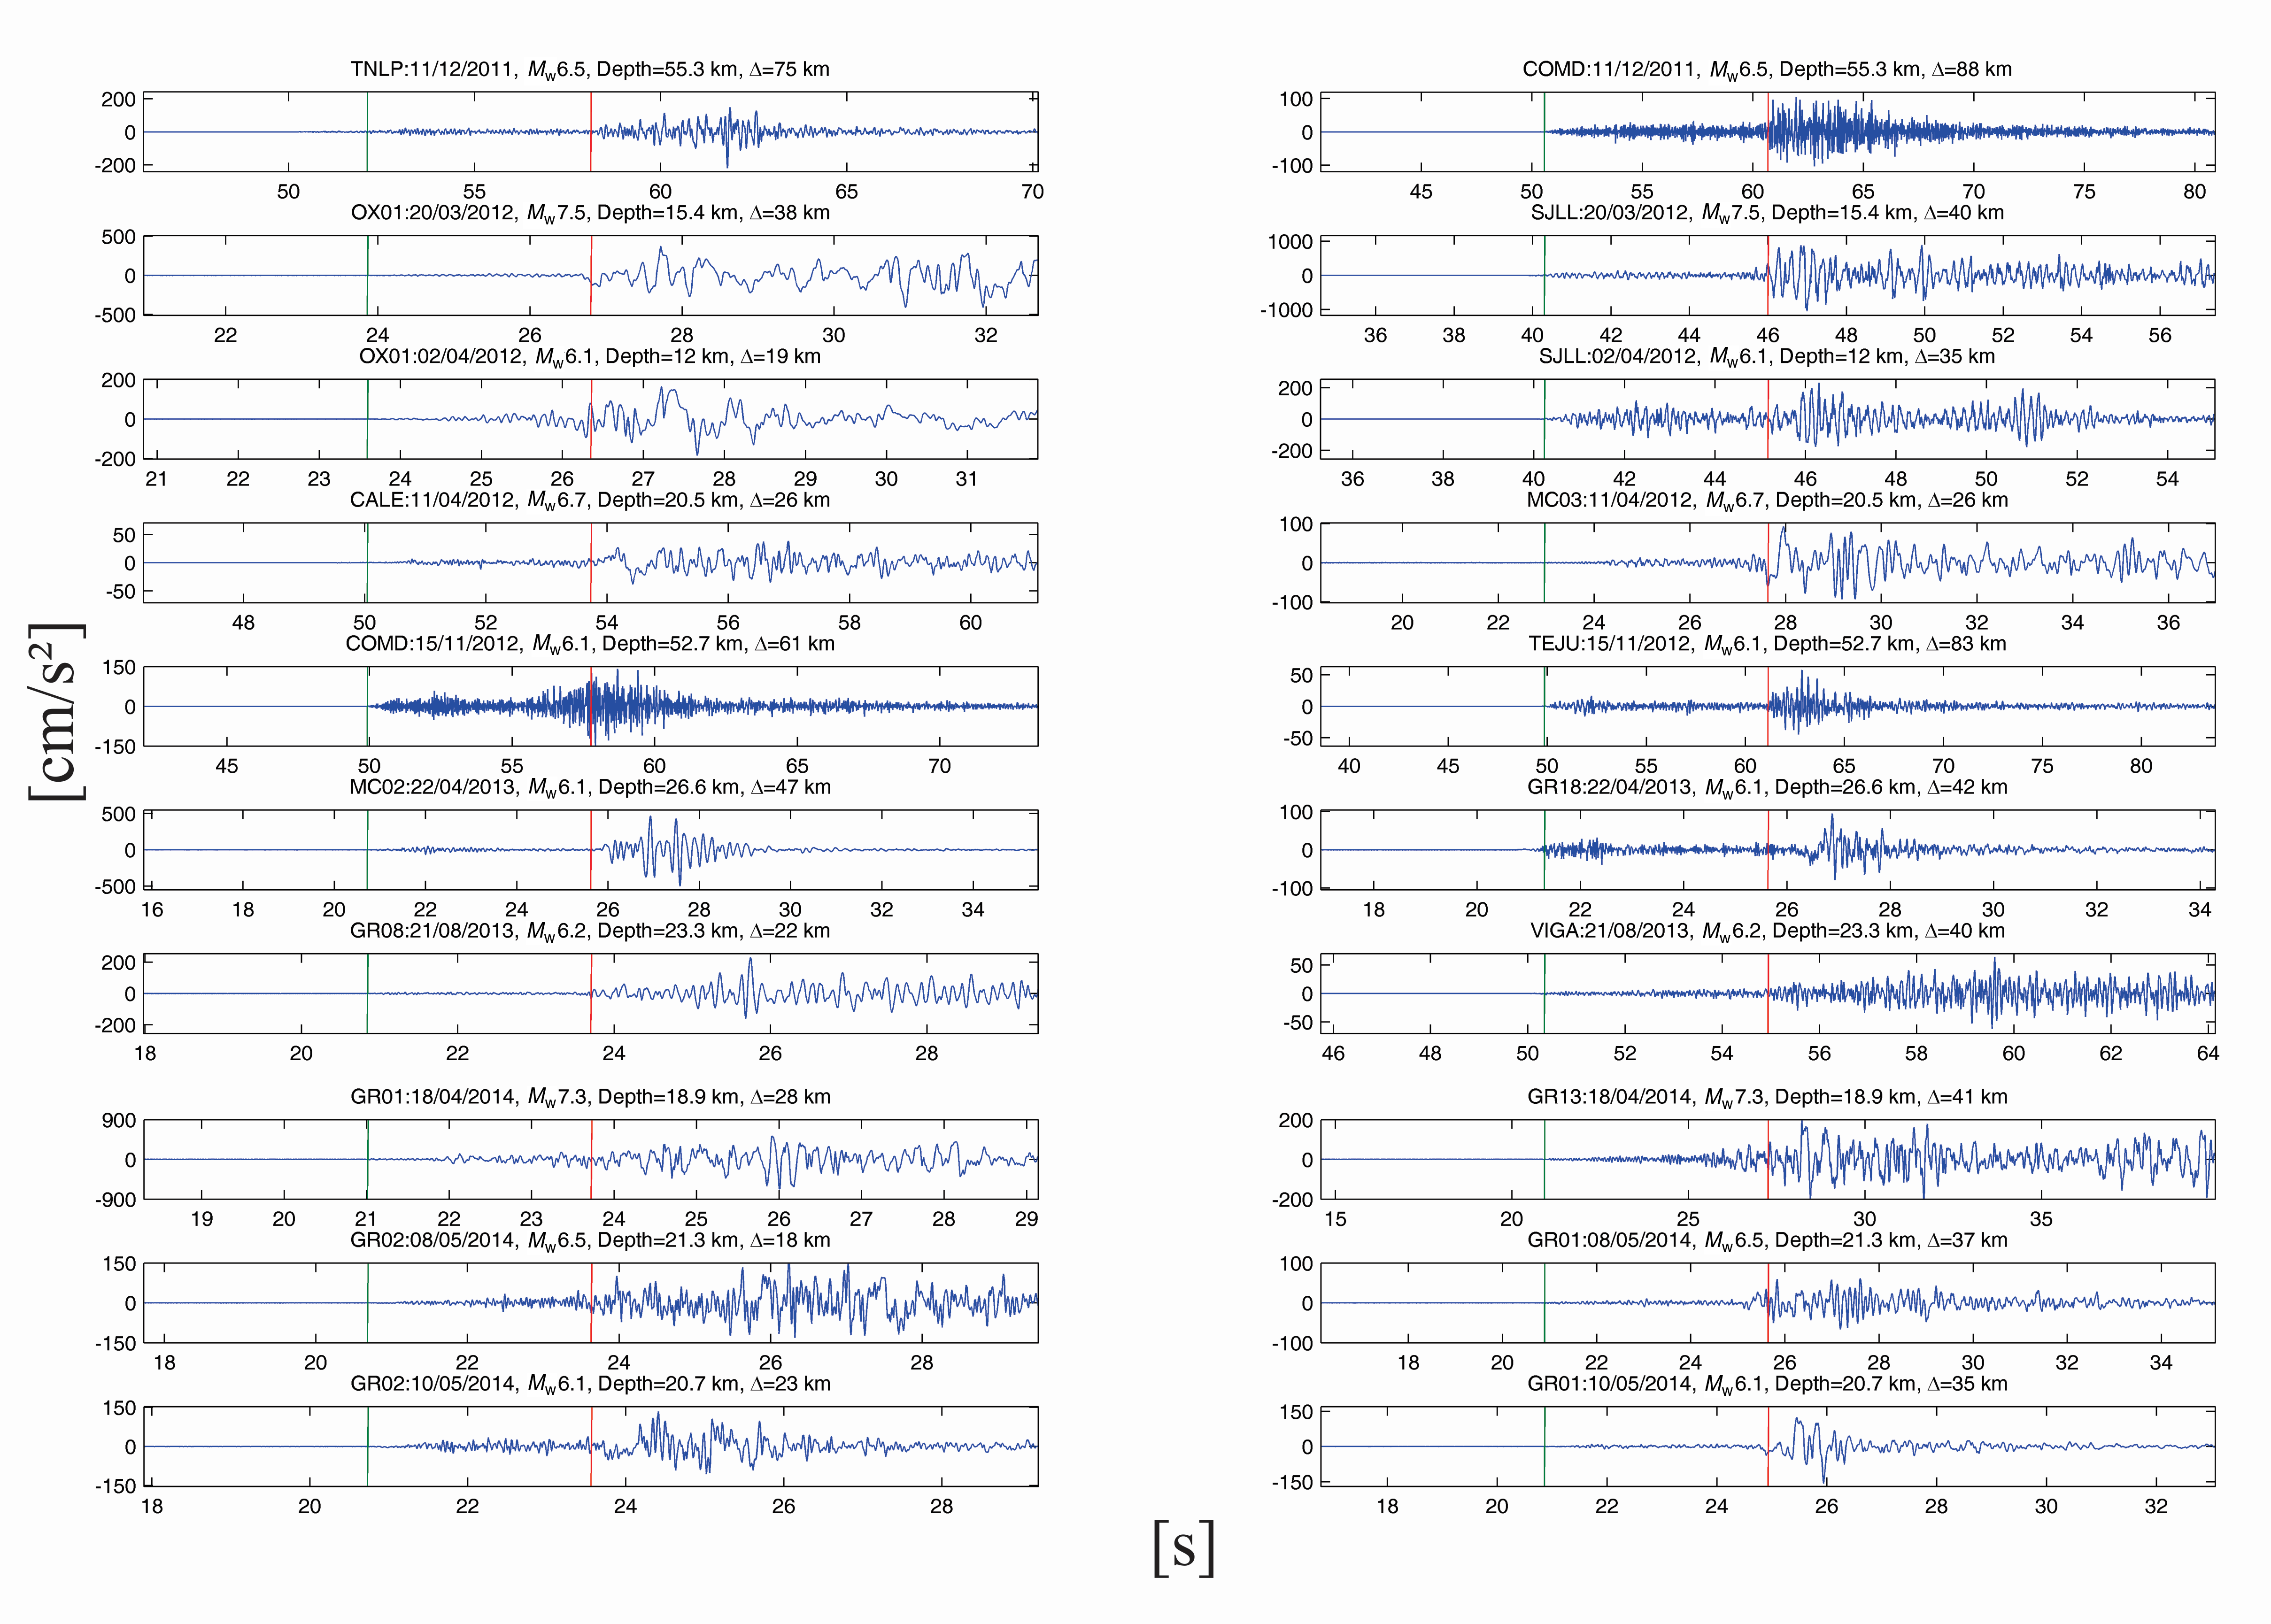
Figure S2. Strong-motion records of Mexican earthquakes from 2011 to 2014, showing the detection of the P and S waves as green and red tick marks, respectively, as determined automatically by the 2(tS–tP) algorithm.
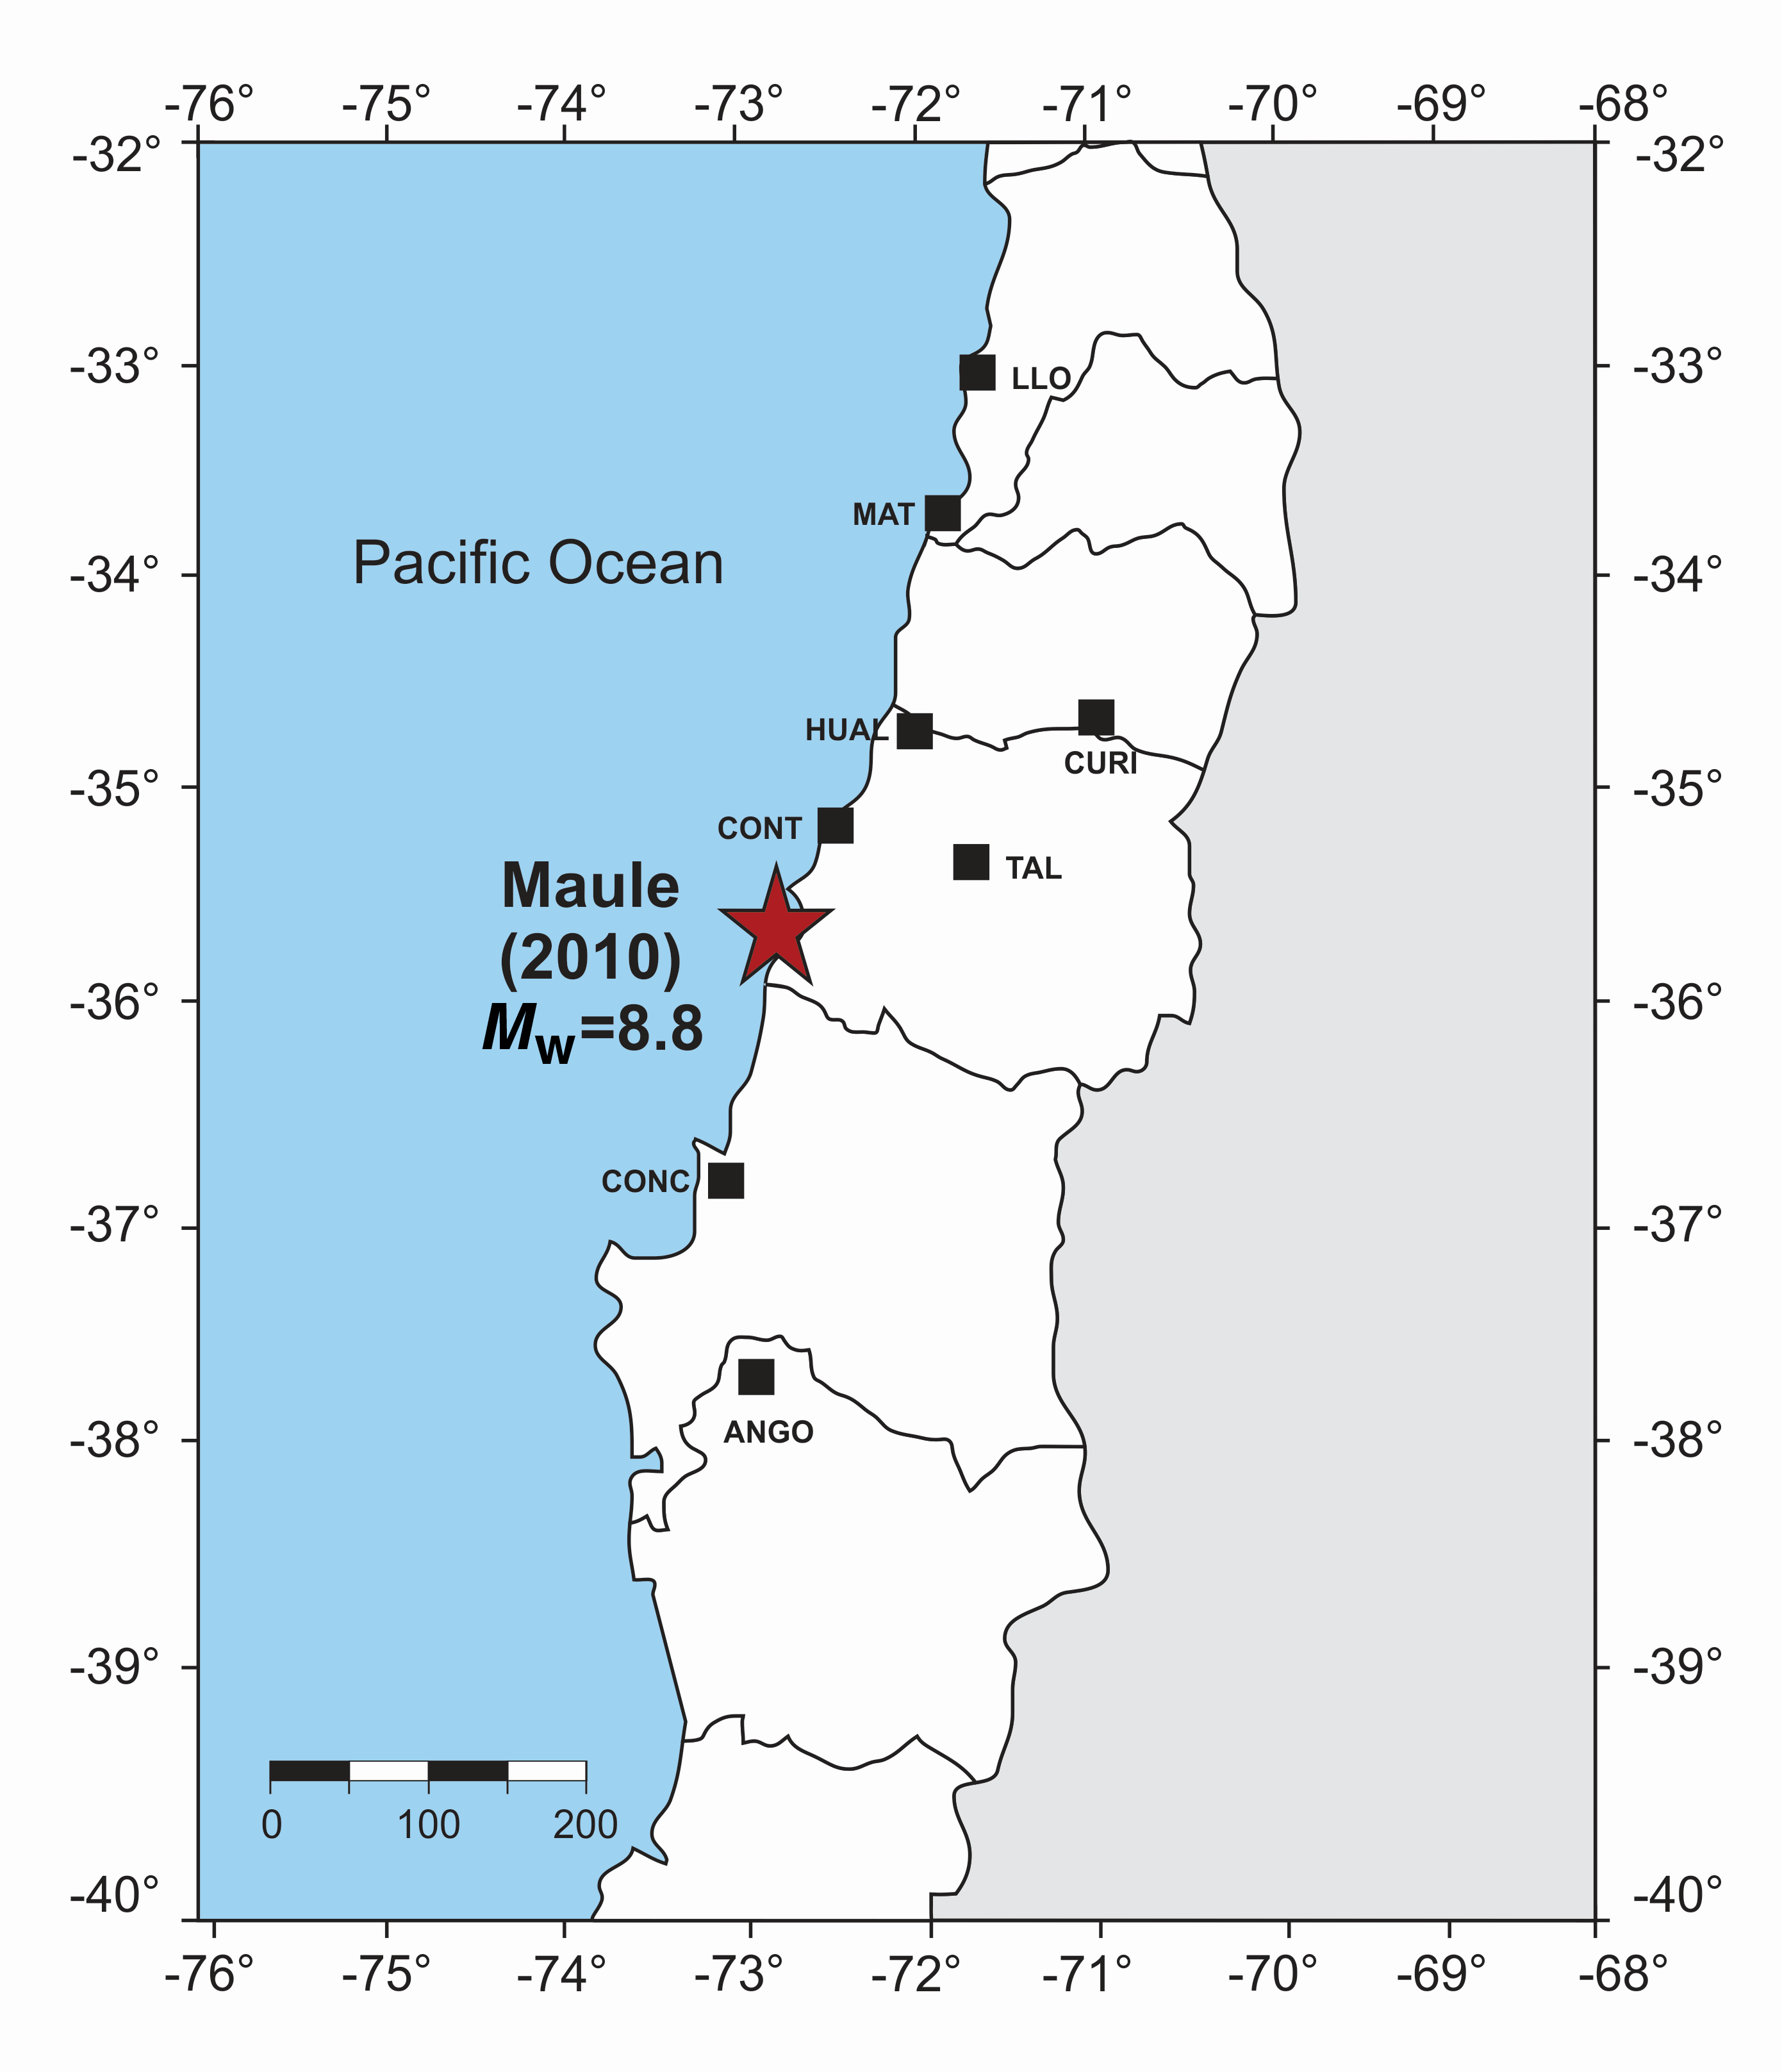
Figure S3. The location of the 27 February 2010 Mw 8.8 Maule earthquake in central Chile is shown as a star. The strong-motion stations used in the analysis are shown as black squares.
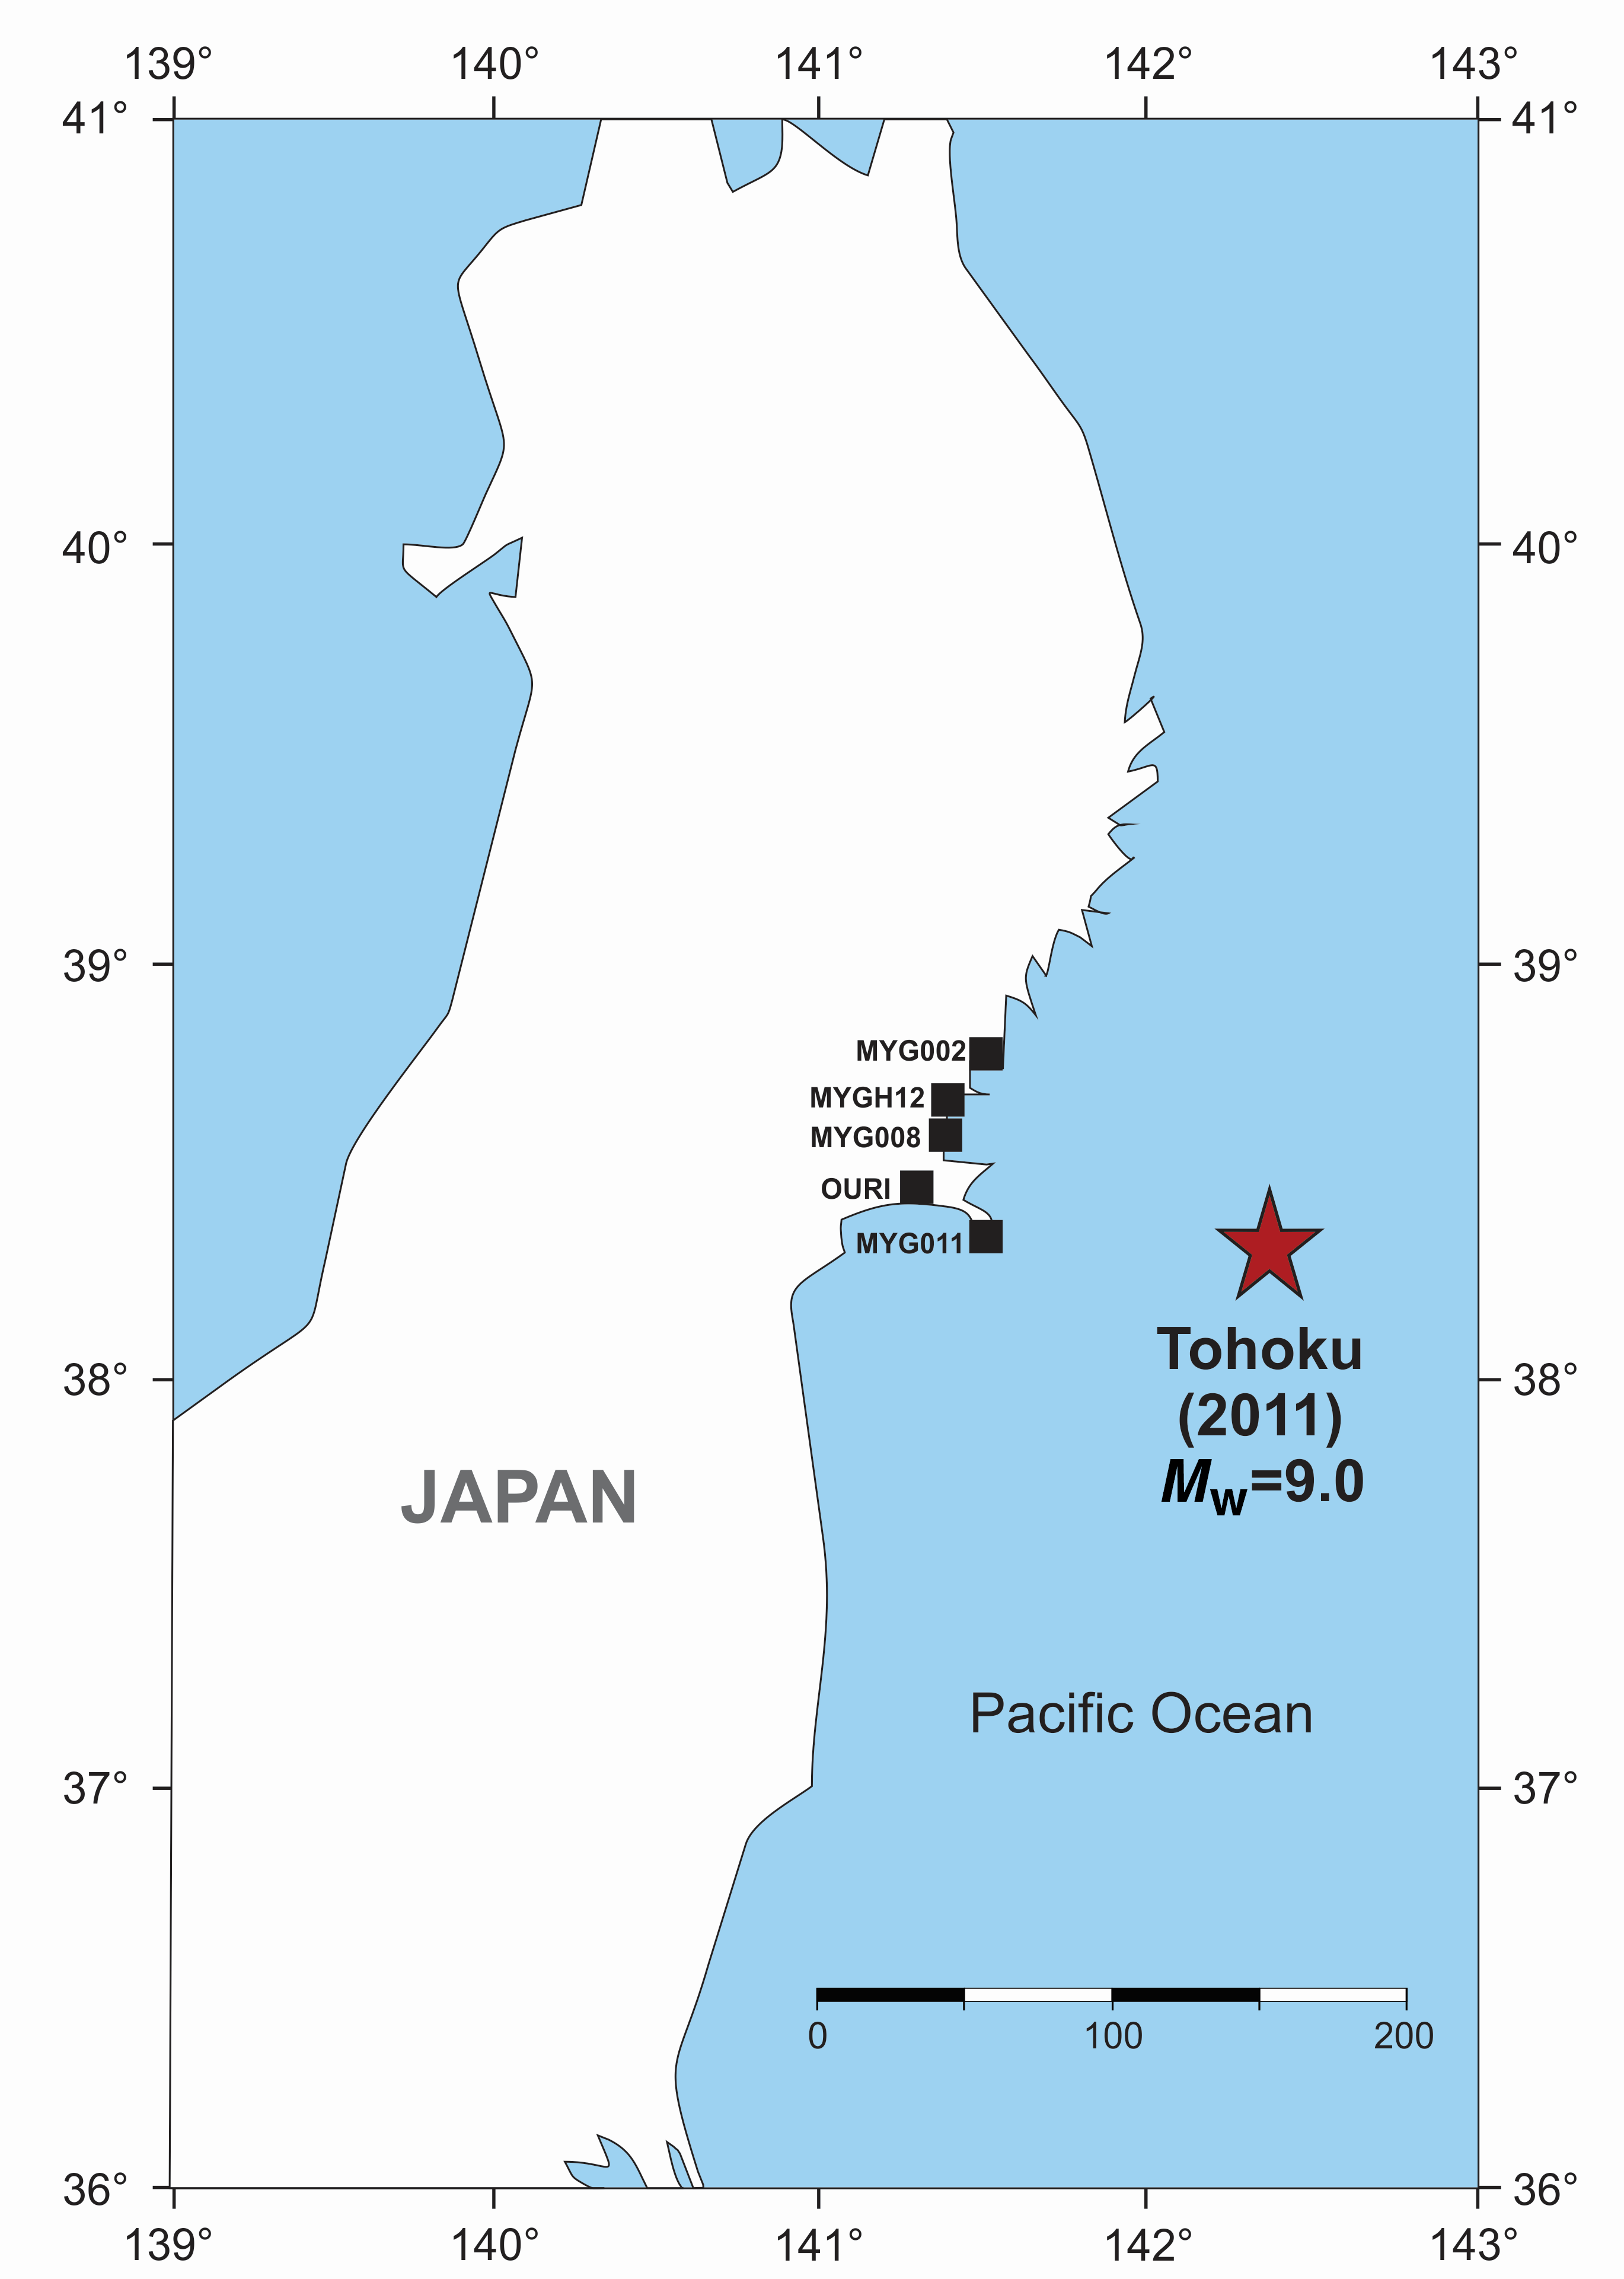
Figure S4. The location of the 11 March 2011 Mw 9.0 Tohoku, Japan, earthquake is shown as a star, and the squares denote the five seismic sensors used in the analysis.
[ Back ]