This electronic supplement contains the additional figures showing discretization, verification of the DistanceDecayCubeSampler, average simulated participation rate, and average cumulative magnitude–frequency distribution (MFD).
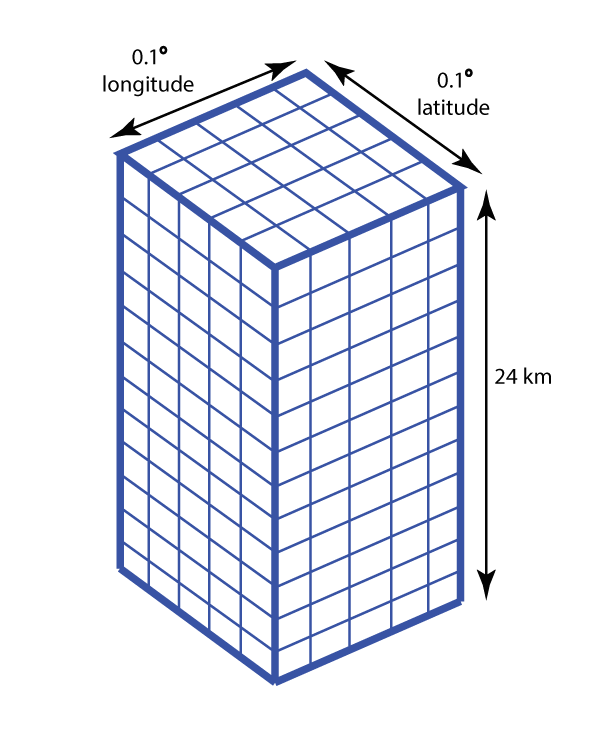
Figure S1. Subdiscretization: the 0.1°-by-0.1° gridded seismicity cells, in which the 300 cubes within are 0.02°-by-0.02° by 2 km in depth.
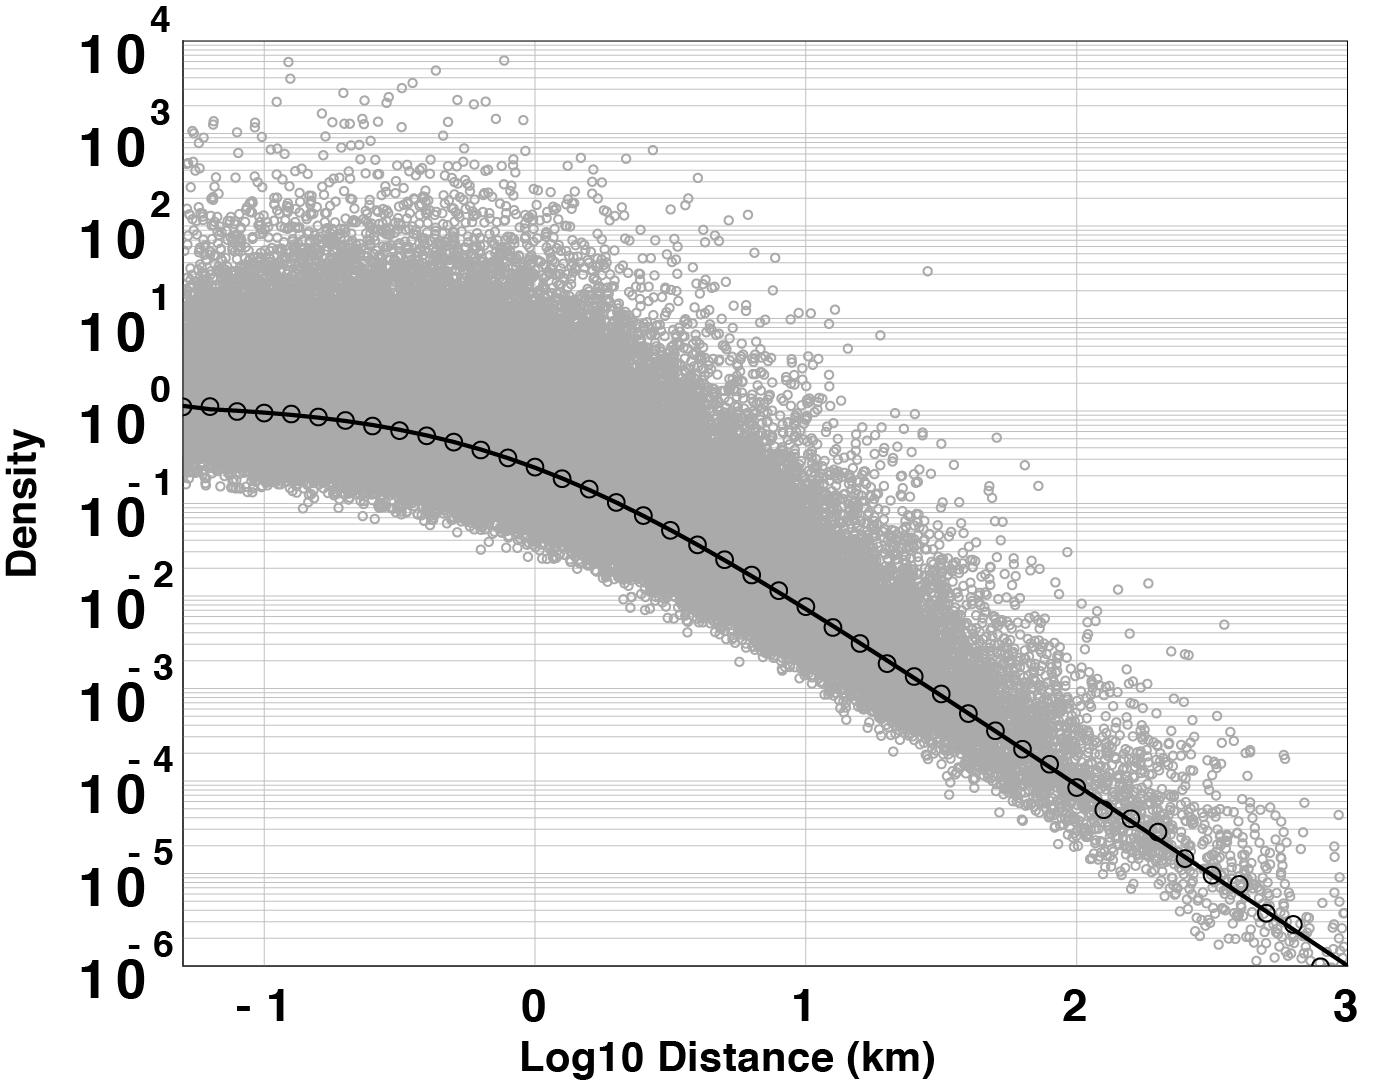
Figure S2. Verification of the DistanceDecayCubeSampler described in the main article. The target distance-decay function is shown with the black line; results from 100,000 random samples are shown with gray circles; and a histogram of the random samples is shown with the black circles. This example is for the case in which the parent (triggering-event) depth is 16 km. The shortest distance shown corresponds to 50 m.
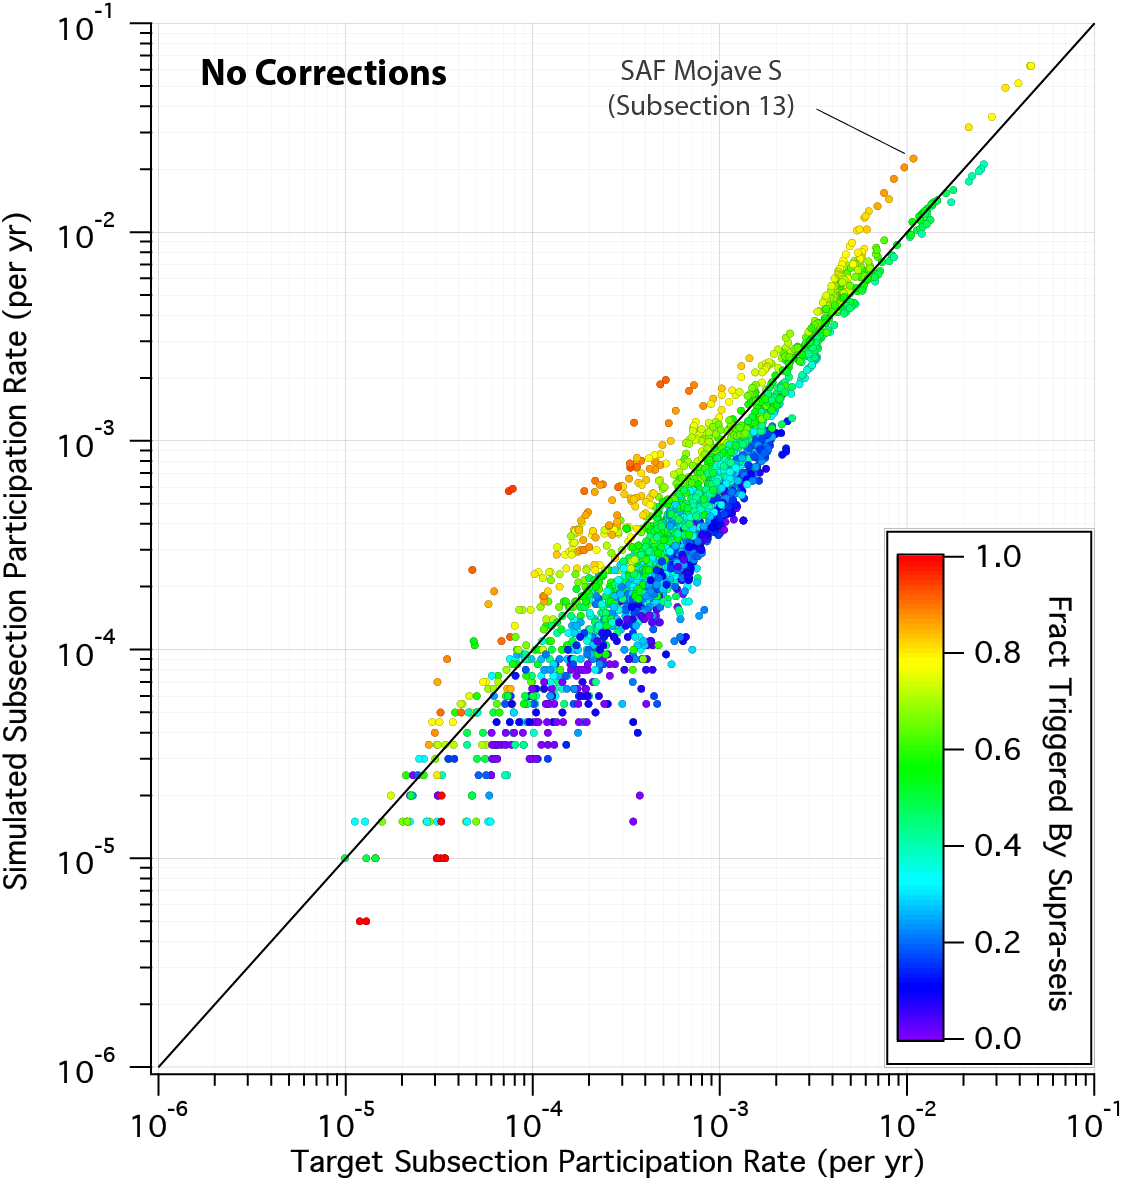
Figure S3. Same as Figure 13 of the main article but for simulations based on the following (nondefault) parameter values: ApplyGridSeisCorr = False, ApplySubSeisForSupraNucl = False, and TotalRateScaleFactor = 1.0.
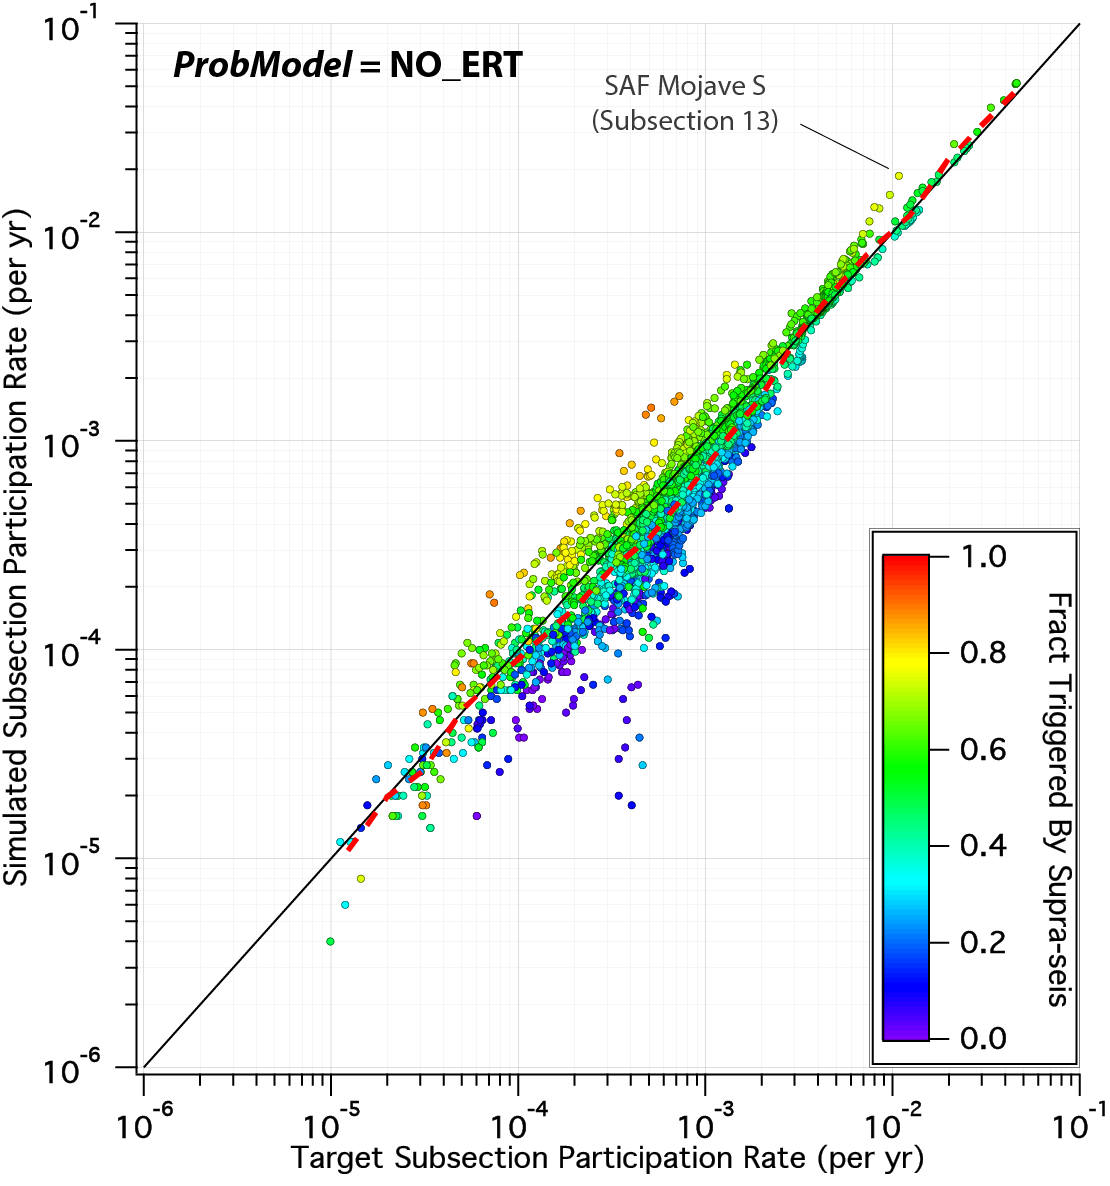
Figure S4. Same as Figure 13 of the main article, but for simulations based on the following (nondefault) parameter value: ProbModel = NO_ERT, meaning supraseismogenic ruptures were allowed to nucleate from the rupture zone of previous earthquakes in the simulation.
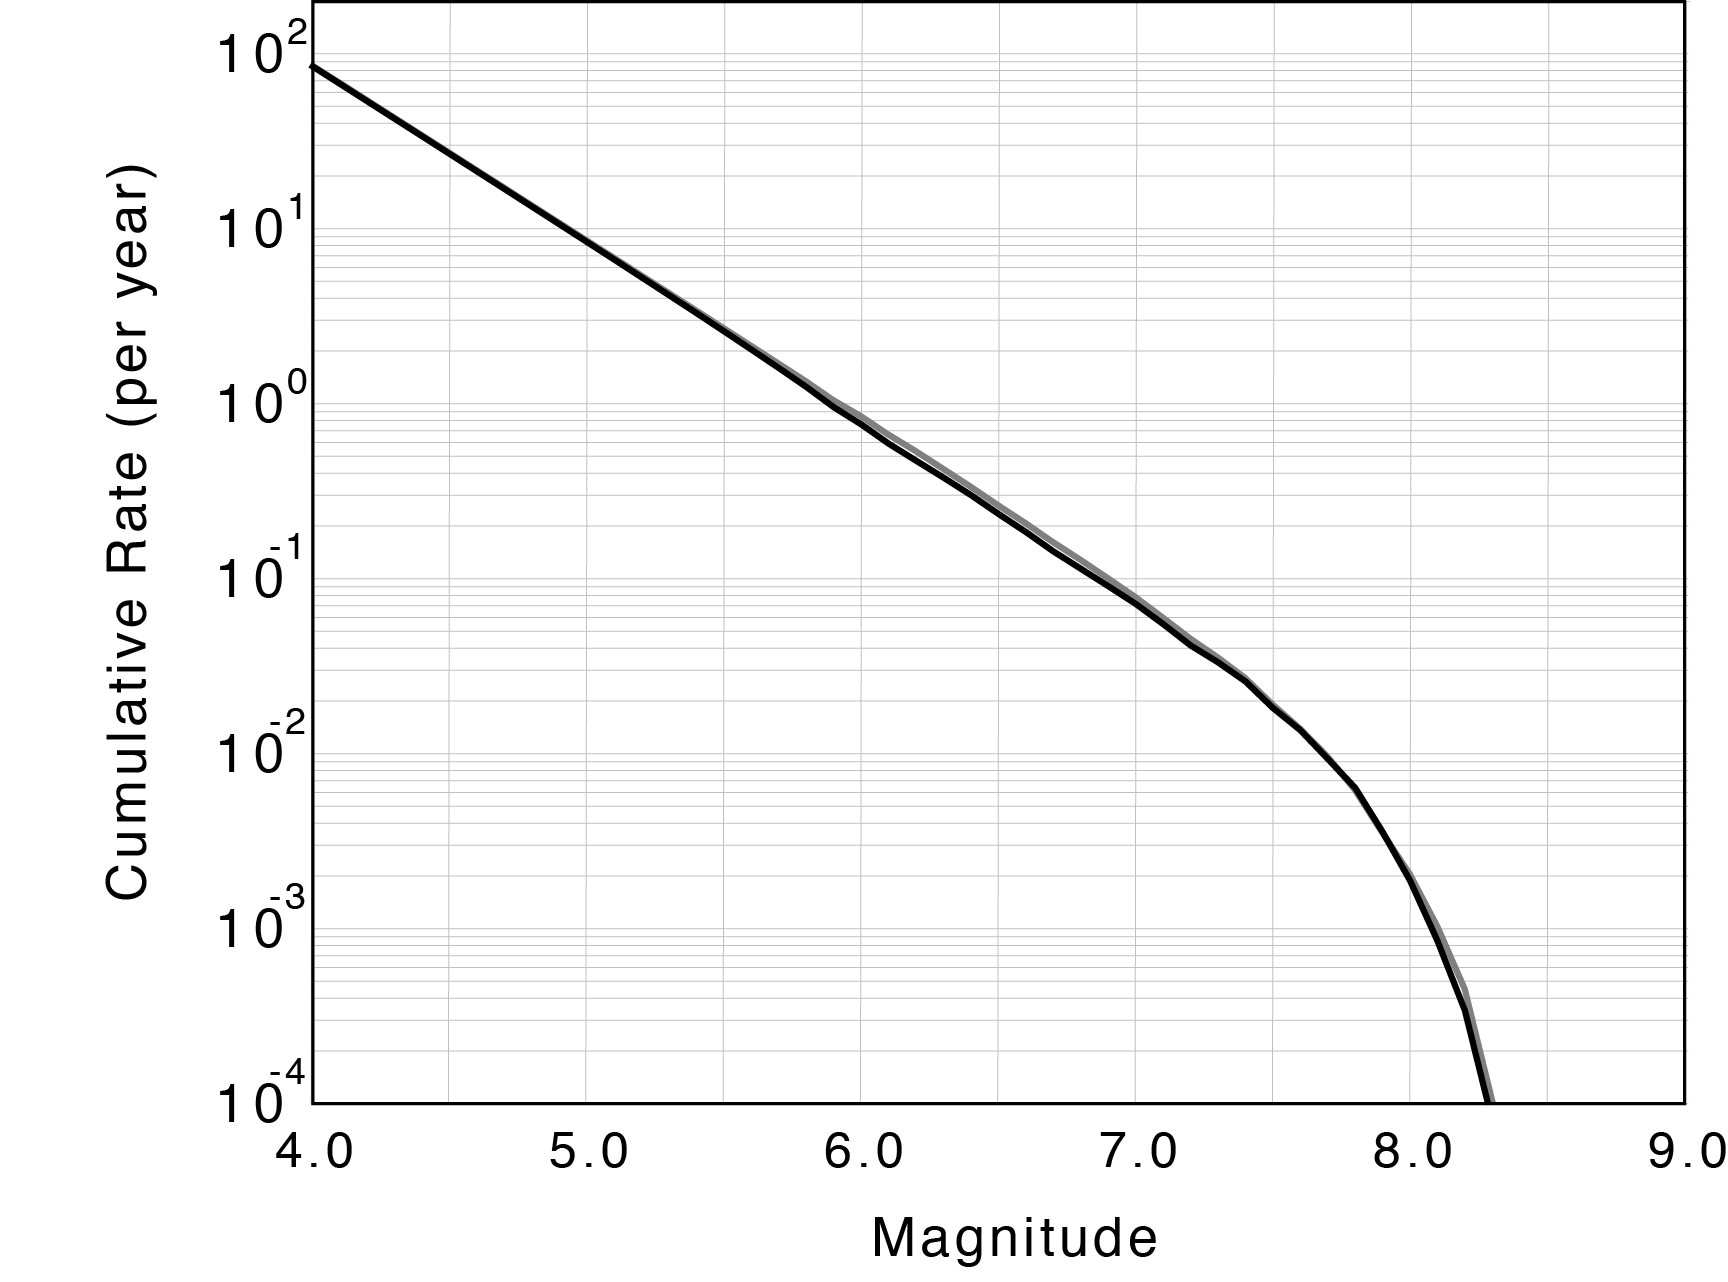
Figure S5. Same as Figure 11 of the main article (gray line is the average MFD from five hundred 1000-year simulations, and black is the target) but for which TotalRateScaleFactor = 1.0 and ProbModel = NO_ERT, meaning supraseismogenic ruptures were allowed to nucleate from the rupture zone of previous earthquakes in these simulations.
[ Back ]