This electronic supplement contains text, tables, and figures associated with our estimation of the 27 August 1904 and 4 September 1935 earthquake epicenters using the earthquake location code NonLinLoc (NLL; Lomax et al., 2000, 2014).
Table S1 lists the arrival-time data used to estimate the hypocenter and origin time of the 27 August 1904 earthquake. The times and phases are from the International Seismological Centre (ISC, 2013) database, though the earthquake is not in the ISC-Global Earthquake Model (GEM) supplementary catalog (Storchak et al., 2013). We verified these data against scanned bulletins in Schweitzer and Lee (2003) and found no discrepancies. (The scanned bulletins do contain several additional observations that we tested. Only P from SLM [St. Louis] and S from WAS [Washington, D.C.] had small residuals, but they did not change our solution appreciably. Rather than including the additional arrival times [some of which could be bad], we opted to use only the data in the ISC database.)
Table S2 lists the arrival-time data used to estimate the hypocenter and origin time of the 4 September 1935 earthquake. The times and phases are from the ISC database, and the earthquake is in the ISC-GEM supplementary catalog (Storchak et al., 2013).
In this section, we discuss the phase identification and arrival times for the two closest stations, Sitka and Victoria (Fig. 1 in the main article). Our goal is to provide a sense of the possible data errors that could be present within the data set for the 1904 earthquake.
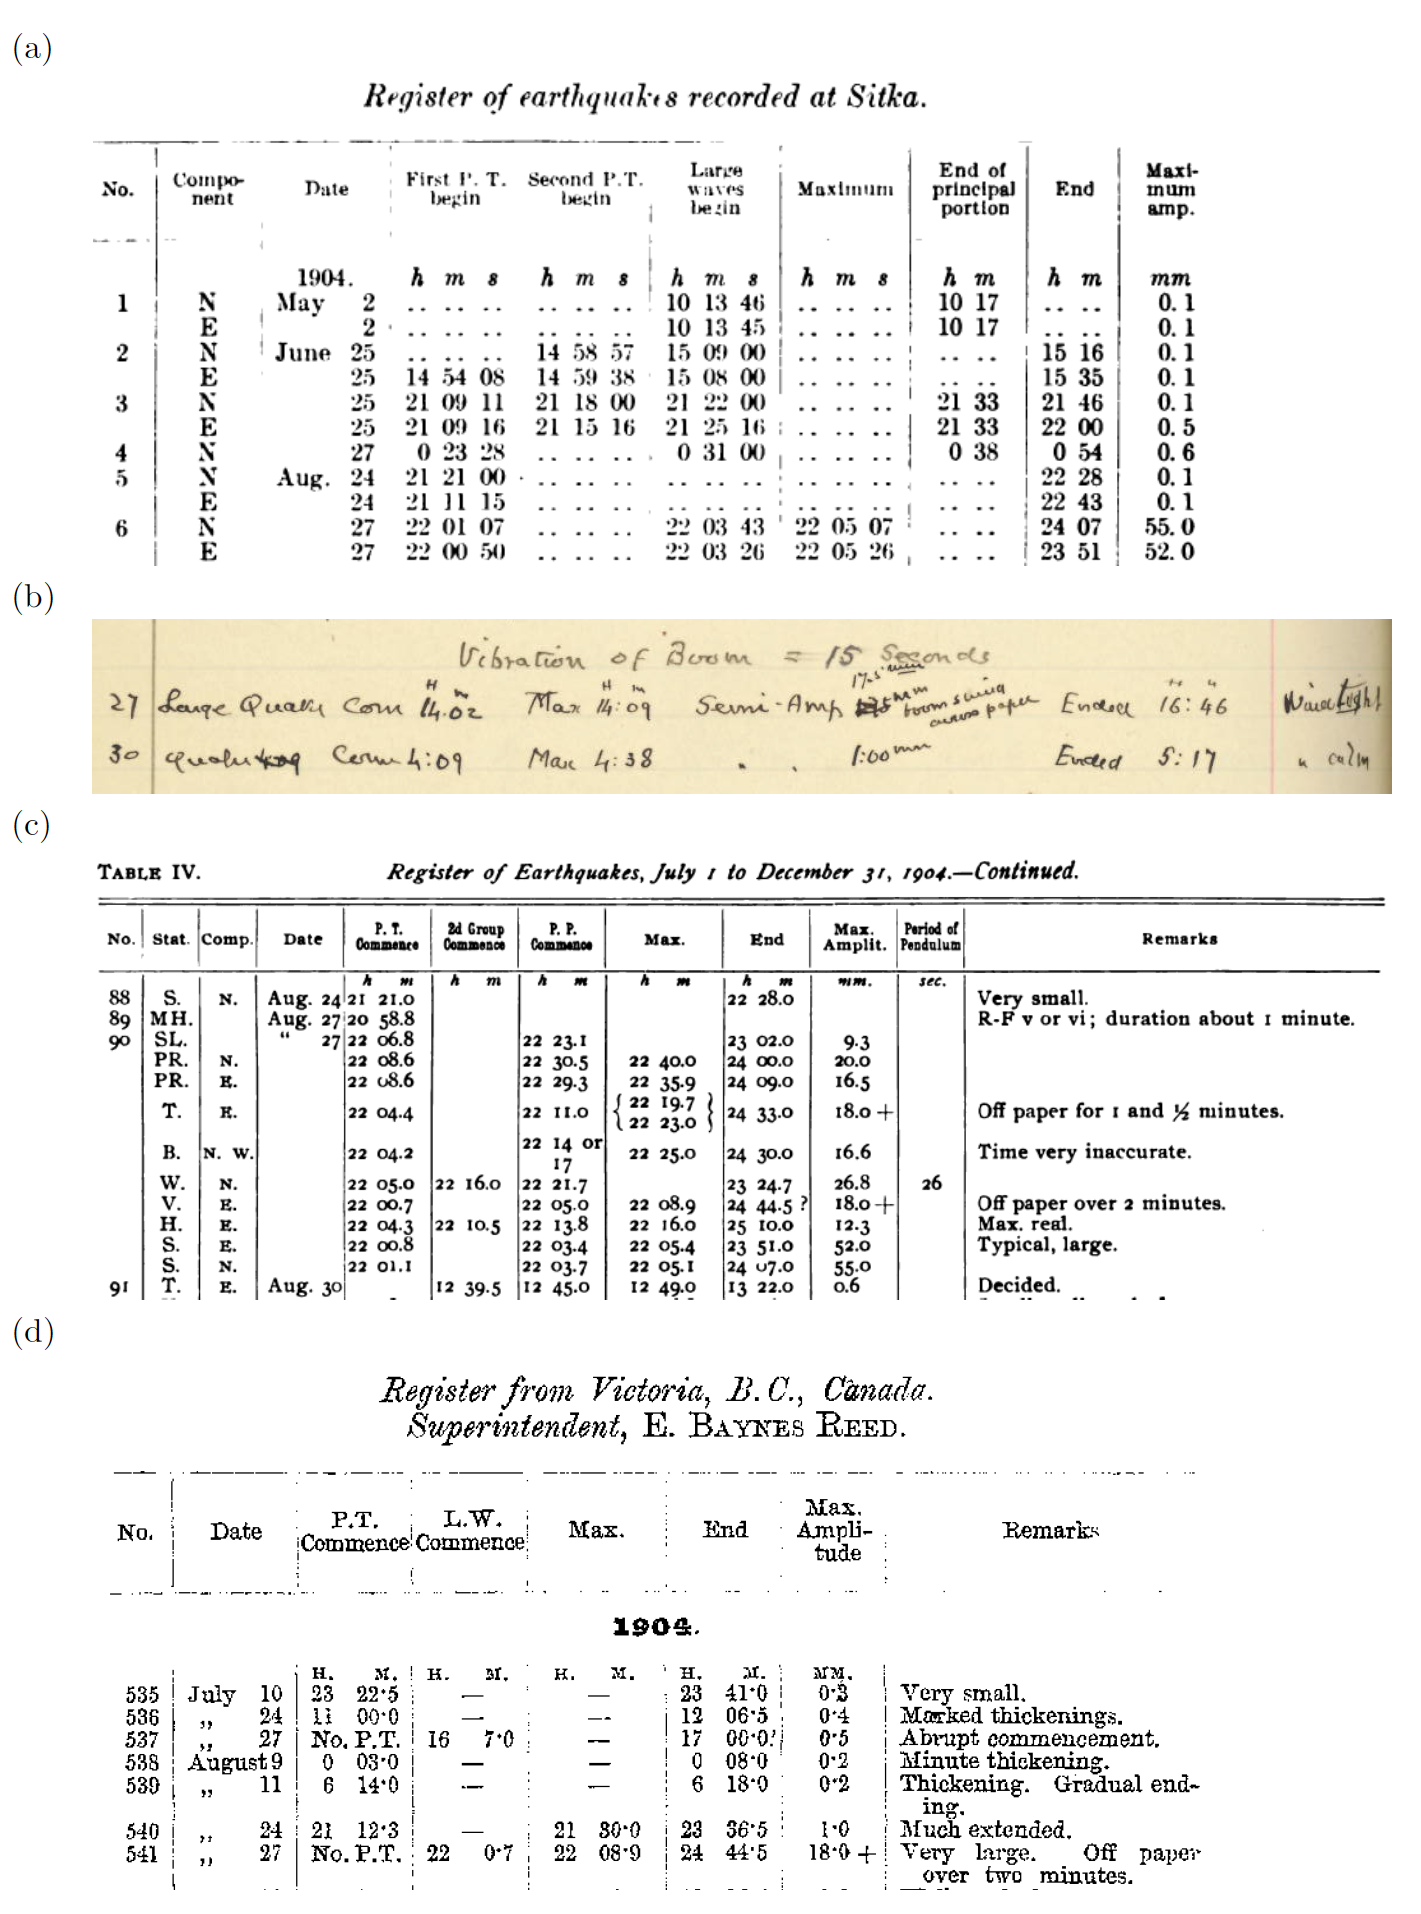
The closest two stations to the earthquake were in Sitka, Alaska, and in Victoria, British Columbia, the registers of which are listed in Figure S1. Arrival times at Sitka and Victoria are summarized in Table S3, which shows some notable discrepancies for Victoria. From the original register (Fig. S1b), it is unclear what the first listed time refers to. Furthermore, the times at Victoria are listed to the nearest minute, giving some indication of the accuracy. Rosenthal (1907) lists the same time as in Reid (1905) for the first arrival (preliminary tremor [P.T.]), yet the Shide register lists “No P.T.” Without knowing anything about the origin time of the earthquake, we would consider the arrival times for Victoria to be suspect.
Two horizontal components recorded the earthquake at Sitka. The published values for the first arrival follow those of Hazard (1910) for the Sitka register: 22:00:50 (east component) and 22:01:07 (north component). It is not immediately obvious that there is any problem with the Sitka arrival time. However, assuming Gutenberg’s origin time, and assuming that the first arrival at Sitka was a P wave, the P-wave travel time to Sitka was 4 min and 44 s, the difference between 22:00:50 and 21:56:06.
One thing we know relatively well is the travel time of P waves from west-central Alaska to Sitka. P travel times from earthquakes in Alaska to Sitka are in general agreement with predictions from 1D Earth models such as ak135. If the recorded first arrival at Sitka was a P wave, and if Gutenberg’s origin time is reliable, then the epicenter would be far off the coast of Alaska in the Arctic Ocean or Bering Sea. We conclude that the first arrival for Sitka is therefore probably an S wave. This type of confusion is not uncommon within the early seismic records and registers.
For a candidate epicenter, near Ruby, Alaska, the estimated P-wave travel times are 2.98 min to Sitka and 5.60 min to Victoria. For the entire plausible source region, the P wave at Victoria will arrive 2.5–2.6 min later than the P wave at Sitka. Yet the authoritative listing of Rosenthal (1907) has an earlier arrival at Victoria than at Sitka (Table S3). We conclude that the arrival times for Sitka and Victoria are both suspect.
The data obtained from ISC (Table S1) assign S with the 22:00:50 arrival time at SIT and P with the 22:00:42 (22:00.7) arrival time at VIC. With these phase assignments, SIT and VIC are not large outliers. It turns out that—regardless of the original phase assignment—SIT and VIC do not significantly impact the estimation of the epicenter, in part because of the data coverage (Fig. 8 in the main article; 45 total stations) and in part because our estimation approach, using NLL, is designed to allow for large outliers.
The NLL-equal differential time (EDT) relocation procedure we use here is developed to be robust while automatically handling potentially very poor quality historical bulletin observations. The robustness of the NLL-EDT formulation to outliers allows observations with large errors to be effectively removed from the solution. In addition, iteratively relocation allows identification and correction or removal of observations with potentially large error through:
Iteration ends when there are no further modifications to the observations from the previous relocation.
For the 1904 and 1935 relocations presented here, iteration gave only minor changes and improvements to the results. For the 1904 event, only one iteration was required, with a few timing corrections and zero weights applied, but no (P↔S) phase-type changes applied (Table S1). For the 1935 Alaska event, two relocation iterations were required, with some timing corrections and zero weights applied and again no phase-type changes (Table S2). Even without applying any timing corrections or changing any weights, the probability density functions (PDFs) for the 1935 and 1904 events are only slightly shifted and broader than those presented in Figure 9 in the main article. The weights column in Tables S1 and S2 are posterior weights that indicate how much the phase contributed to the EDT solution at the maximum-likelihood hypocenter.
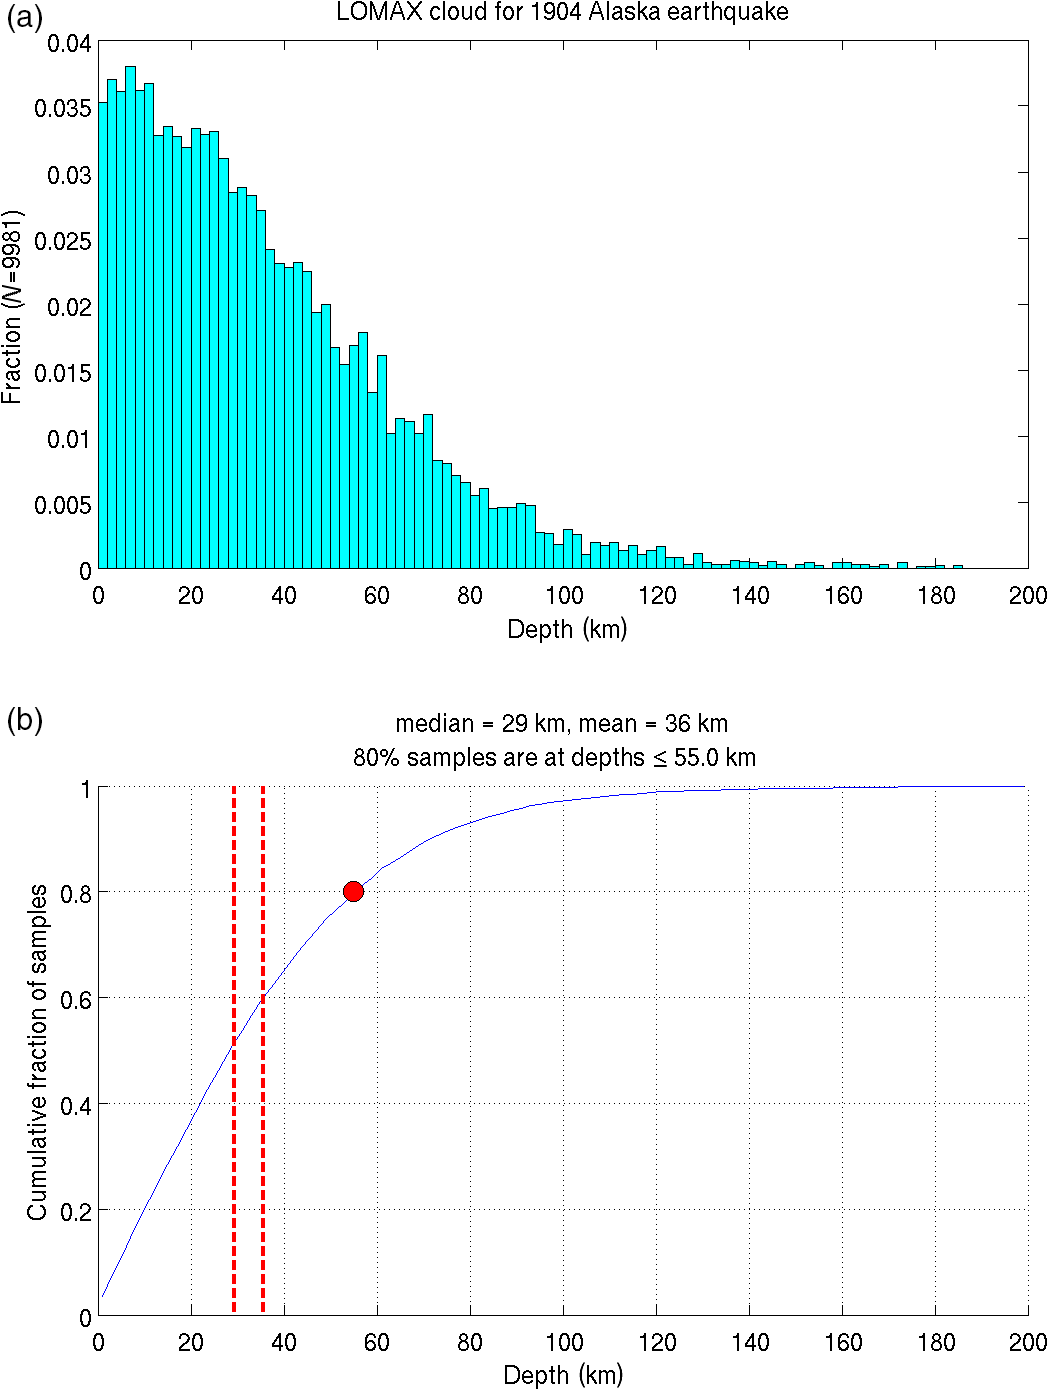
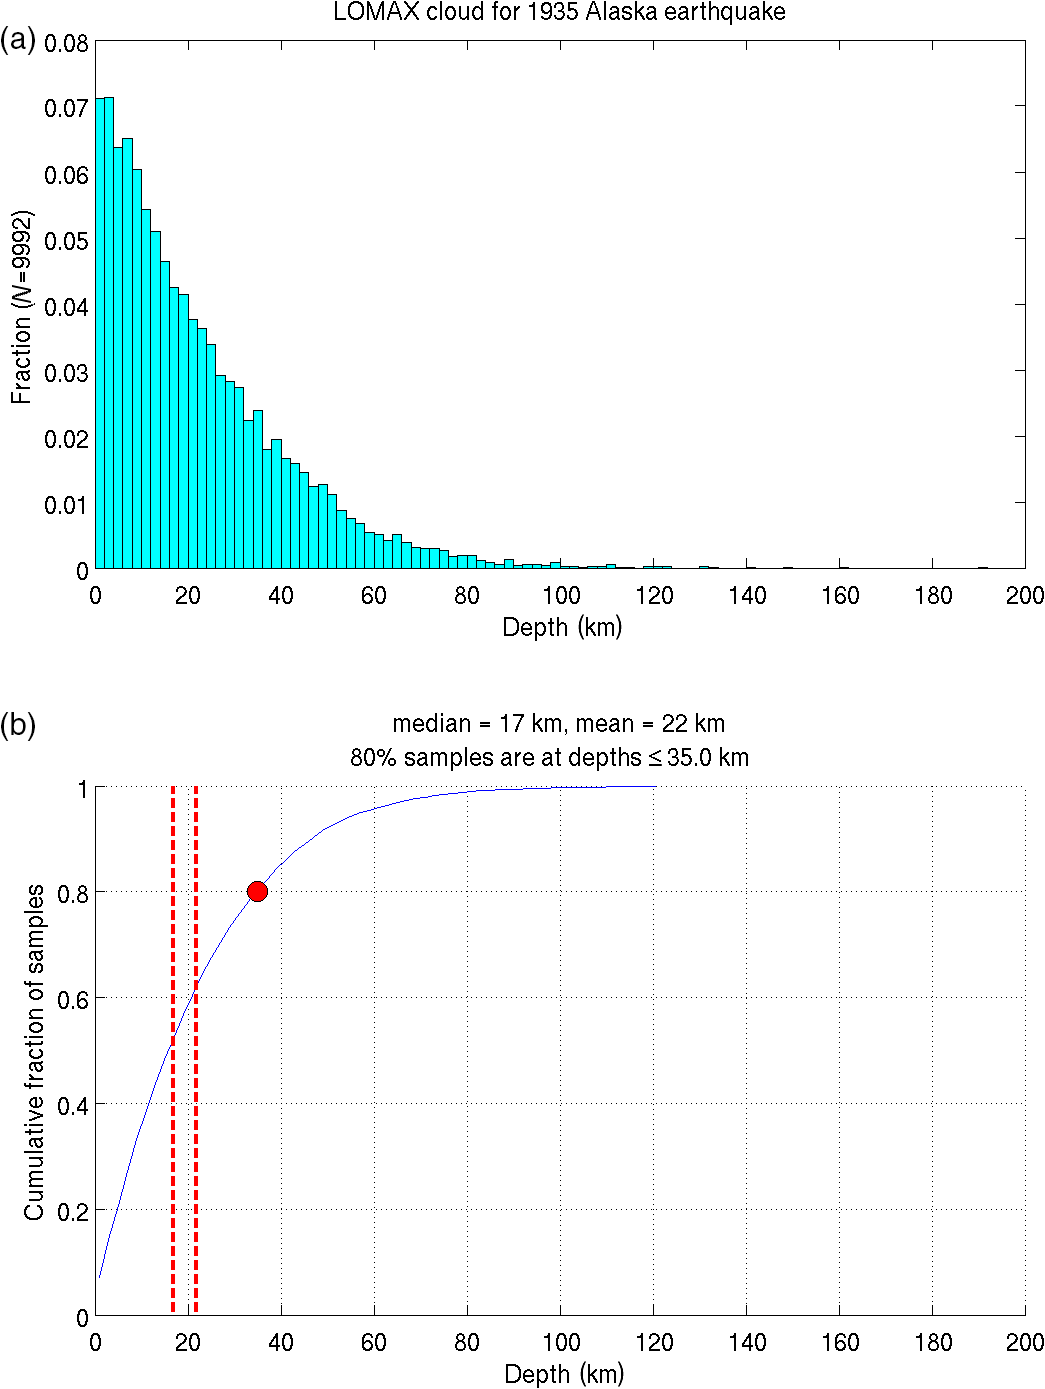
For the 1904 earthquake, Figure S2 shows the distribution of depths for the posterior samples; the distribution implies a crustal origin for the earthquake. A similar pattern is apparent for the 1935 earthquake (Fig. S3).
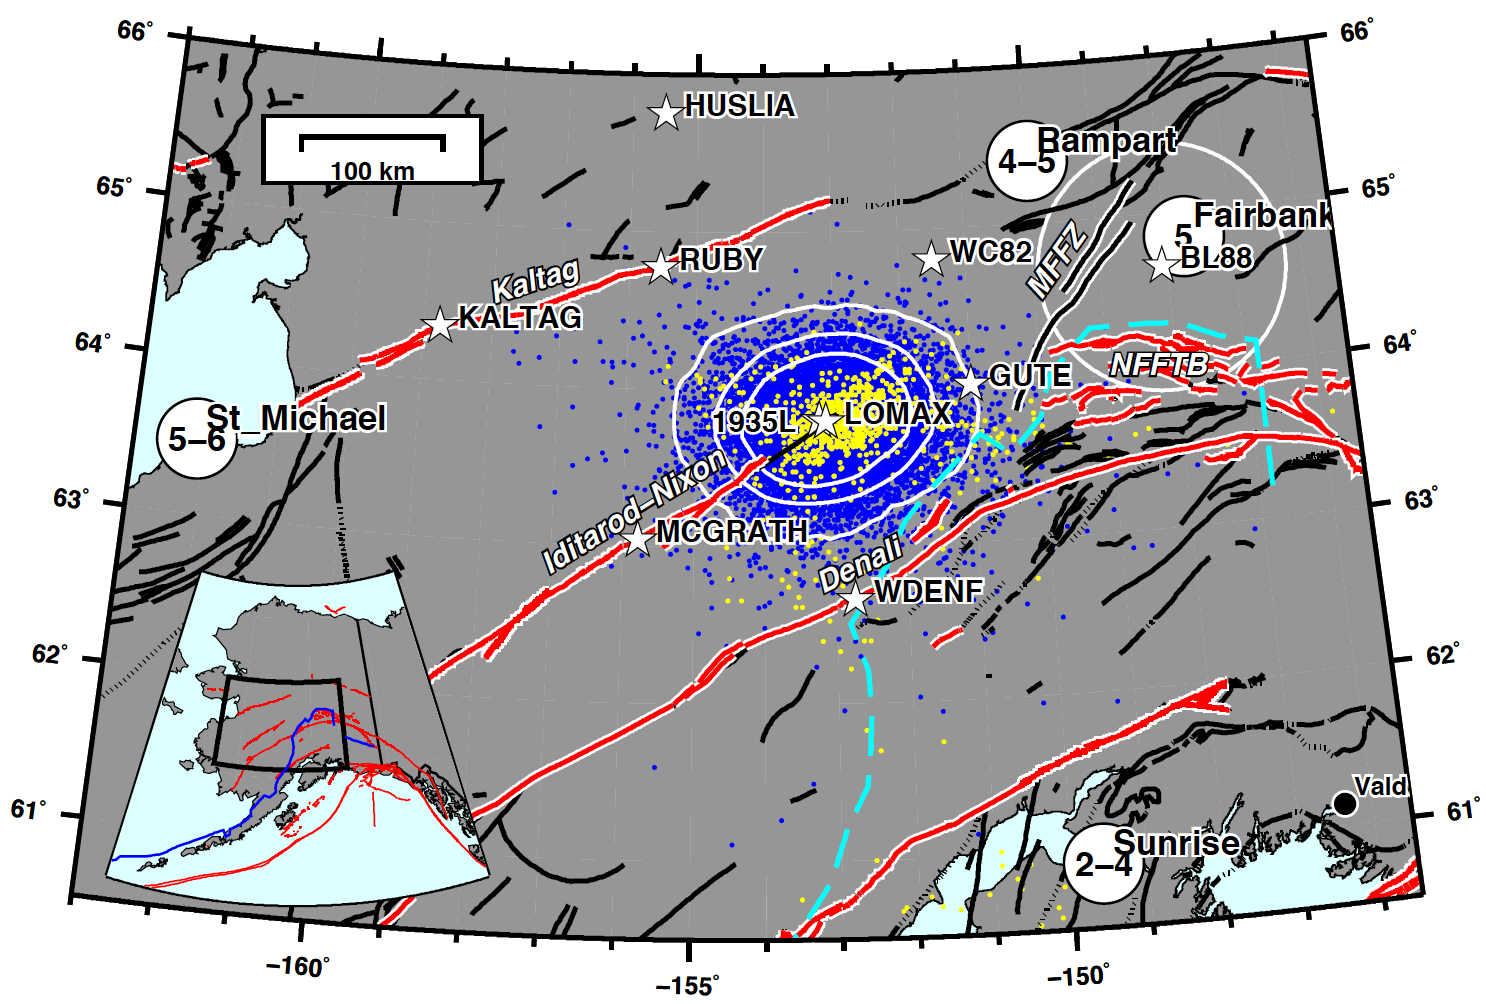
Figures S4 and S5 illustrate two approaches that we used to determine the stability of our results. Figure S4 shows NLL-EDT relocation using 1000 randomly sampled data sets, each with about 50%–80% of the 57 available, nonzero weight observations defined in the final 1904 iteration (Table S1). Yellow dots show the maximum-likelihood solution for each data subset. The vast majority of these solutions remain inside the full solution PDF (also in depth), and they also follow the general form of the PDF. This indicates that the full solution PDF gives a fairly complete representation of possible solutions with the available data and data uncertainty model, and that this solution is not biased by erroneous data.
Besides Victoria and Sitka, there were no stations within 40° of the 1904 epicenter (Table S1). For our purposes, we will use the term “regional” to refer to stations with epicentral distances Δ < 40°. We perform an analysis of historical and modern earthquakes to quantify the influence of not having stations at regional distances. We consider all events M ≥ 6 in the ISC Bulletin within 350 km of (–154°; 64°) from 1900 to 2016. There are 38 events in total, 29 of which had arrival times in the ISC database. For each of the 29 earthquakes, we perform two inversions: one with all stations and one excluding regional stations.
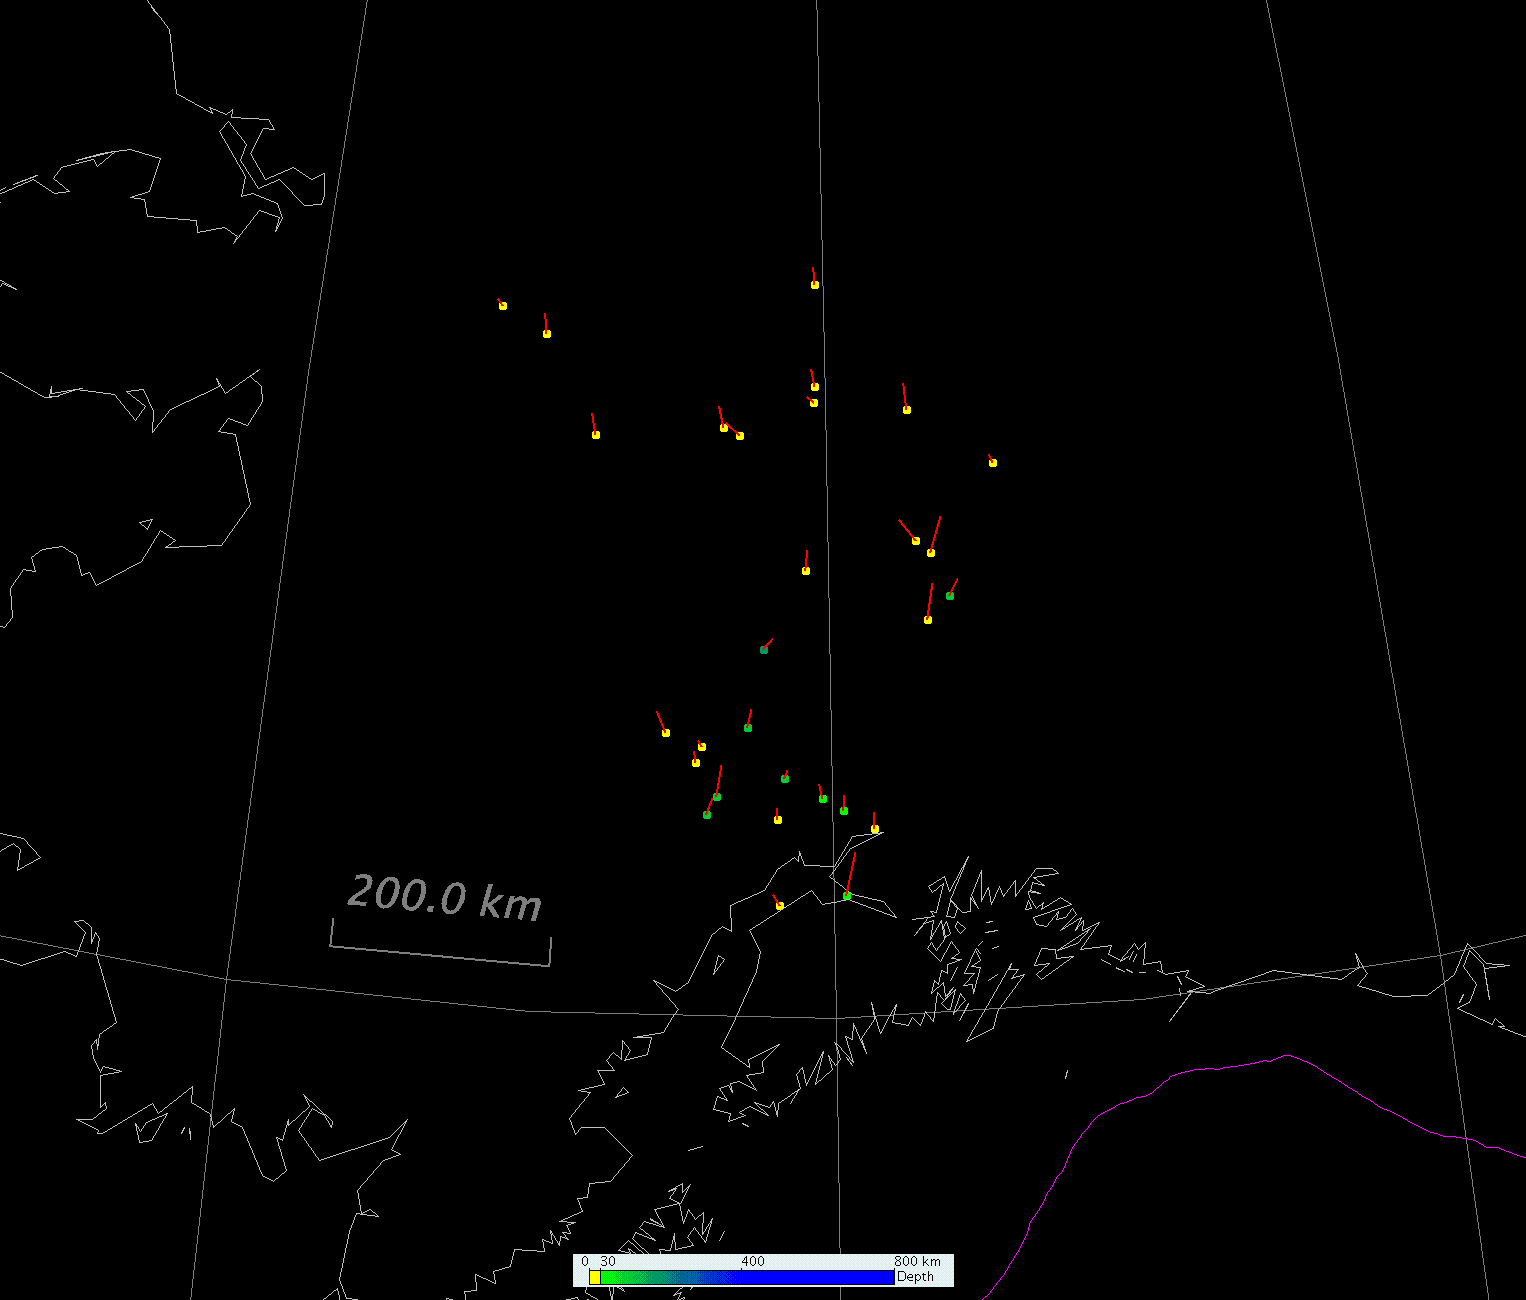
Figure S5 shows the influence of excluding regional stations in estimating the epicenter for earthquakes in central Alaska. We find that the exclusion of regional stations leads to a southerly shift of the estimated epicenter by 5–40 km with a mean of 17 km. We speculate that the shift is caused by perturbations to rays leaving the source by local 3D structure, an effect which may be particularly strong in this region due to the underlying subducting slab (e.g., Wang and Tape, 2014; see Fig. 9a in the main article for the location of the seismically active slab relative to the 1904 epicentral region). Additional wavefield modeling would be needed to explain the shifts shown in Figure S5.
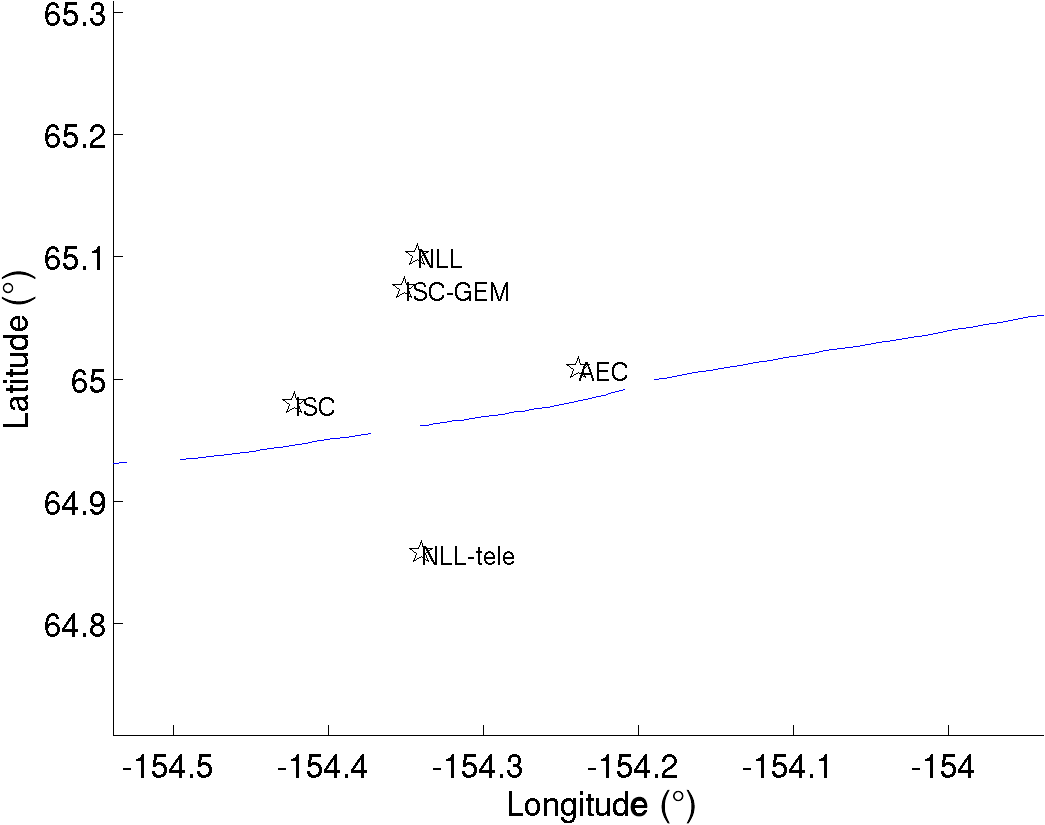
Figure S6 shows a zoom-in on one of the earthquakes in Figure S5, an Mw 5.8 on the Kaltag fault. The figure shows that the NLL epicenter and ISC-GEM epicenter—both based on global arrival times—are very close to each other (3 km). When excluding the regional stations, the NLL epicenter shifts southward by 27 km.
Table S1. Arrival-time data used to estimate the epicenter of the 1904-08-27 earthquake (ISC).
Table S2. Arrival-time data used to estimate the epicenter of the 4 September 1935 earthquake. The times and phases are from the ISC-GEM supplementary catalog (Storchak et al., 2013).
Table S3. Summary of arrival times for the two closest stations—Sitka, Alaska, and Victoria, British Columbia—to the 1904 Alaska earthquake.
Figure S1. Station registers for Sitka, Alaska, United States, and Victoria, British Columbia, Canada. (a) Sitka register (Hazard, 1910); (b) Victoria register (Denison, 1904); (c) Reid tabulation (Reid, 1905), including Sitka (S.) and Victoria (V.); and (d) Shide register for Victoria (Judd and Milne, 1905).
Figure S2. Distribution of depths for 9981 samples of the posterior probability for the 1904 Alaska earthquake. (a) Histogram of depths and (b) cumulative distribution of depths. Dashed lines denote the median depth (29 km) and the mean depth (36 km). The dot indicates that 80% of the samples are above the depth of 55 km. The maximum-likelihood hypocenter has a depth of 6.5 km.
Figure S3. Distribution of depths for 9992 samples of the posterior probability for the 1935 Alaska earthquake. (a) Histogram of depths and (b) cumulative distribution of depths. Dashed lines denote the median depth (17 km) and the mean depth (22 km). The dot indicates that 80% of the samples are above the depth of 35 km. The maximum-likelihood hypocenter has a depth of 0.7 km.
Figure S4. Epicenter (star with LOMAX), samples of the posterior probability distribution (blue), and 1000 maximum-likelihood epicenters (yellow) from a bootstrap analysis. Each maximum-likelihood epicenter is from an NLL relocation using a random resampling of arrival times. For other details, see caption of Figure 9a in the main article.
Figure S5. Southward shift of epicenters, likely due to 3D structure effects. The 29 events considered are all M ≥ 6 events in the ISC Bulletin that are near the 1904 epicentral region. The dots represent the NLL estimated location when excluding time picks from stations at regional distances (Δ < 40°). The other end of the line segment represents the NLL estimated location when including stations at regional distances. Excluding the regional time picks leads to a systematic southward shift of 5–40 km (mean 17 km).
Figure S6. Estimated epicenters for the 3 February 2000 Kaltag earthquake, which is one of the events shown in Figure S5. NLL, NonLinLoc using all data; NLL-tele, NonLinLoc using stations Δ ≥ 40°; AEC, Alaska Earthquake Center; ISC, ISC Bulletin catalog (International Seismological Centre, 2013); ISC-GEM, ISC-GEM catalog (Storchak et al., 2013). The distance between NLL and NLL-tele is 27 km. The plotted fault is the Kaltag fault from Koehler et al. (2012). All epicenters are within 15 km of the mapped Kaltag fault; AEC is 2.7 km from the fault.
Denison, F. N. (1904). Seismic Station Register, Victoria, British Columbia, Canada, Geological Survey of Canada, Sidney, British Columbia, Government of Canada.
Hazard, D. L. (1910). Earthquakes, in Results of Observations Made at the Coast and Geodetic Survey Magnetic Observatory at Sitka, Alaska, 1905–1906, U.S. Department of Commerce and Labor, Coast and Geodetic Survey, Washington, D.C., 92–94.
International Seismological Centre (ISC) (2013). On-line Bulletin, International Seismological Centre, Thatcham, United Kingdom, available at http://www.isc.ac.uk (last accessed October 2016).
Judd, J. W., and J. Milne (1905). British Association for the Advancement of Science, Circular no. 11, Newport, Isle of Wight (also 321–348 of Vol. 2).
Koehler, R. D., R.-E. Farrell, P. A. C. Burns, and R. A. Combelick (2012). Quaternary faults and folds in Alaska: A digital database, Alaska Div. Geol. Geophys. Surv. Misc. Publ. 141, 31 pp., 1 sheet, scale 1:3,700,000.
Lomax, A., A. Michelini, and A. Curtis (2014). Earthquake location, direct, global-search methods, in Encyclopedia of Complexity and System Science, R. A. Meyers (Editor), Second Ed., Springer, New York, New York, 1–33.
Lomax, A., J. Virieux, P. Volant, and C. Berge (2000). Probabilistic earthquake location in 3D and layered models: Introduction of a Metropolis–Gibbs method and comparison with linear locations, in Advances in Seismic Event Location, C. H. Thurber and N. Rabinowitz (Editors), Kluwer, Amsterdam, The Netherlands, 101–134.
Reid, H. F. (1905). Records of seismographs in North America and the Hawaiian Islands. no. II, Terr. Magn. Atmos. Electr. 10, no. 4, 177–189.
Rosenthal, E. (1907). Katalog der im Jahre 1904 Registrierten Seismischen Storungen, Veroffentlichungen des Zentral-Bureaus der Internationalen Seismologischen Assoziation, Serie B. Kataloge, Strassburg (in German).
Schweitzer, J., and W. H. K. Lee (2003). Old seismic bulletins to 1920: A collective heritage from early seismologists, in International Handbook of Earthquake and Engineering Seismology, Vol. 81B, W. H. K. Lee, H. Kanamori, P. C. Jennings, and C. Kisslinger (Editors), International Geophysics Series, Academic Press, 1665–1723.
Storchak, D. A., D. Di Giacomo, I. Bondár, E. R. Engdahl, J. Harris, W. H. K. Lee, A. Villasenor, and P. Bormann (2013). Public release of the ISC-GEM Global Instrumental Earthquake Catalogue (1900–2009), Seismol. Res. Lett. 84, no. 5, 810–815, doi: 10.1785/0220130034.
Wang, Y., and C. Tape (2014). Seismic velocity structure and anisotropy of the Alaska subduction zone derived from surface wave tomography, J. Geophys. Res. 119, 8845–8865, doi: 10.1002/2014JB011438.
[ Back ]