This electronic supplement contains seven tables (Tables S1–S7) and six figures (Figs. S1–S6). Table S1 presents the list of stations used in the main article. The other six tables give peak ground acceleration (PGA), peak ground velocity (PGV), and peak ground displacement (PGD) values in the Indo-Gangetic Plains (IGP) during the mainshock and five of the largest aftershocks. Figures present the spectral ratios of the mainshock and some aftershocks (Figs. S1 and S2); band-pass-filtered PGA, PGV, and PGD values of the Mw 7.9 mainshock and Mw 7.2 aftershock 3 (Fig. S3); residuals for the model as a function of Mw (Fig. S4) and Rrup (Fig. S5); and comparison of ±2σ interval predictions of PGA for the proposed model and an alternative one ignoring the mainshock data (Fig. S6).
Table S1. Location of Indian Institute of Technology, Roorkee (IITR) stations in the IGP which recorded one or more of the events of the Gorkha earthquake sequence.
Table S2. PGA, PGV, and PGD in the IGP during the 25 April 2015 Mw 7.9 Gorkha, Nepal, earthquake recorded by Central Indo-Gangetic Network (CIGN) and IITR network.
Table S3. PGA, PGV, and PGD in the IGP during the 25 April 2015 Mw 6.7 Gorkha, Nepal, aftershock recorded by CIGN and IITR network.
Table S4. PGA, PGV, and PGD in the IGP during the 26 April 2015 Mw 6.7 Gorkha, Nepal, aftershock recorded by CIGN and IITR network.
Table S5. PGA, PGV, and PGD in the IGP during the 12 May 2015 Mw 7.2 Gorkha, Nepal, aftershock recorded by CIGN and IITR network.
Table S6. PGA and PGV in the IGP during the 12 May 2015 Mw 6.2 Gorkha, Nepal, aftershock recorded by CIGN and IITR network.
Table S7. PGA, PGV, and PGD in the IGP during the 16 May 2015 Mw 5.3 Gorkha, Nepal, aftershock recorded by CIGN and IITR network.
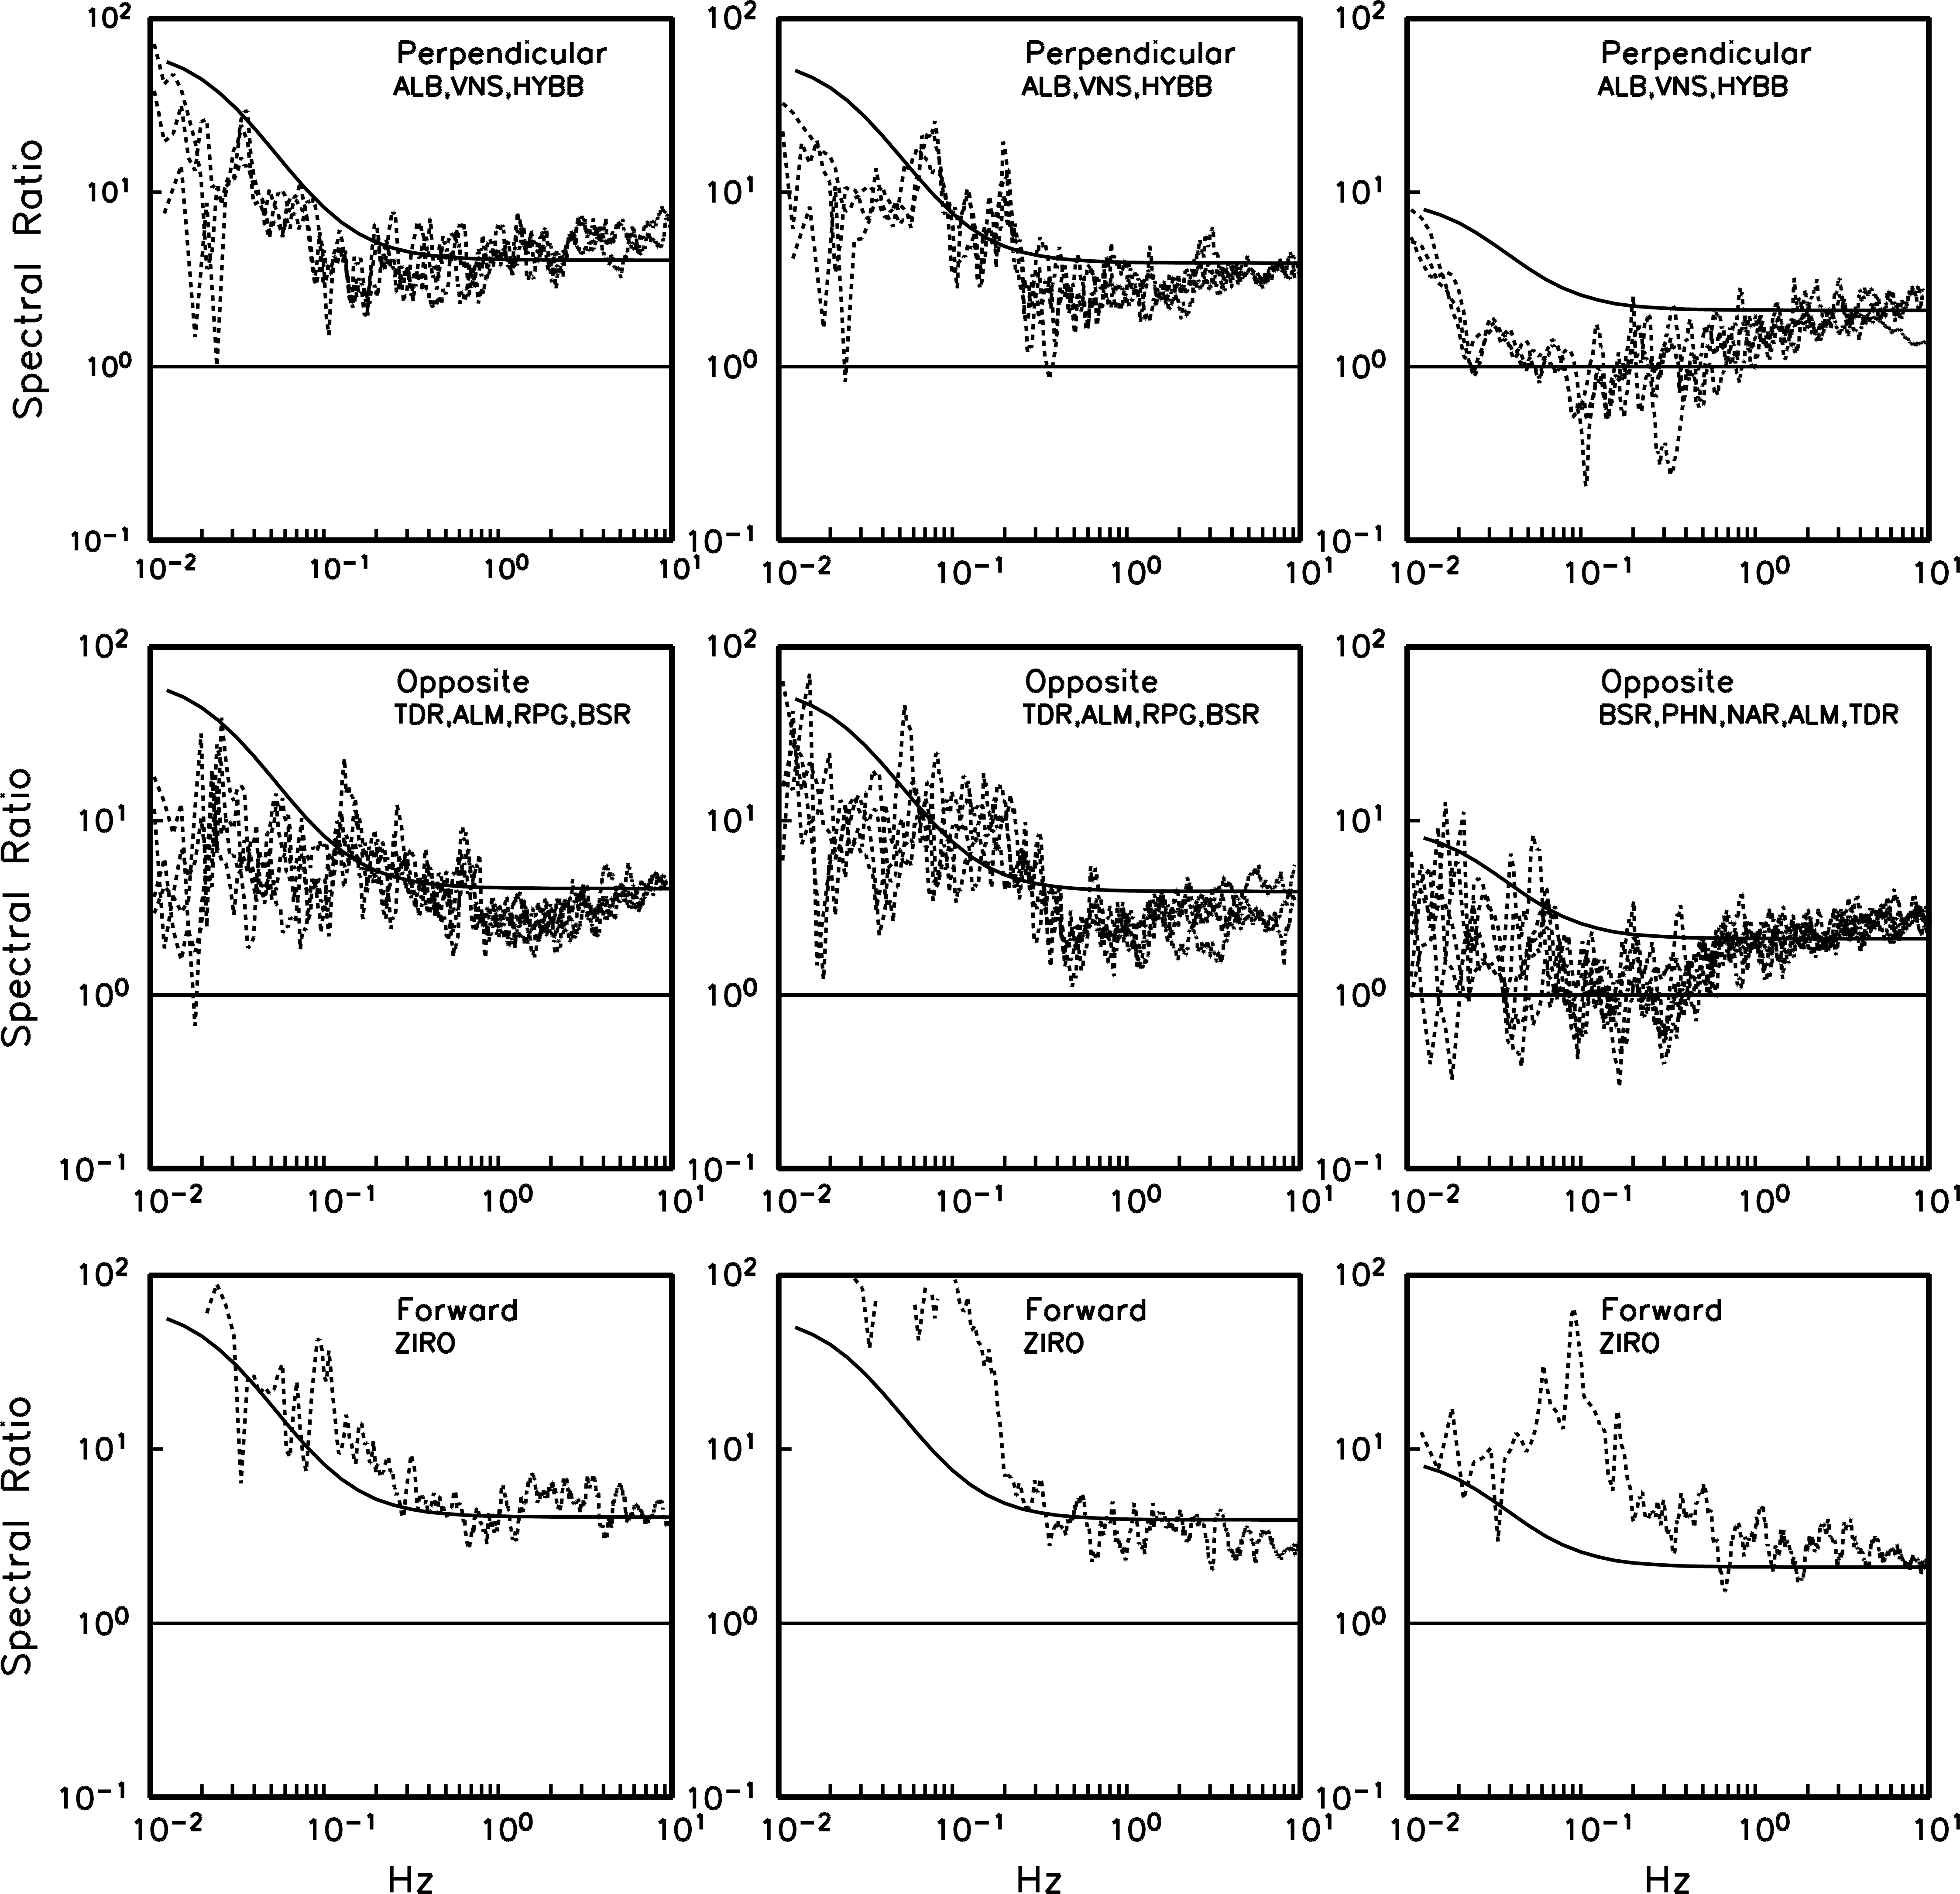
Figure S1. Spectral ratios of mainshock to aftershocks 1 (left column), 2 (central column), and 3 (right column) (Table 1 in the main article) at individual stations (dashed lines). Top frames: Stations perpendicular to the rupture direction. Middle frames: Stations opposite to the rupture direction. Bottom frames: Stations in the direction of rupture. For reference, spectral ratios for the Brune ω−2 source model with constant stress drop of 3 MPa are shown by continuous curves.
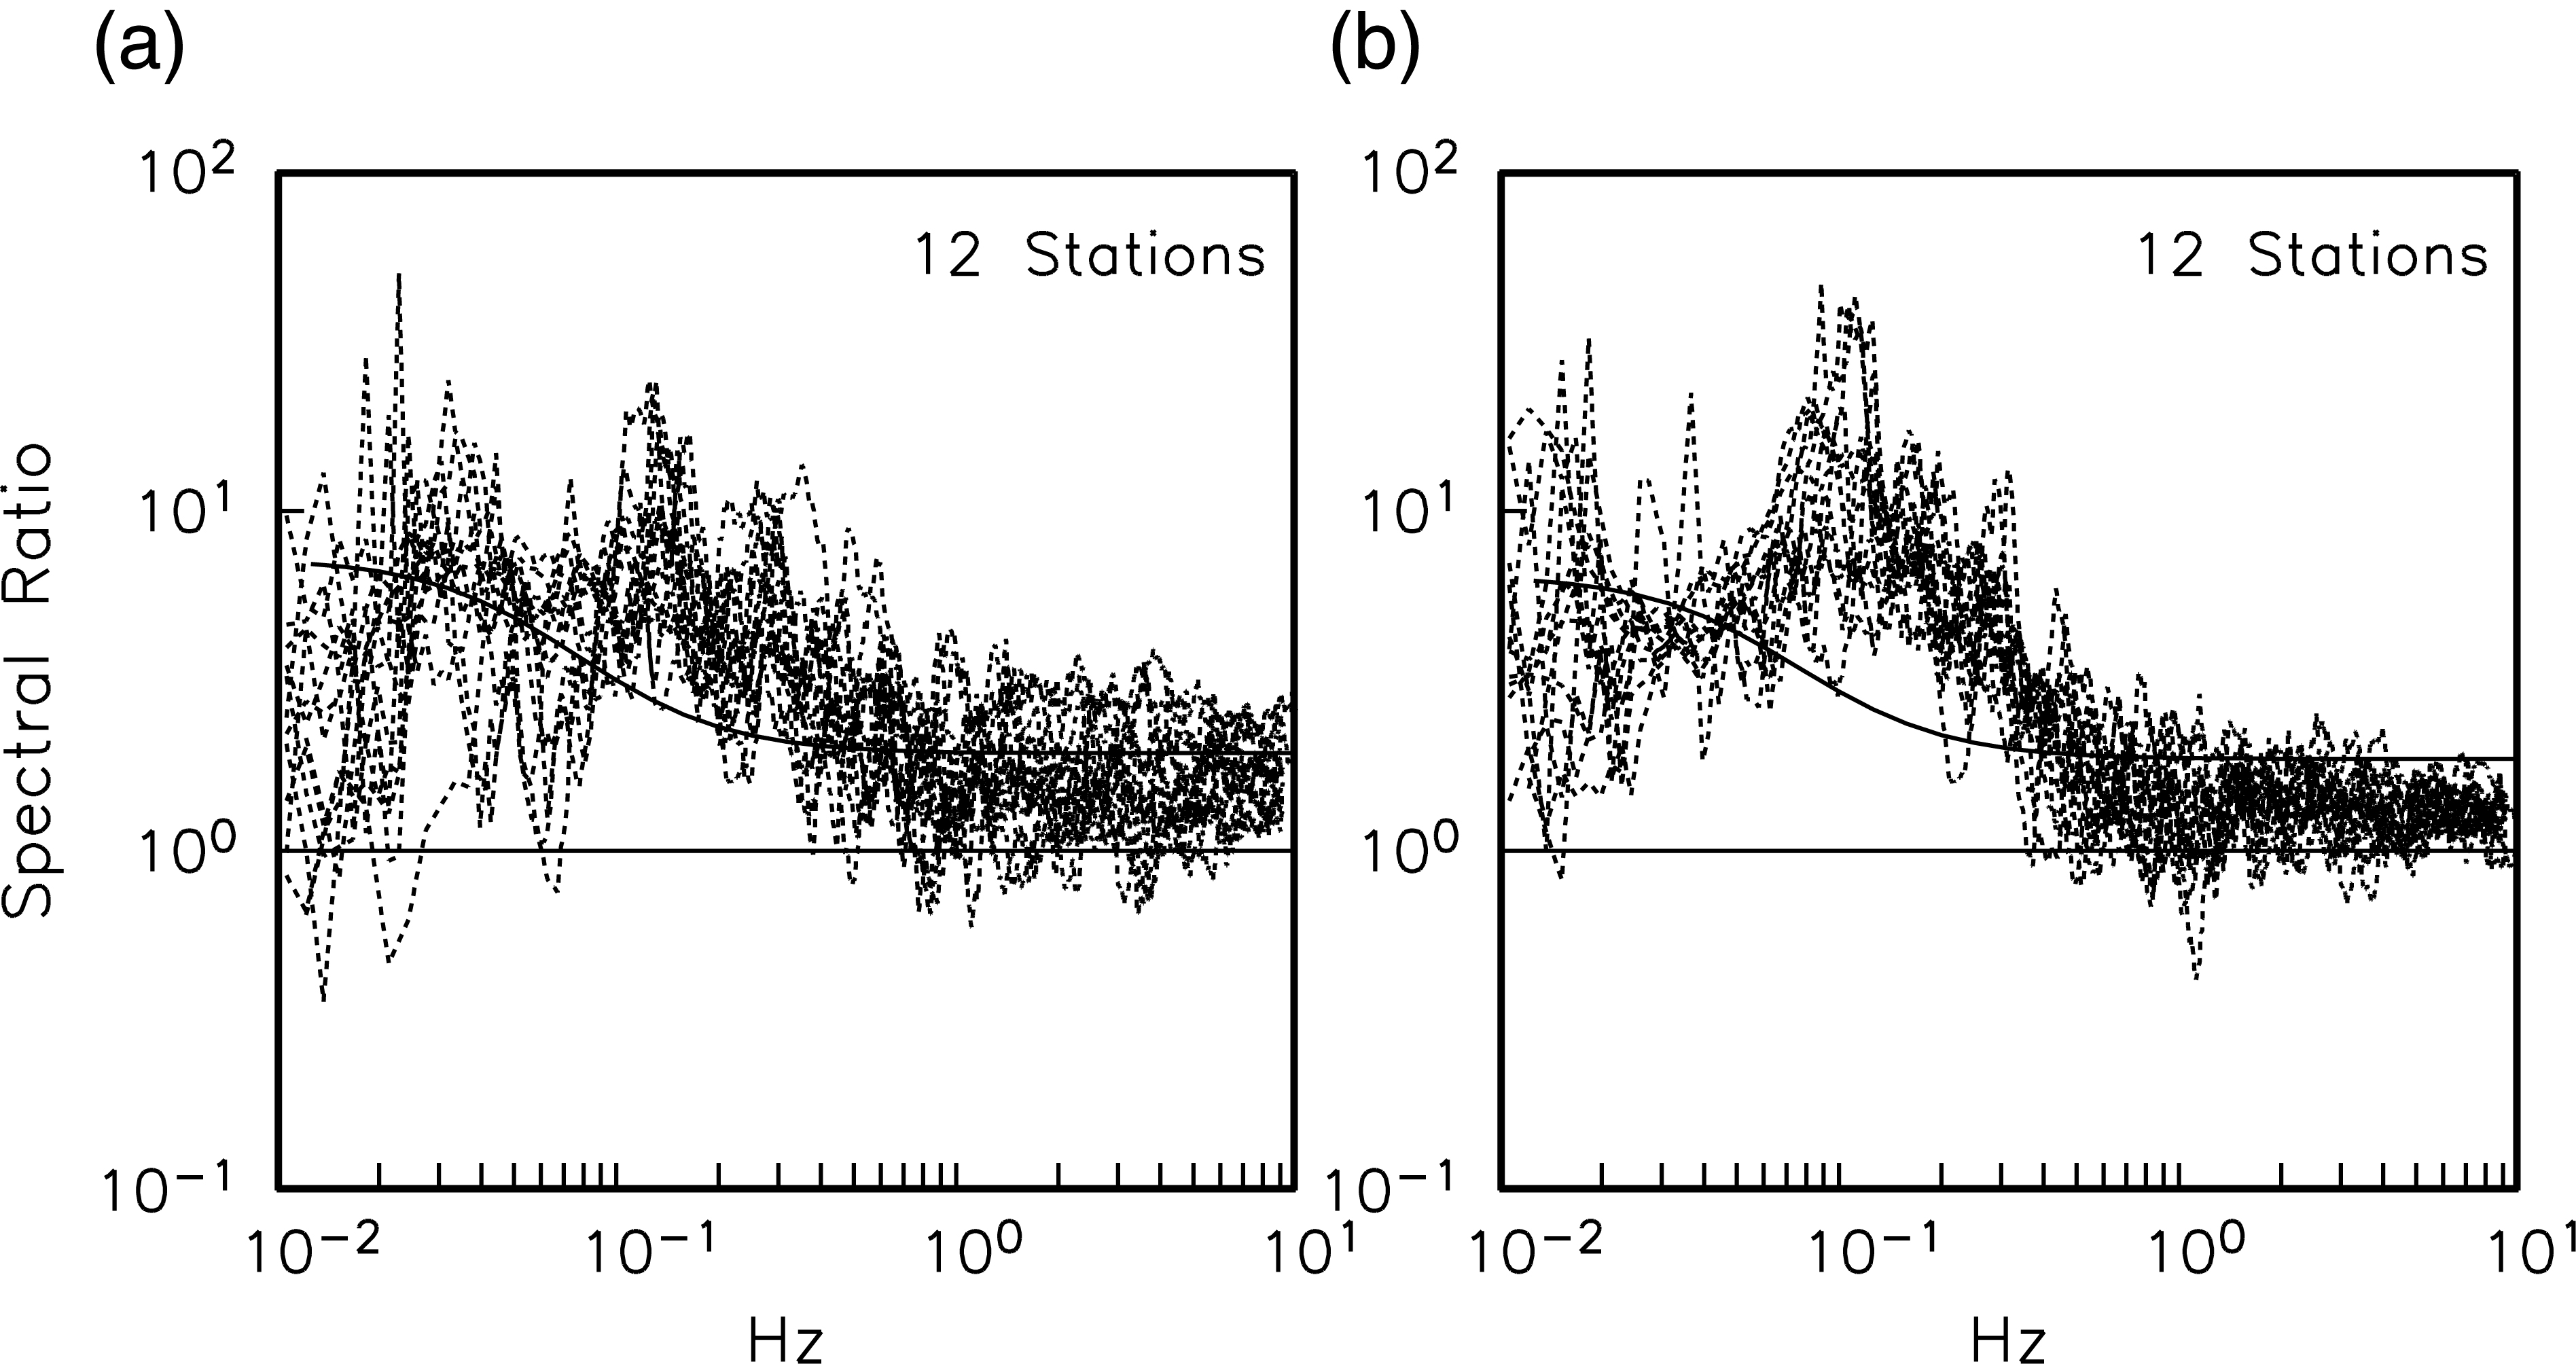
Figure S2. Spectral ratios of the Mw 7.2 aftershock 3 to (a) the Mw 6.7 aftershock 1 and (b) the Mw 6.7 aftershock 2 at individual stations (dashed curves). For reference, spectral ratios for the Brune ω−2 source model with constant stress drop of 3 MPa are shown by continuous curves.
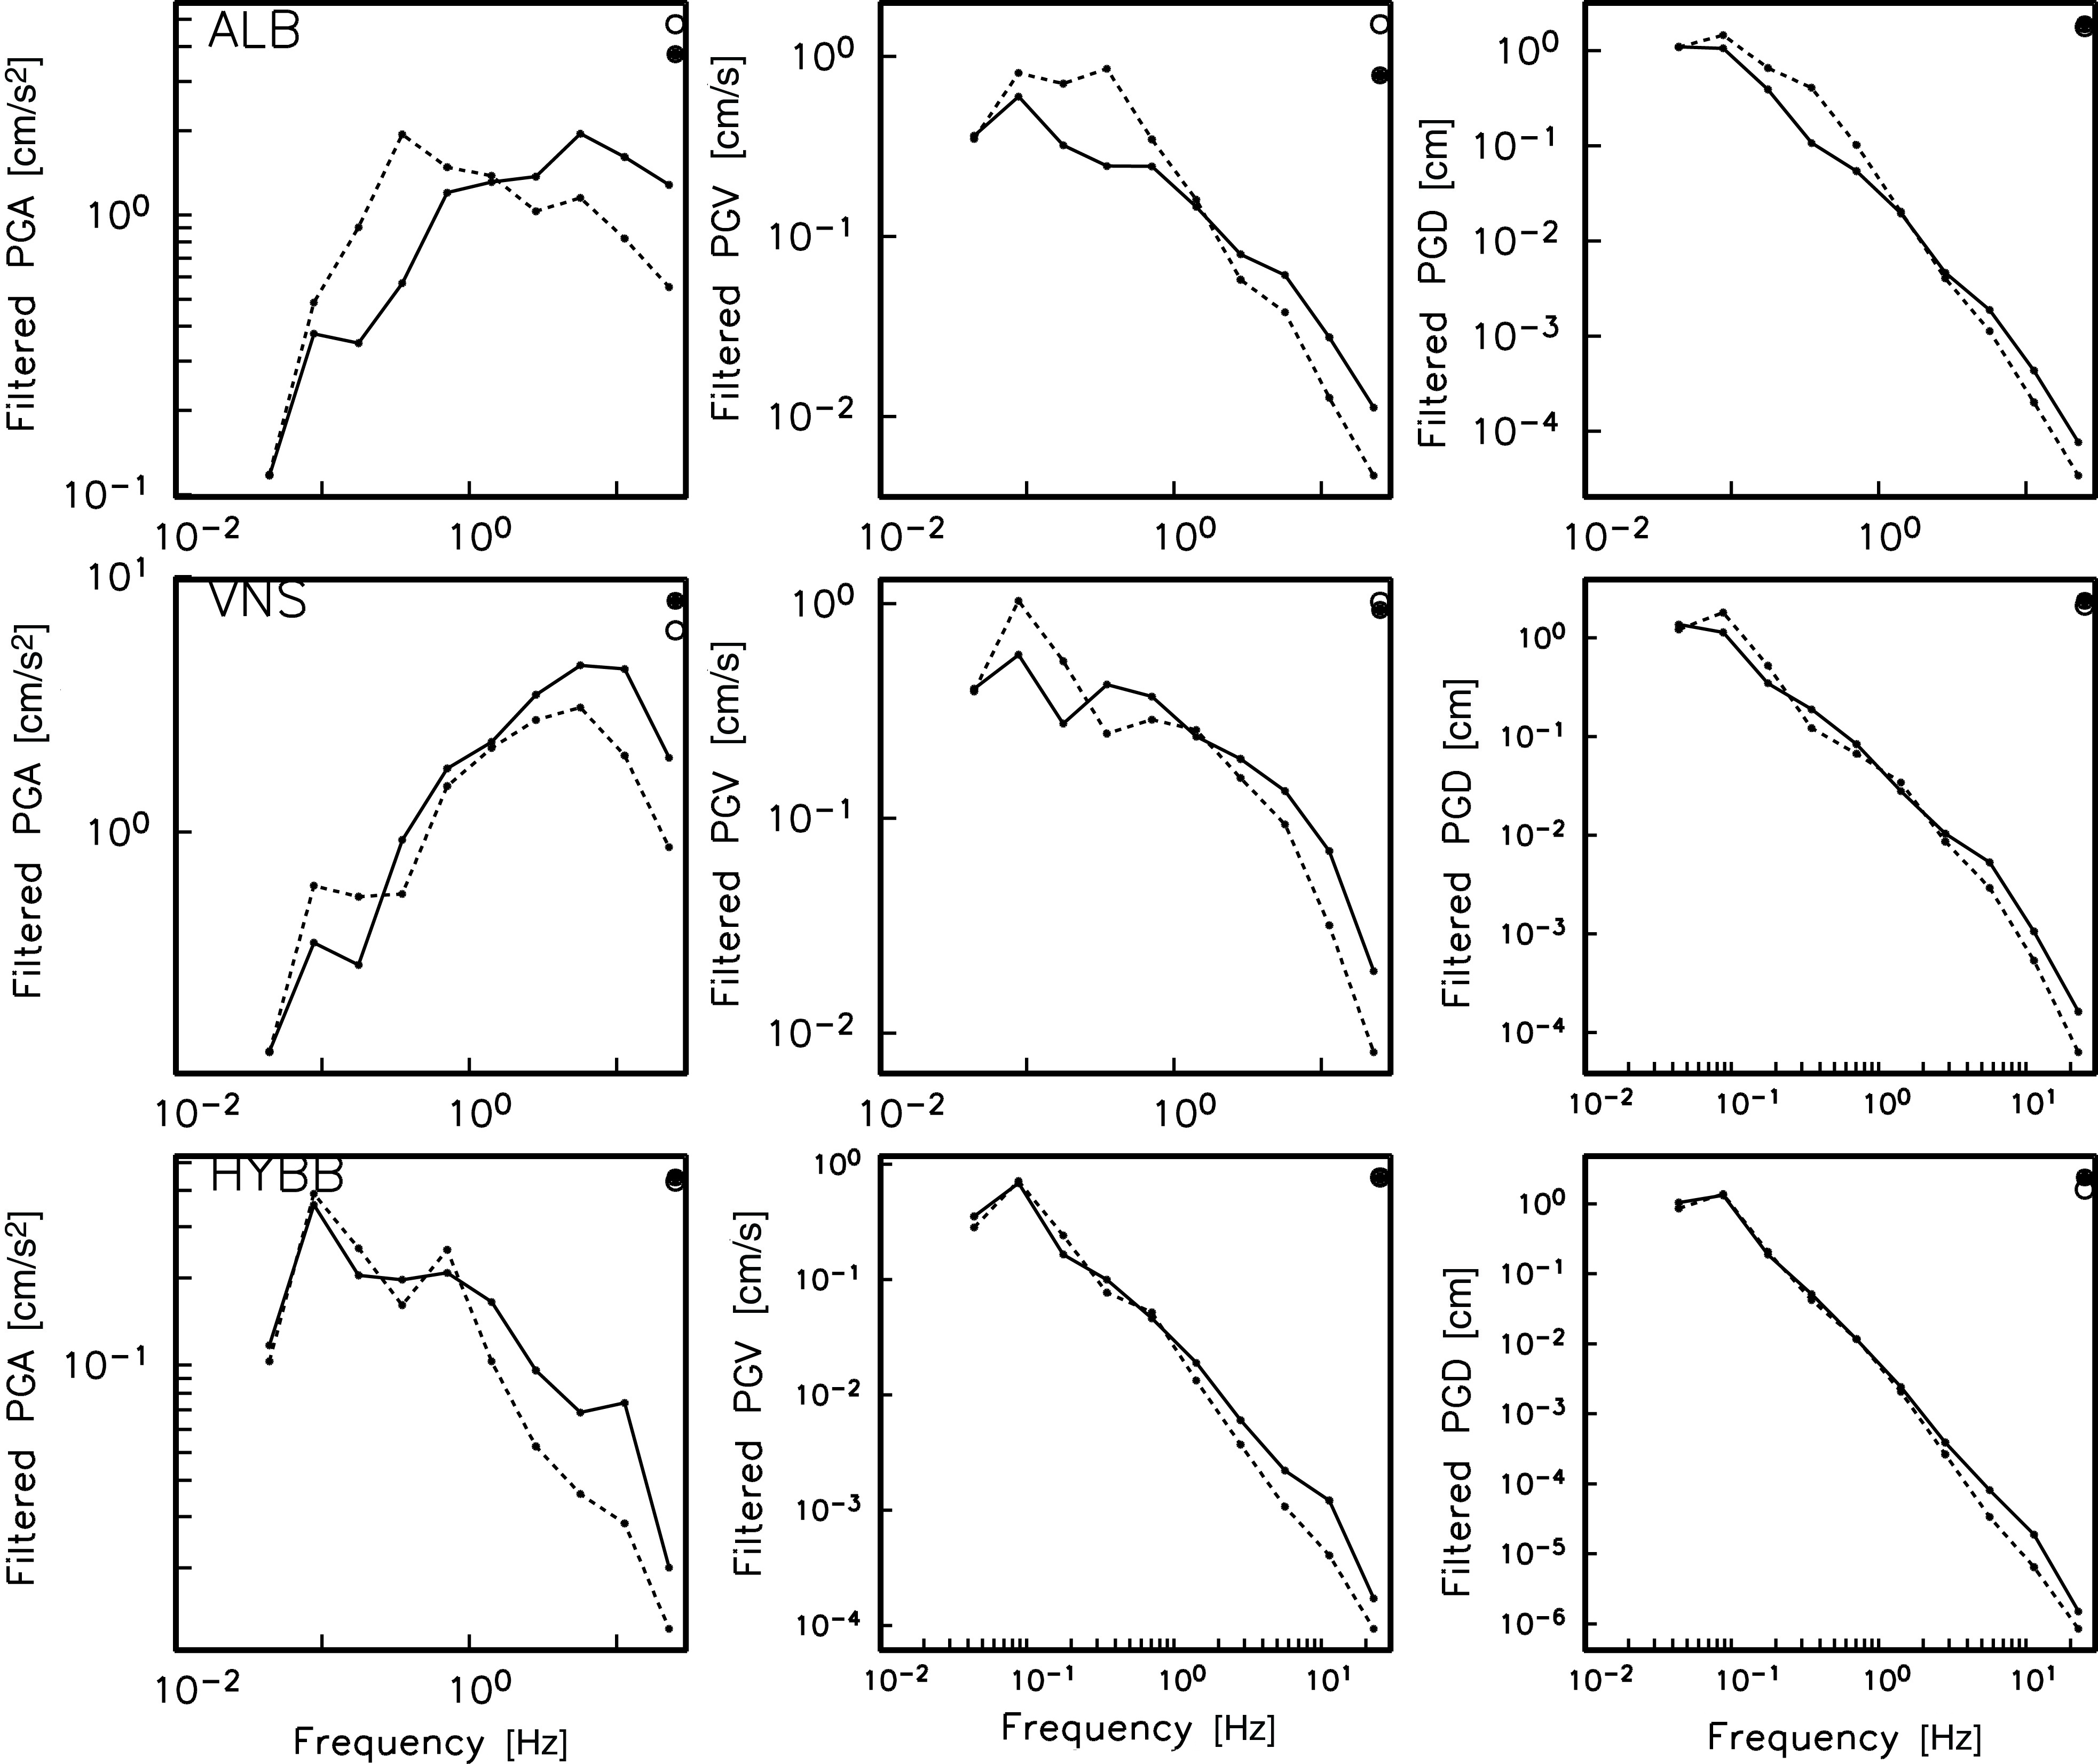
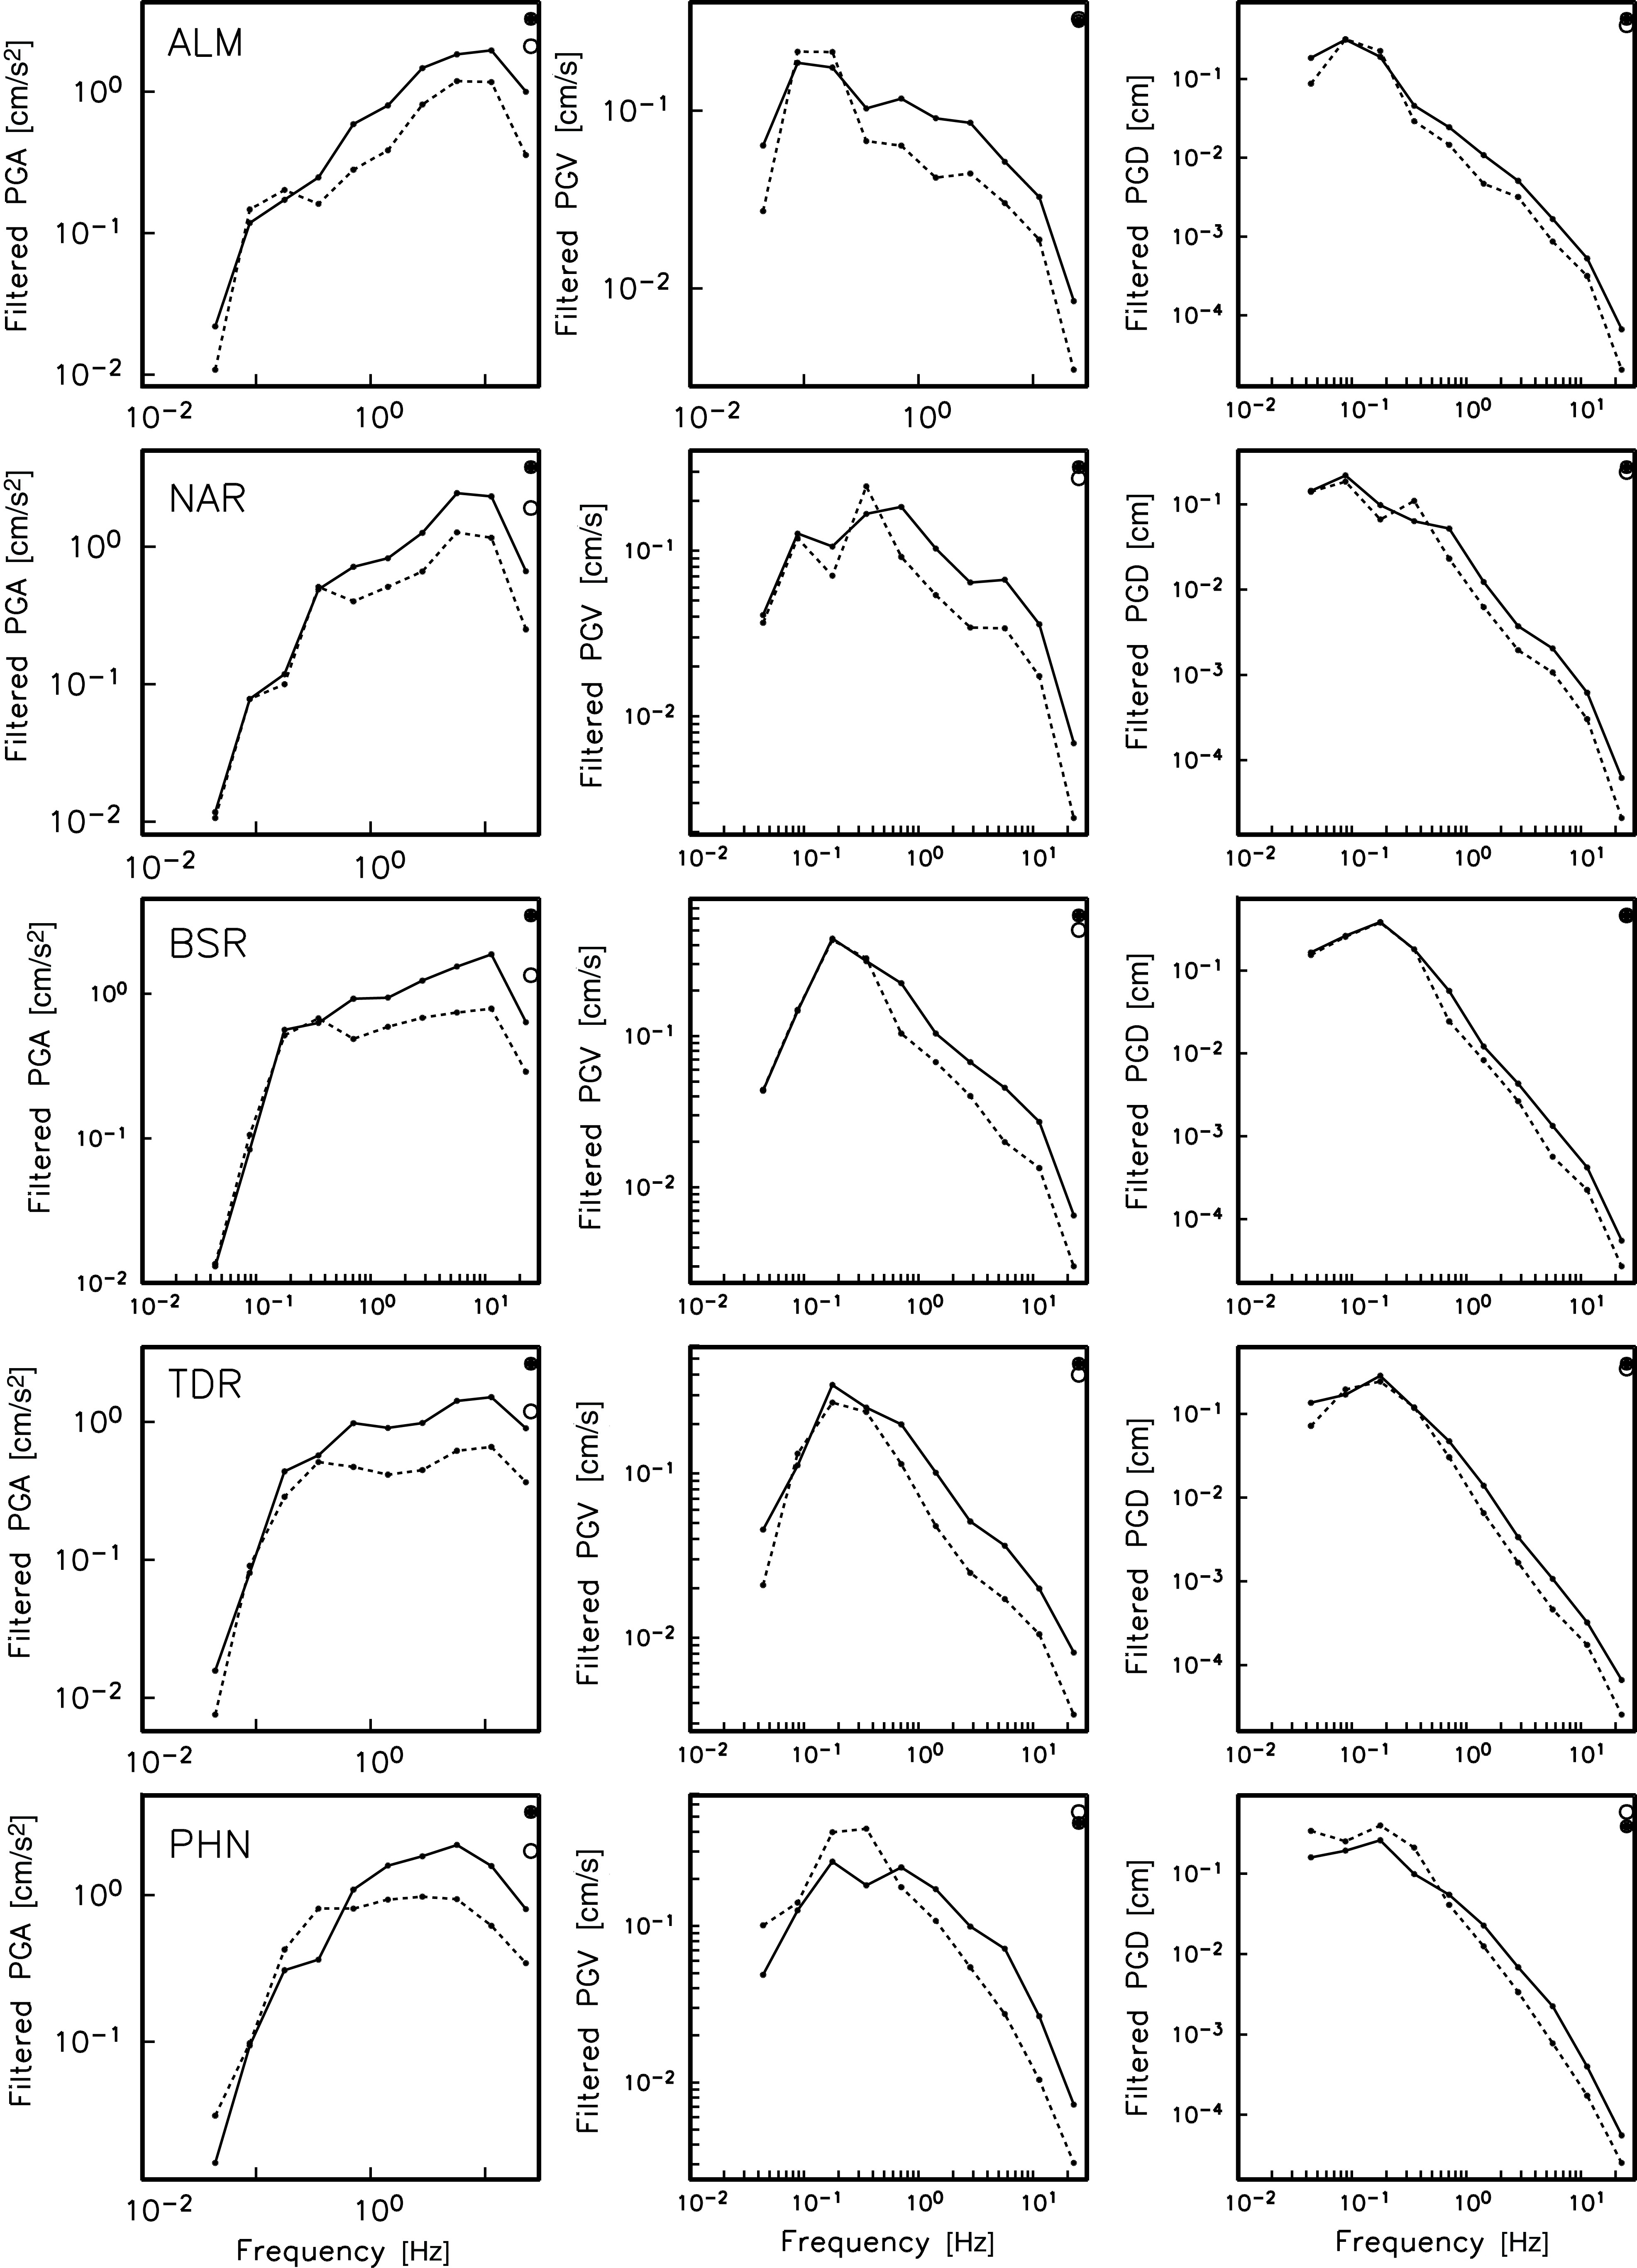
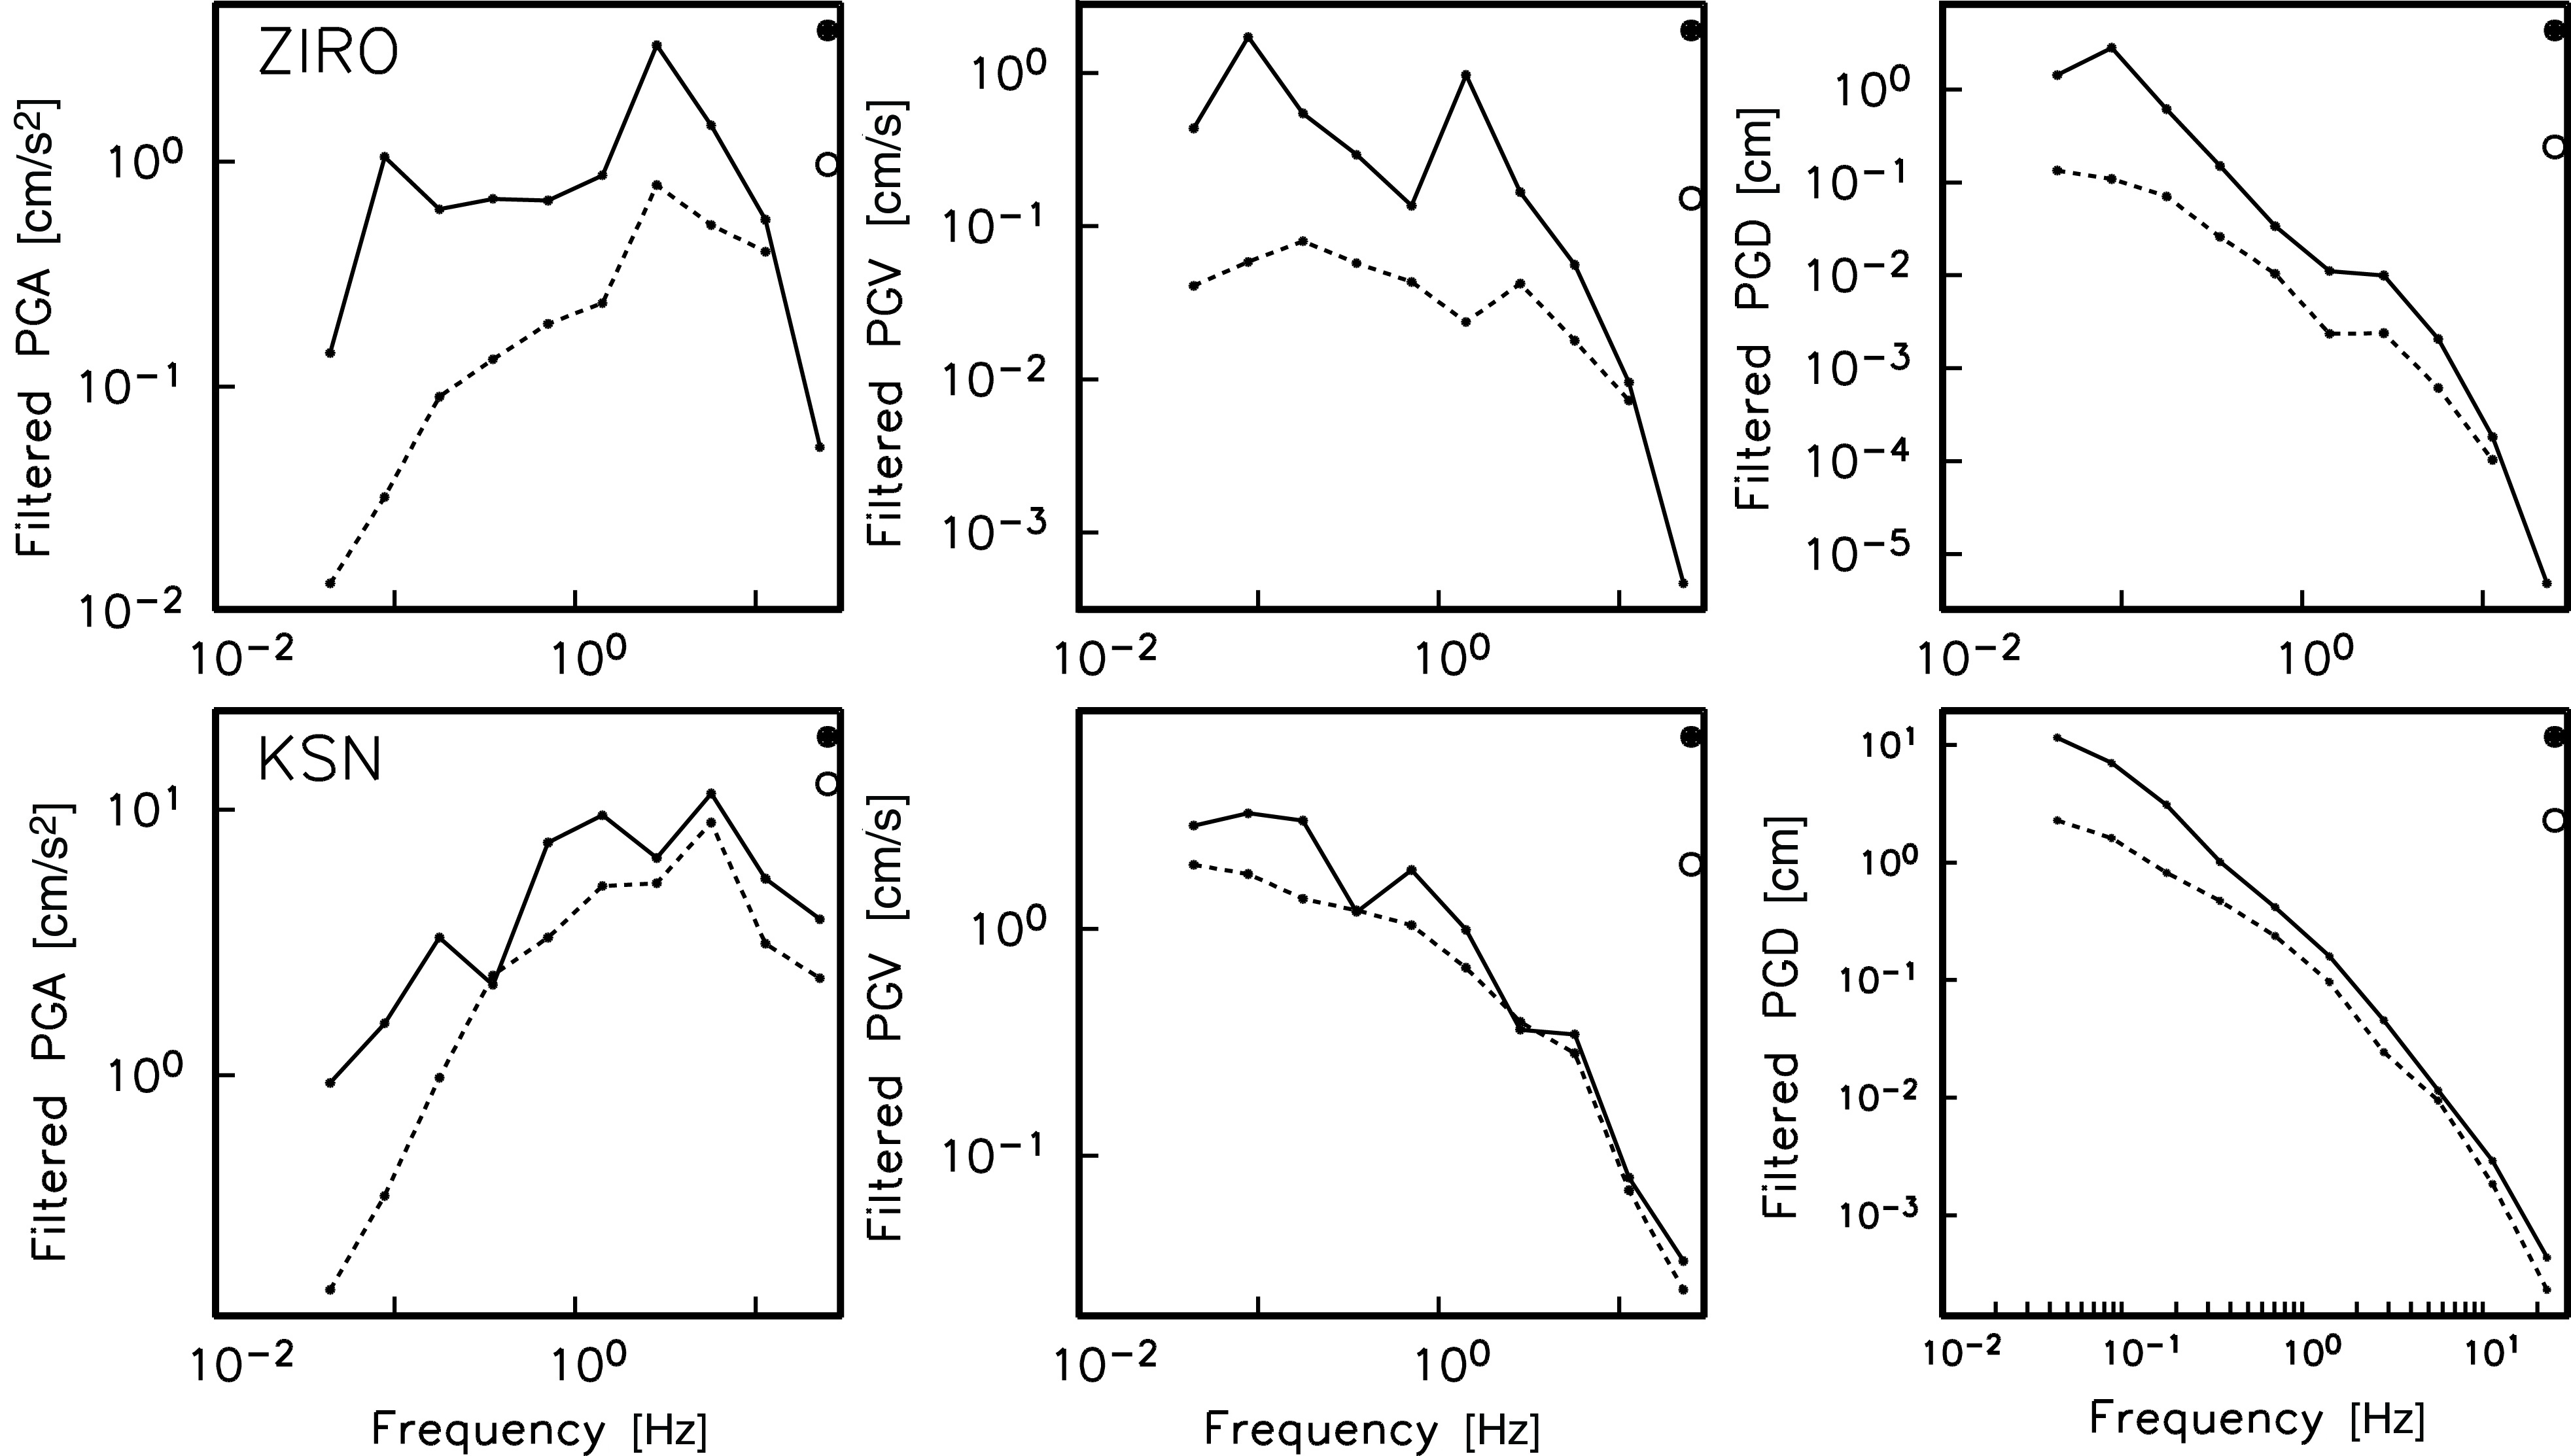
Figure S3. (a) Octave band-pass-filtered (center frequencies: 0.044, 0.088, 0.177, 0.350, 0.707, 1.414, 2.828, 5.657, 11.31, 22.62, and 25.00 Hz) PGA, PGV, and PGD of the Mw 7.9 mainshock (continuous line) and the Mw 7.2 aftershock 3 (dashed line) at three stations (ALB, VNS, and HYBB) perpendicular to the direction of rupture. Dot and circle at the upper right corner of each frame are the peak values during the mainshock and the aftershock, respectively. (b) Same as (a) but for stations ALM, NAR, BSR, TDR, and PHN, located opposite to the direction of rupture. (c) Same as (a) but for station ZIRO located in the direction of rupture.
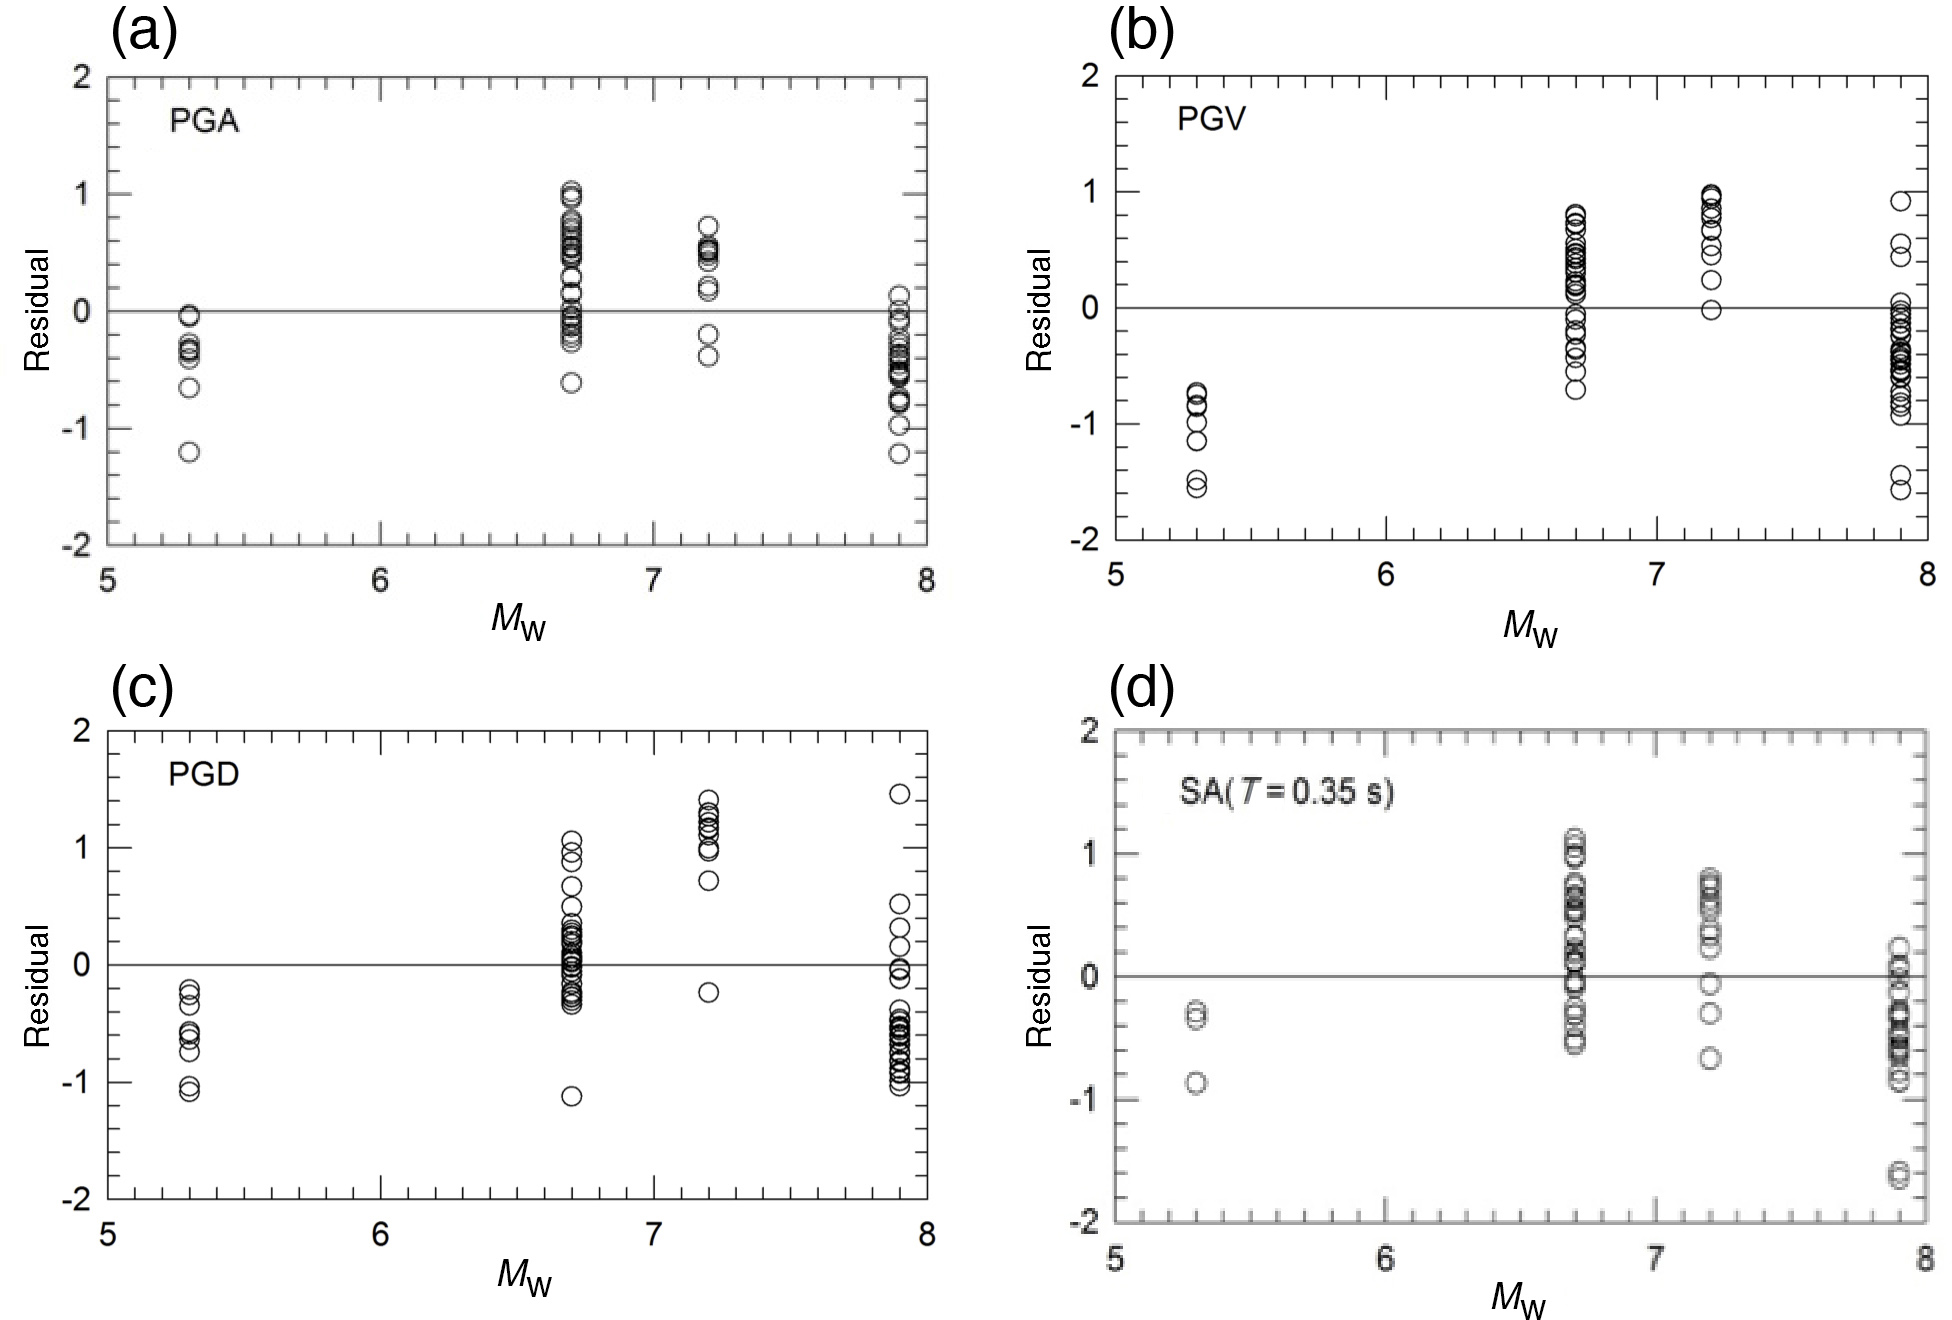
Figure S4. Residuals (in natural logarithmic units) for the model as a function of Mw: (a) PGA, (b) PGV, (c) PGD, and (d) pseudospectral acceleration (SA) (T = 0.35 s).
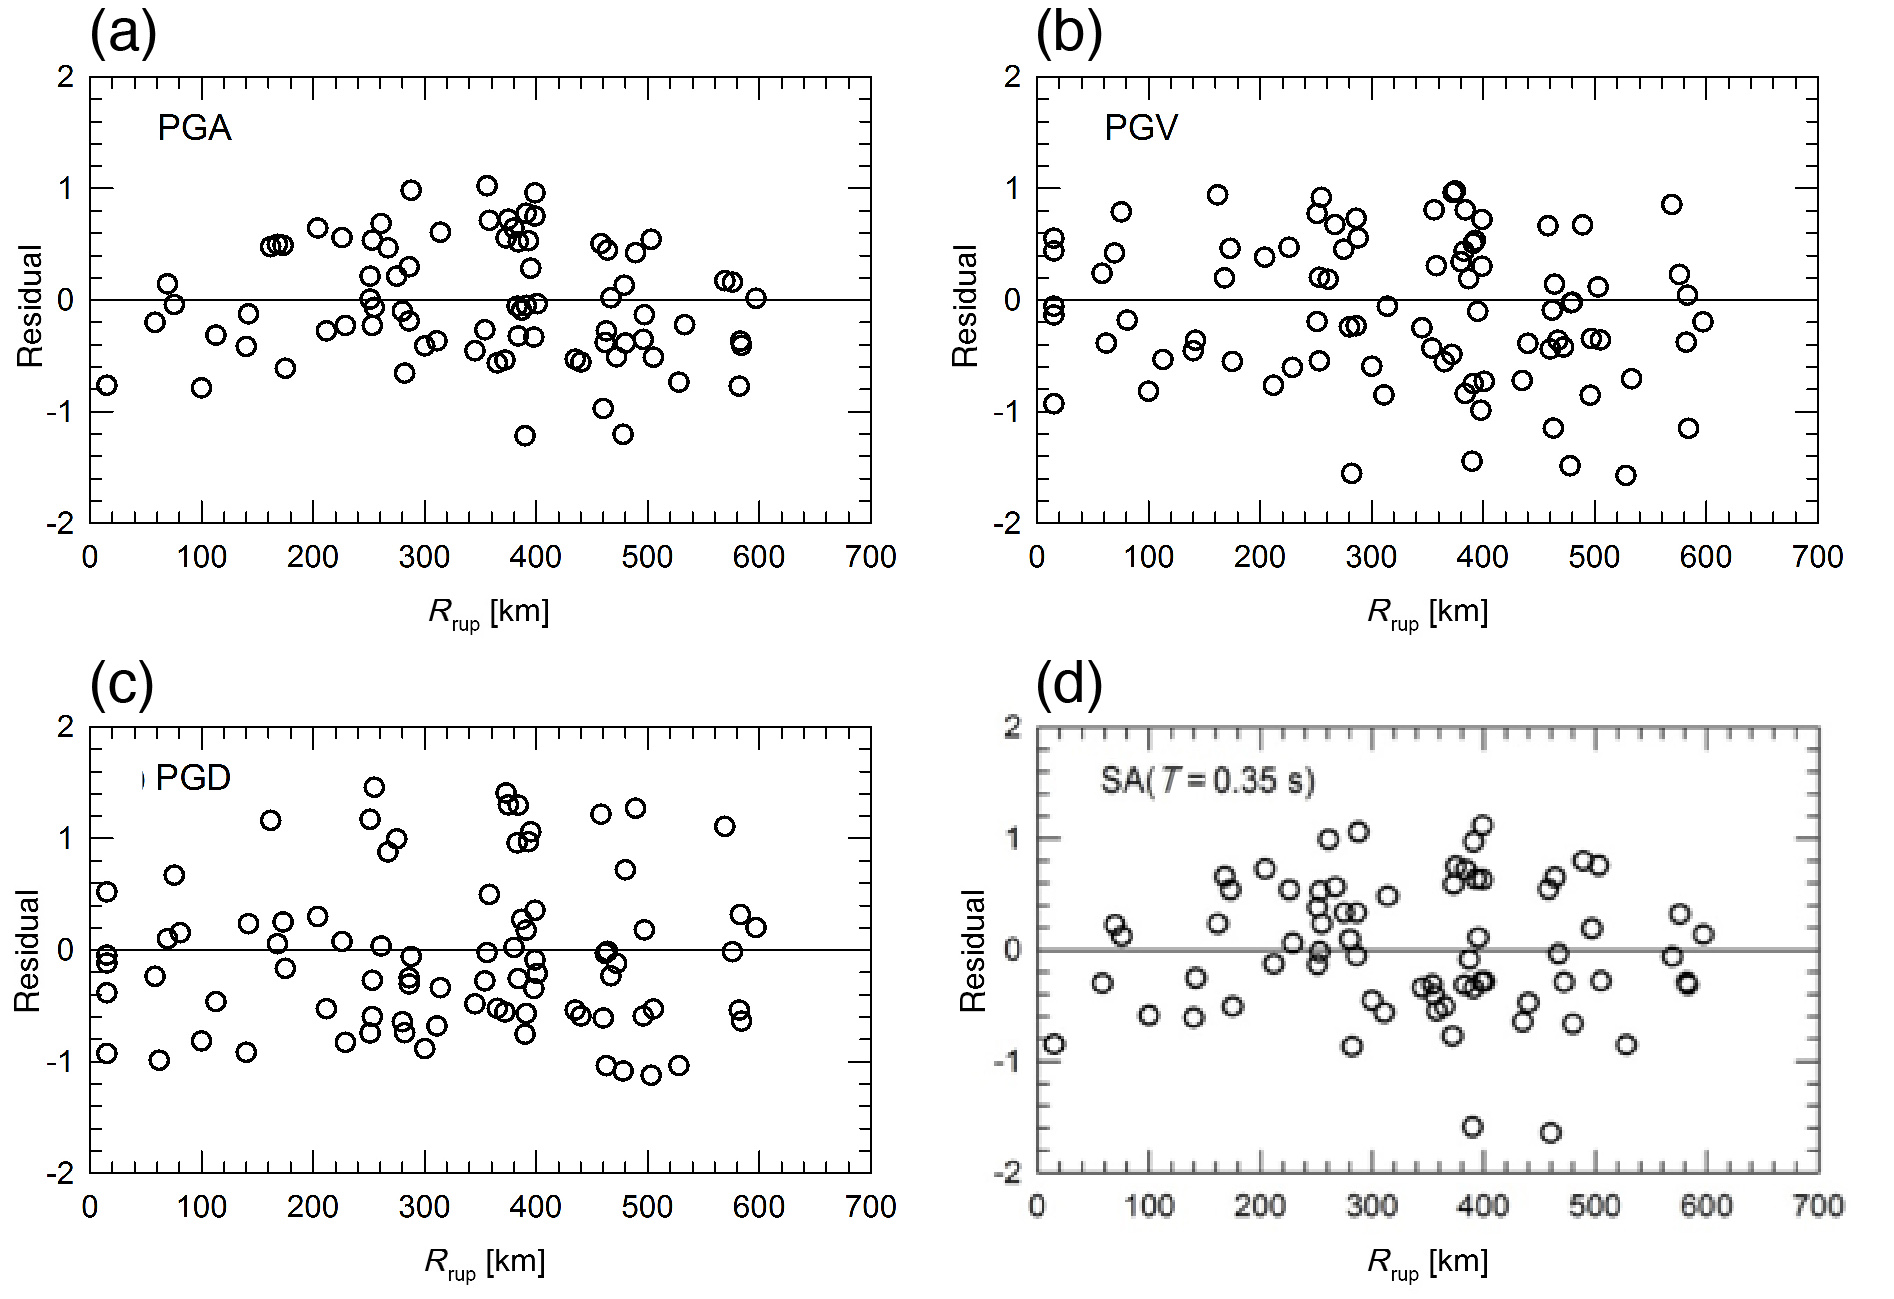
Figure S5. Residuals (in natural logarithmic units) for the model as a function of Rrup: (a) PGA, (b) PGV, (c) PGD, and (d) SA (T = 0.35 s).
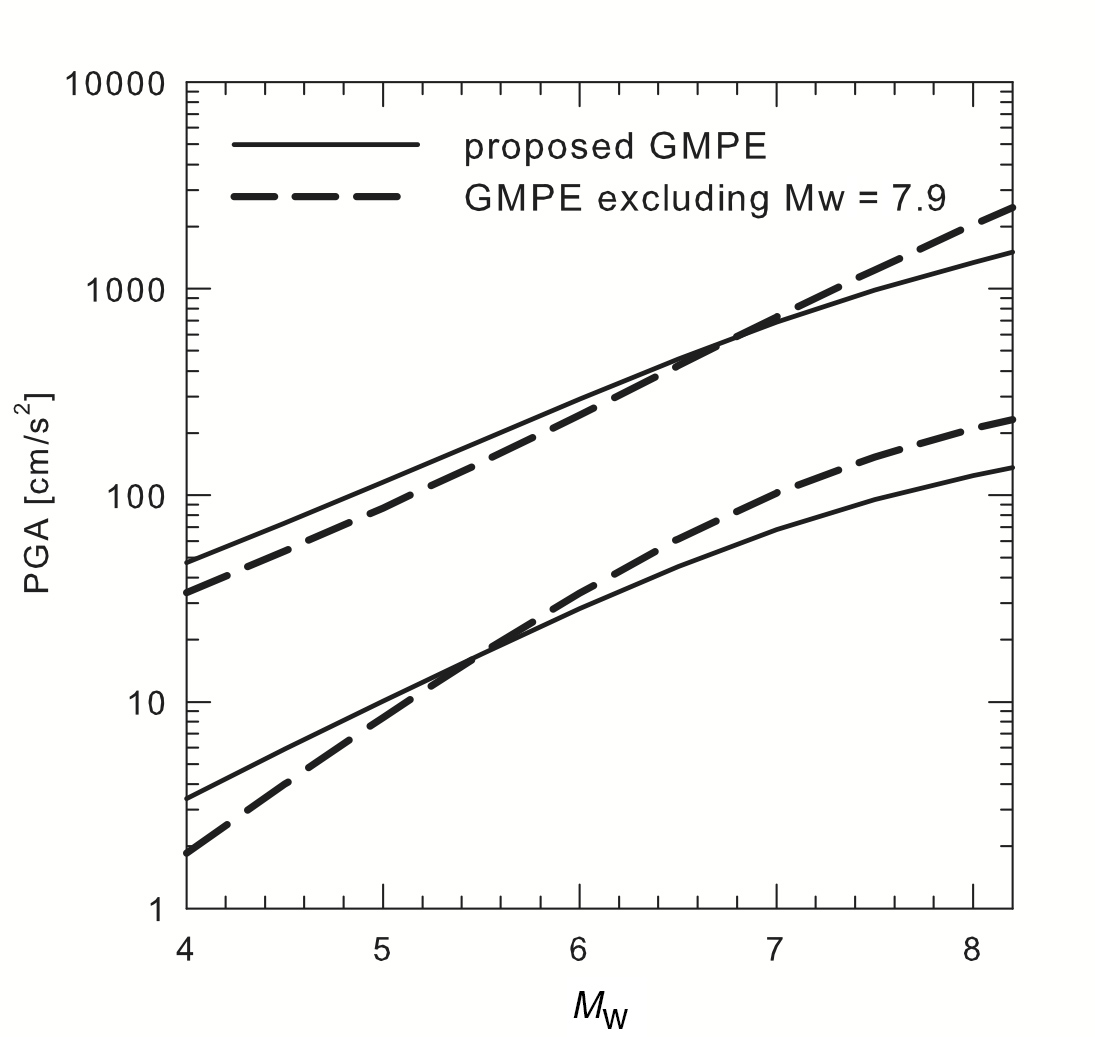
Figure S6. Comparison of ±2σ interval predictions of PGA for the proposed model and an alternative ground-motion prediction equation (GMPE) which was constructed disregarding the data from the Mw 7.9 event (Rrup = 10 km).
[ Back ]