This electronic supplement includes Figure S1 of variation of regression residuals with Rrup for observed peak ground acceleration (PGA), peak ground velocity (PGV), and spectral accelerations (SAs) at 0.2, 1.0, 3.0, and 5.0 s, two figures (Figs. S2 and S3) of regression residuals versus VS30, before and after site term adjustment based on the Seyhan and Stewart (2014) model, and two figures (Figs. S4 and S5) of variation of residuals with a rupture distance parameter, for various intensity measures (IMs).
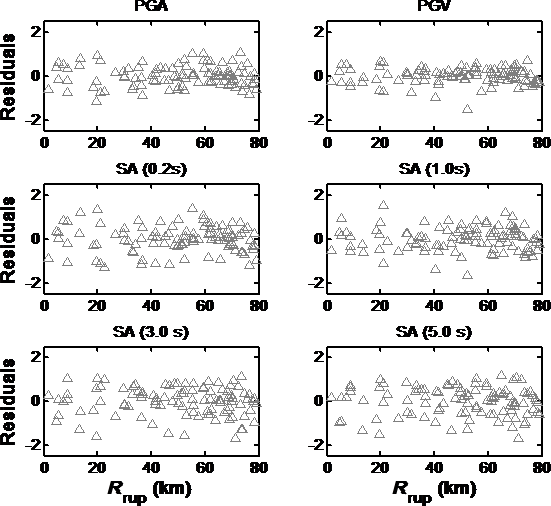
Figure S1. Variation of regression residuals with Rrup for observed PGA, PGV, and SA at the following periods: 0.2, 1.0, 3.0, and 5.0 s, after site term adjustment based on the Seyhan and Stewart (2014) model (SS14).
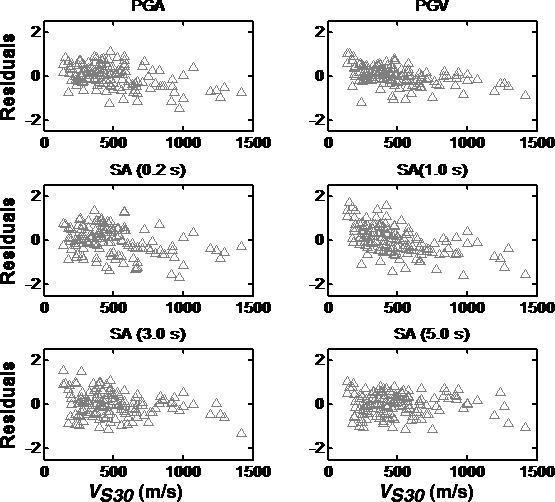
Figure S2. Regression residuals versus VS30 for observed PGA, PGV, and SA at the following periods: 0.2, 1.0, 3.0, and 5.0 s, before site term adjustment.
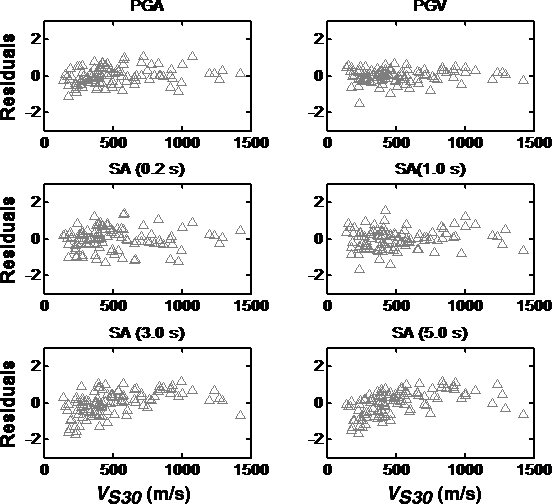
Figure S3. Regression residuals versus VS30 for observed PGA, PGV, and SA at the following periods: 0.2, 1.0, 3.0, and 5.0 s, after site term adjustment based on the Seyhan and Stewart (2014) model (SS14).
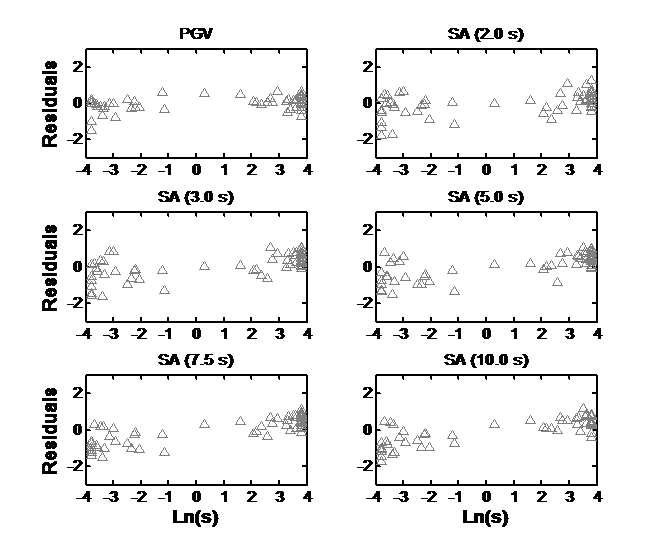
Figure S4. Variation of residuals with rupture distance parameters for PGV and long-period SA at the following periods: 2.0, 3.0, 5.0, 7.5, and 10.0 s. Data points with Rrup < L (length of ruptured fault) are shown in this figure. Data points in the backward region with > 90°are depicted with negative distances.
Figure S5. Same as Figure S4 but for Rrup > L.
Seyhan, E., and J. P. Stewart (2014). Semi-empirical nonlinear site amplification from NGA-West2 data and simulations, Earthq. Spectra 30, no. 3, 1241–1256.
[ Back ]