This electronic supplement contains four figures and a table showing (1) the Gutenberg–Richter distribution computed using the maximum-likelihood estimation (Fig. S1); (2) an example showing a regional moment tensor inversion for an Mw 4 event performed using the local and regional seismic network (Fig. S2); (3) a comparison between the earthquake relocation process performed using hypoDD and GrowClust algorithms (Fig. S3); (4) spatial distribution of in-slab seismicity that is well recorded by the local and regional seismic networks in the same area offshore the Nicoya Peninsula since 1999 (Fig. S4); and (5) Table S1 with earthquake locations, relative location errors, and focal geometries.
Table S1 [Plain text comma-separated values; ~29 KB]. Hypocenter locations and focal mechanisms for all of the events analyzed in this study. Relative error estimates equal to −1 correspond with those events that were not relocated by the GrowClust algorithm.
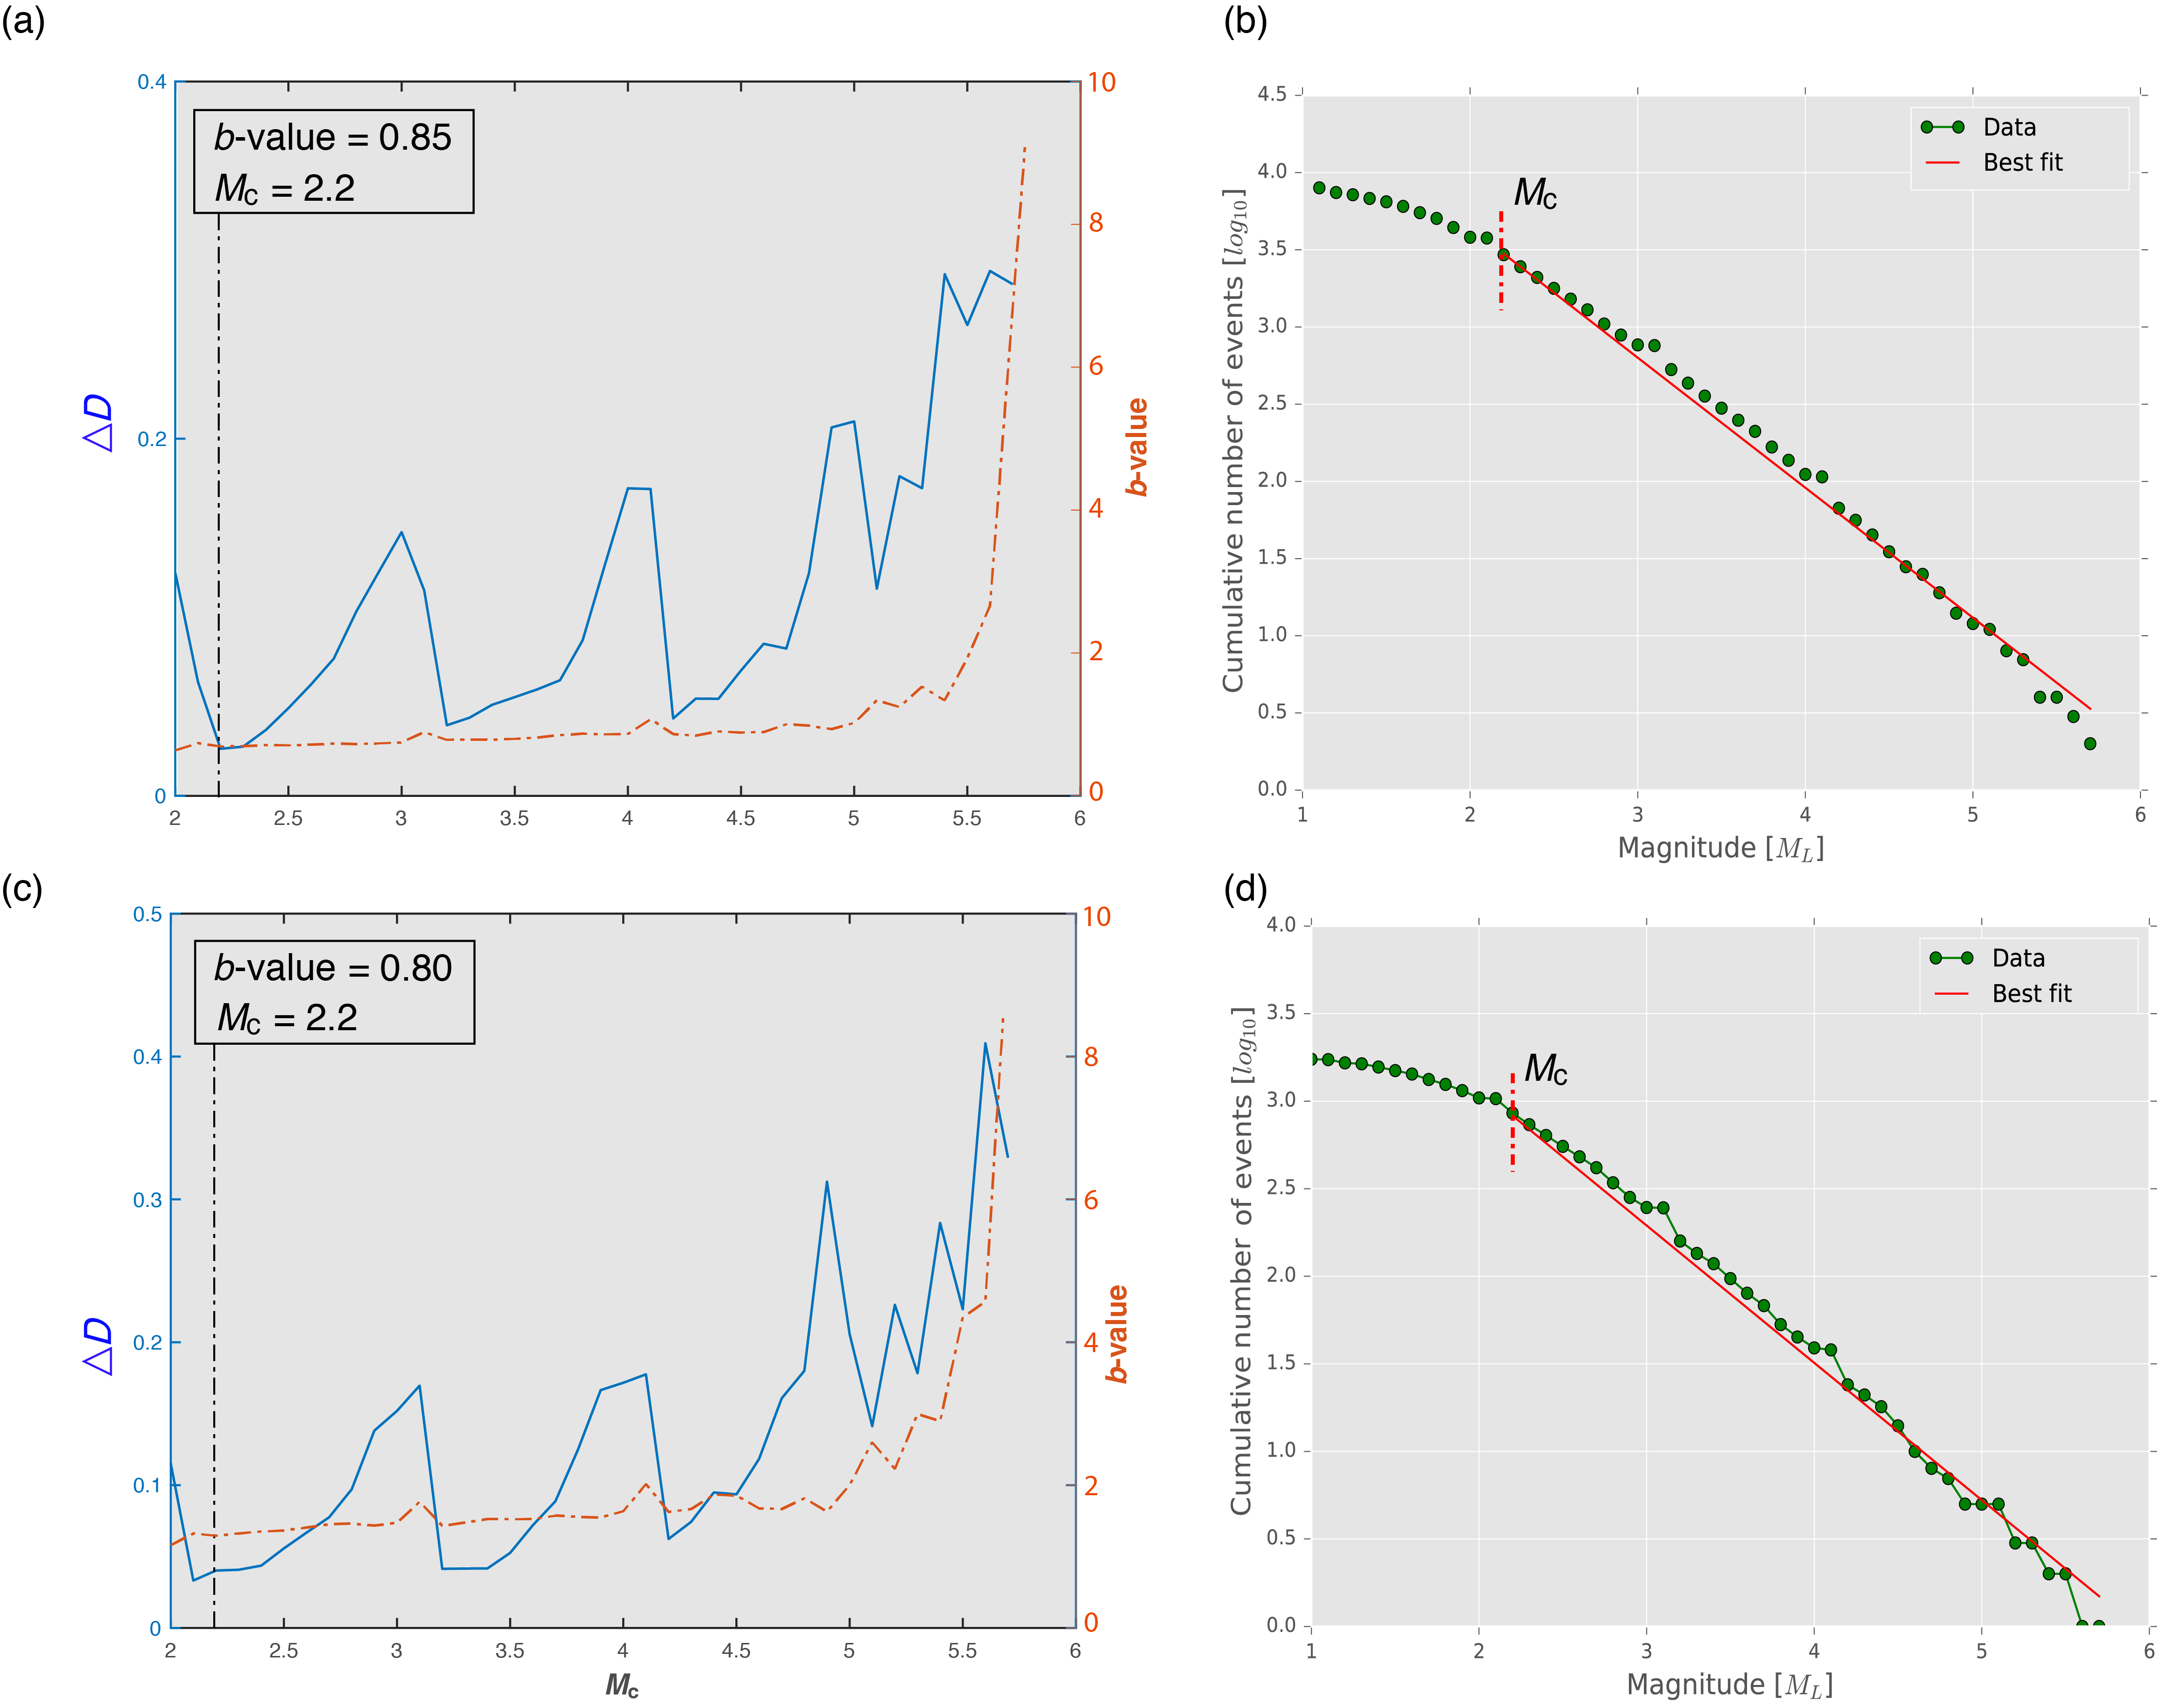
Figure S1. The Gutenberg–Richter distribution computed using the maximum-likelihood estimation for (a,b) the aftershock sequence during the four months subsequent to the main event and (c,d) the first nine days of the earthquake sequence. The magnitude of completeness (Mc) shown in (a) and (c) was generated using a Kolmogorov–Smirnov (K-S) inversion approach, The Mc is computed iteratively from the goodness of fit using a K-S inversion approach between the observed and theoretical Gutenberg–Richter distributions, with b-value from maximum-likelihood estimation, where ΔD is the K-S metric distance between the two cumulative distribution functions.
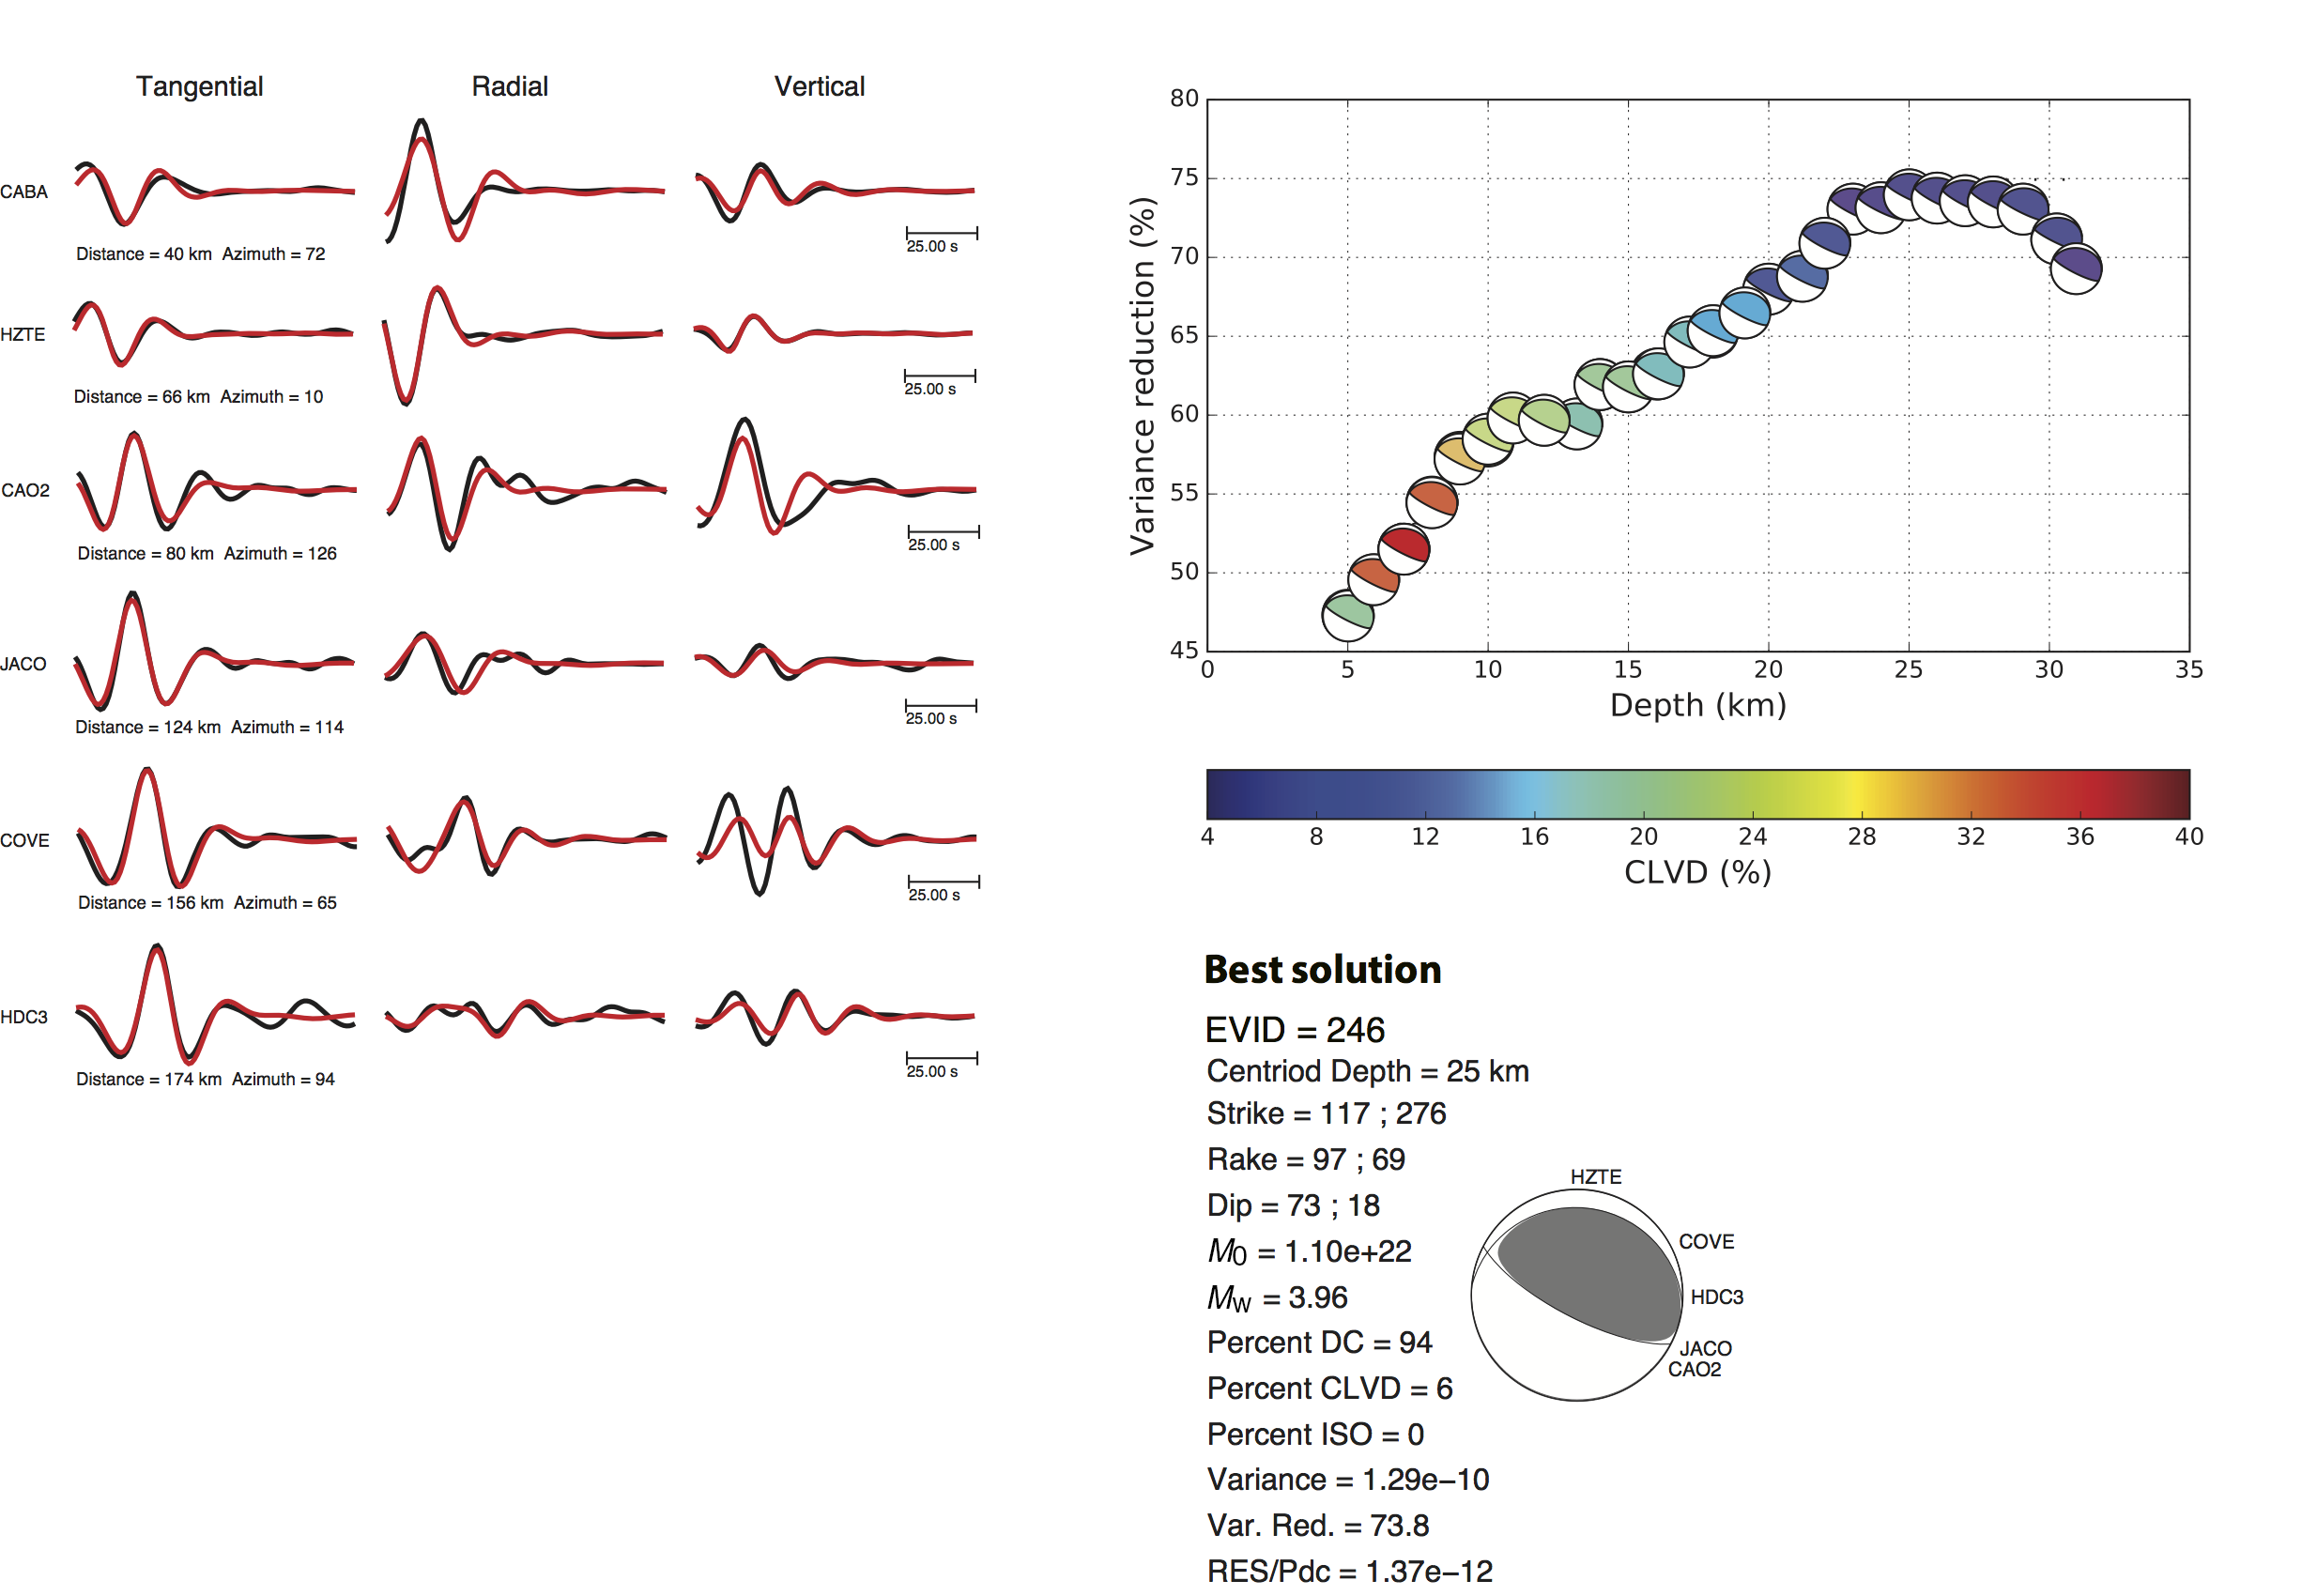
Figure S2. Regional moment tensor inversion for an Mw 4 event performed using the local and regional seismic network. This figure shows the waveform fit between data (black lines) and synthetics (red lines), the moment tensor decomposition, and source parameters. The variance reduction as a function of depth is presented as well. Focal mechanisms are color-coded by compensated linear vector dipole (CLVD) (%).
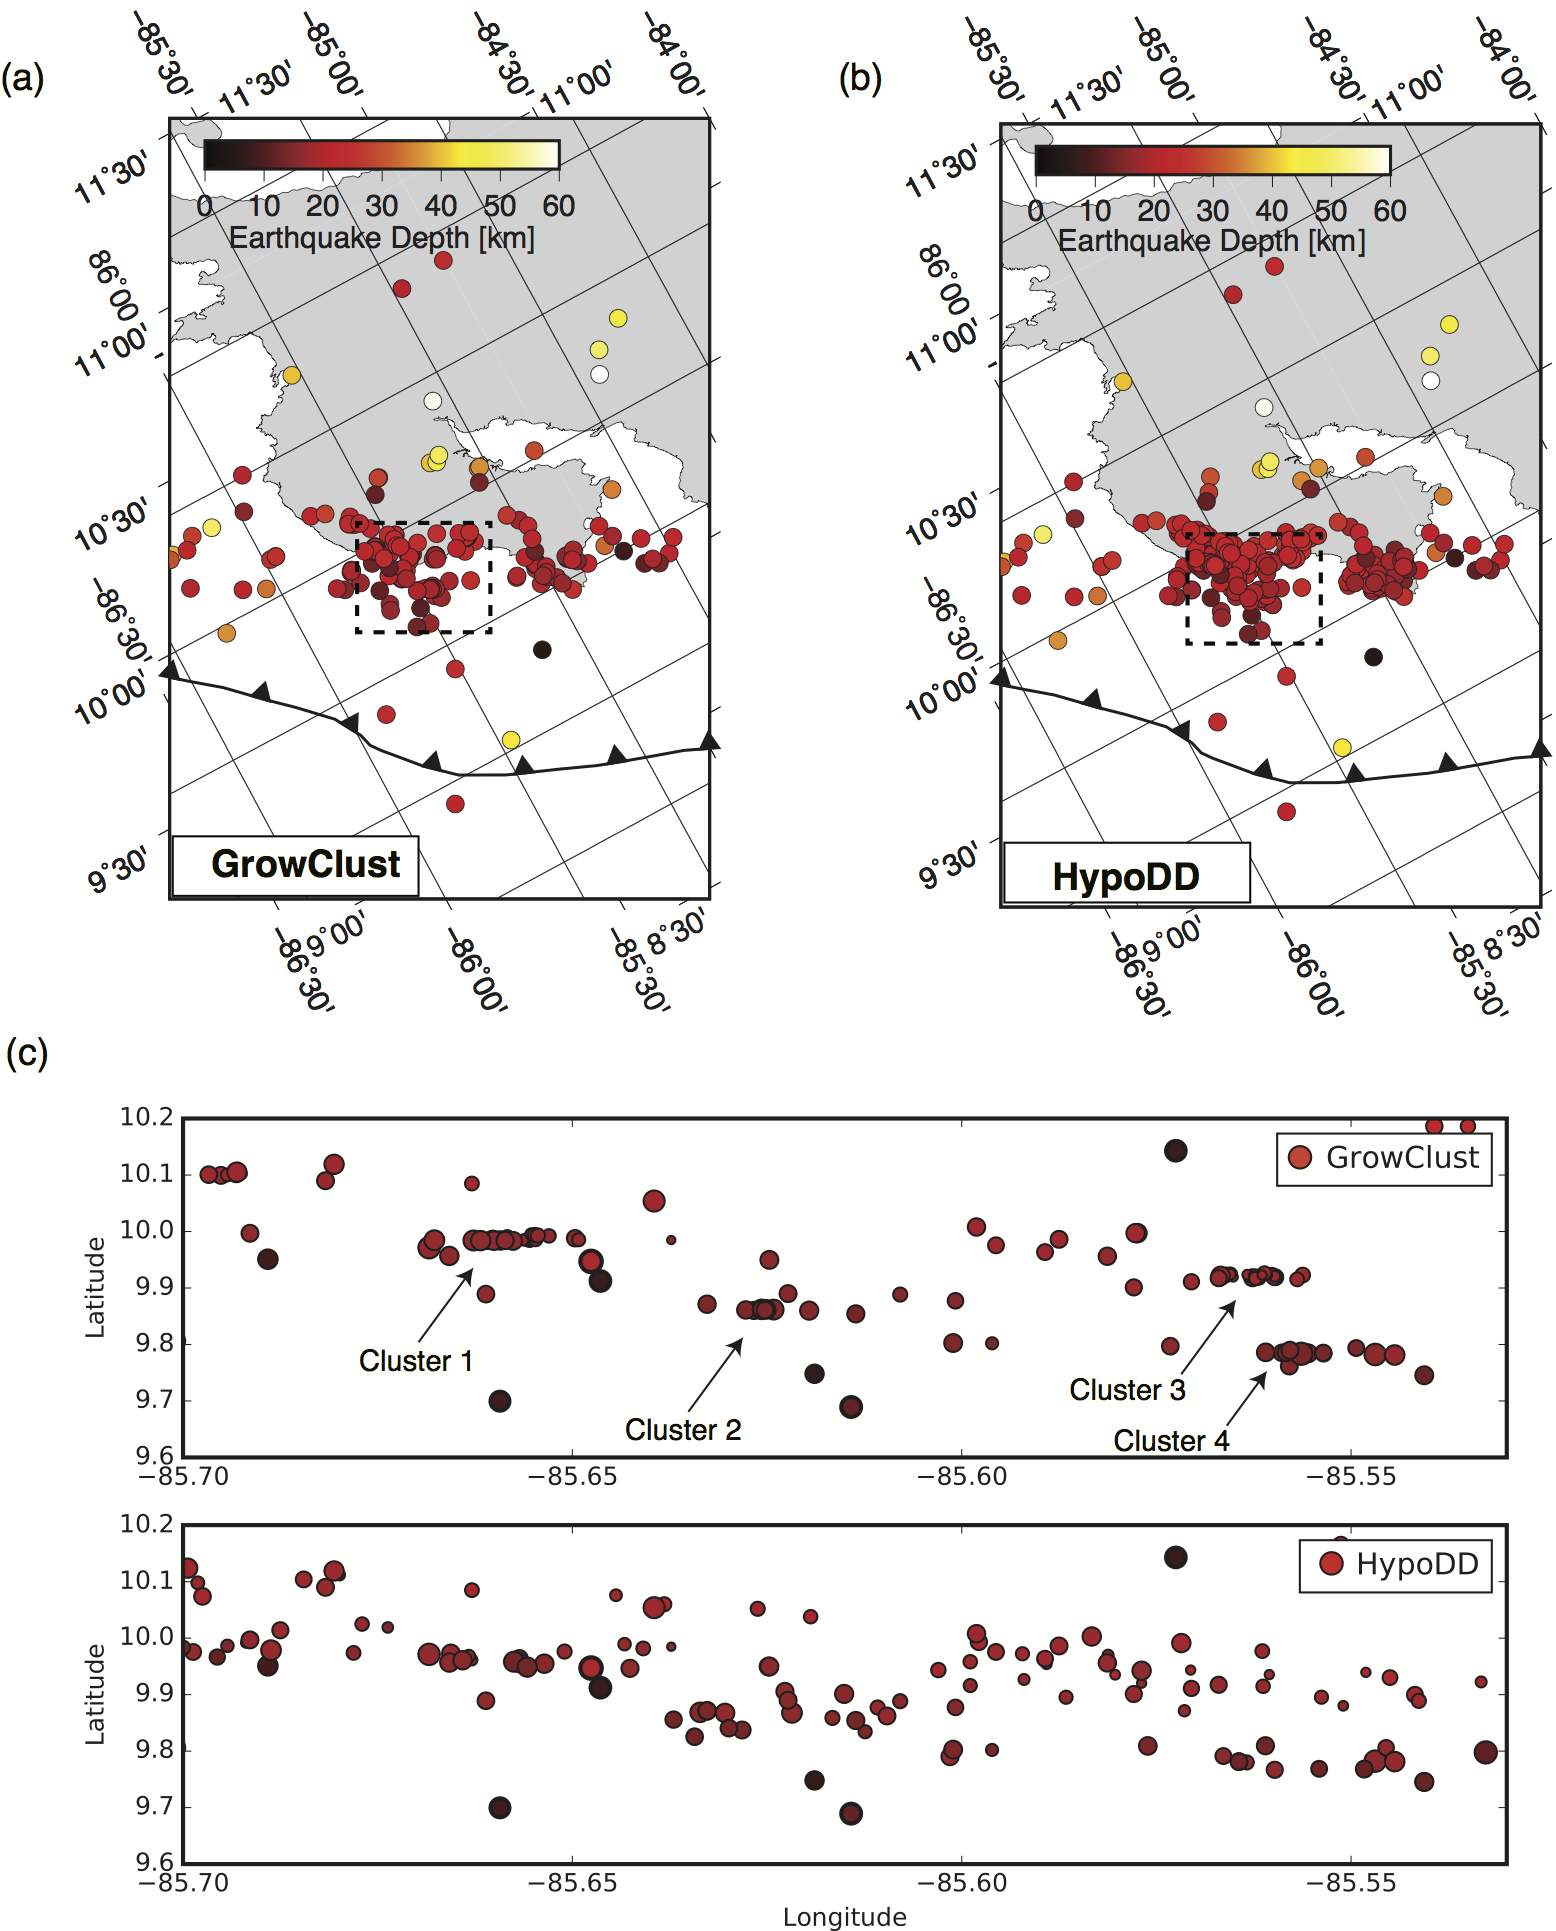
Figure S3. Earthquake relocation. Relative hypocenter location of the aftershock sequence of the Nicoya Peninsula earthquake computed using (a) GrowClust and (b) hypoDD. (c) Close-up window comparing the clustering of events between GrowClust (top panel) and hypoDD (bottom panel). The relative location errors from GrowClust are on the order of hundreds of meters.
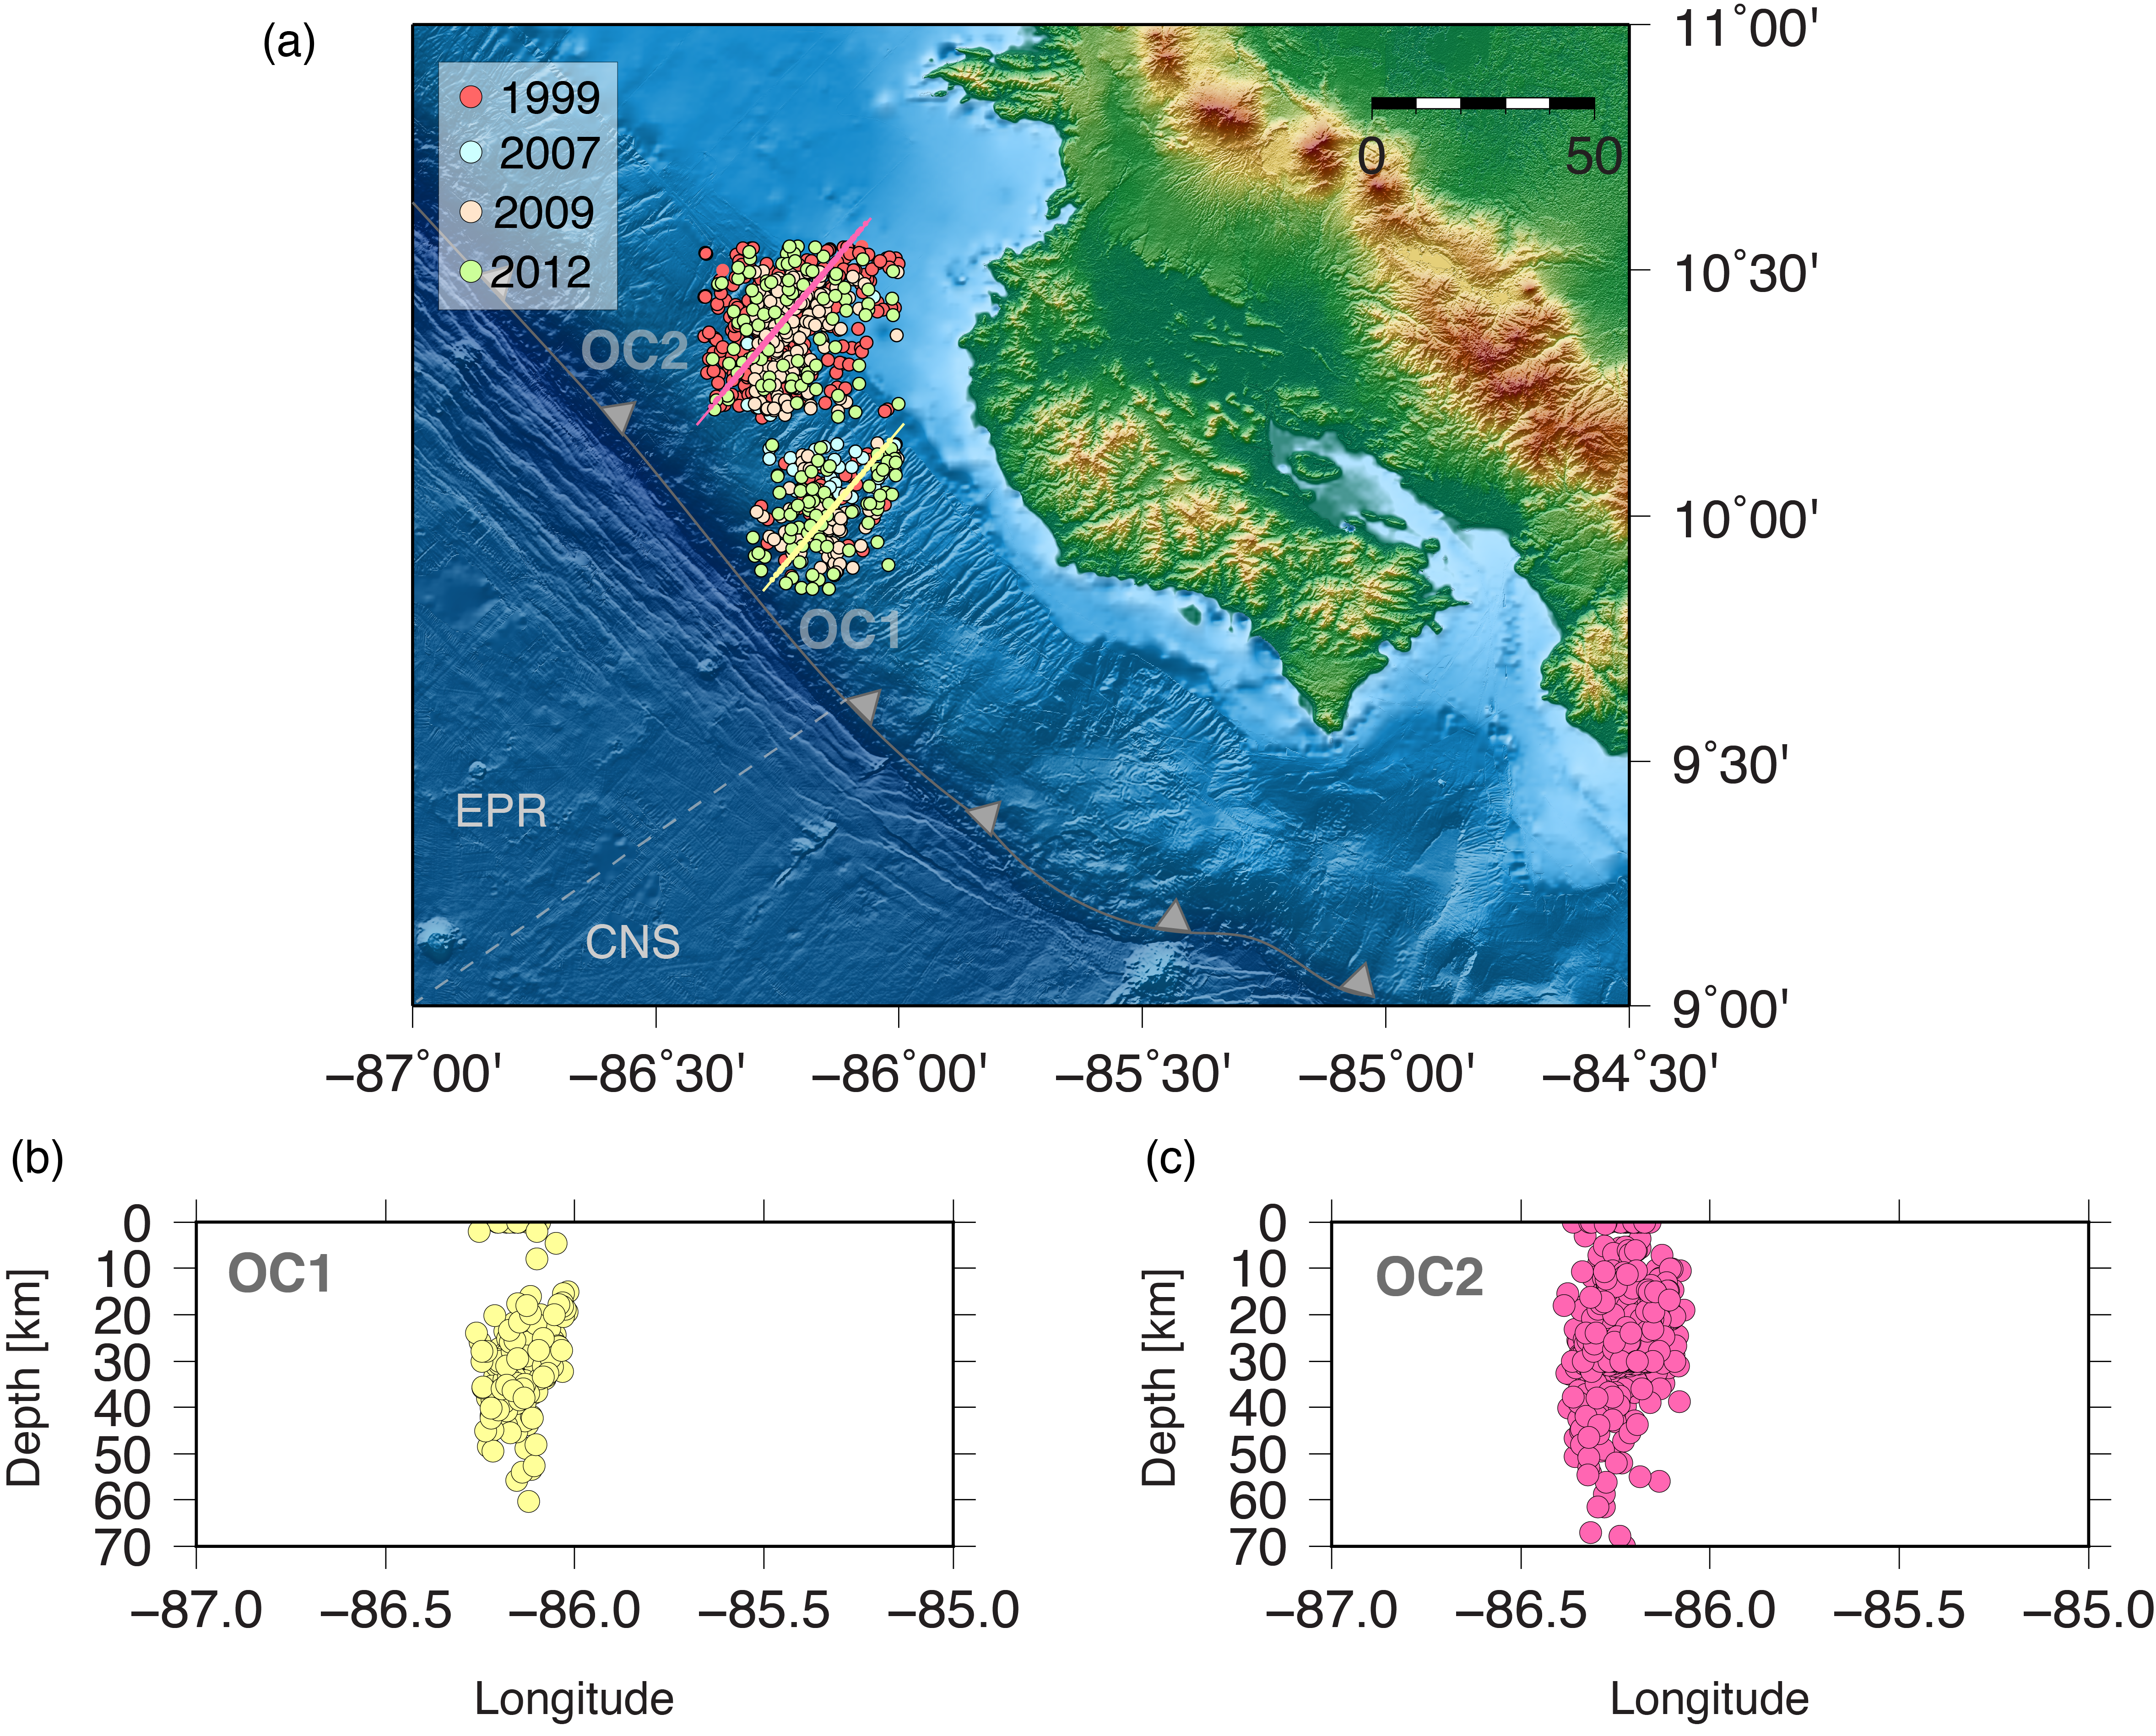
Figure S4. (a) Spatial distribution of in-slab seismicity that is well recorded by the local and regional seismic networks in the same area offshore the Nicoya Peninsula since 1999. Circles are color-coded by year. (b,c) Cross sections through seismic clusters OC1 and OC2. Cluster OC2 corresponds with cluster C3 in Figure 4 in the main article.
[ Back ]