This electronic supplement contains dates of the trials used as well as Q–Q plots for the statistics collected from the sensor tests. It should be noted that the mean ratio (Fig.–S1) is likely showing a deviation coming from the vertical components (BH0) compared to the horizontal components (BH1 and BH2). The Q–Q plots for the power spectral density (PSD) estimates as well as the self-noise follow standard normal distributions closely (Figs. S2 and S3). The deviations in the Q–Q plot for the orientations (Fig.–S4) likely come from outlying installations.
Table S1. Trial number, start time of data analyzed for the trial (in UTC time), and additional notes about the trial.
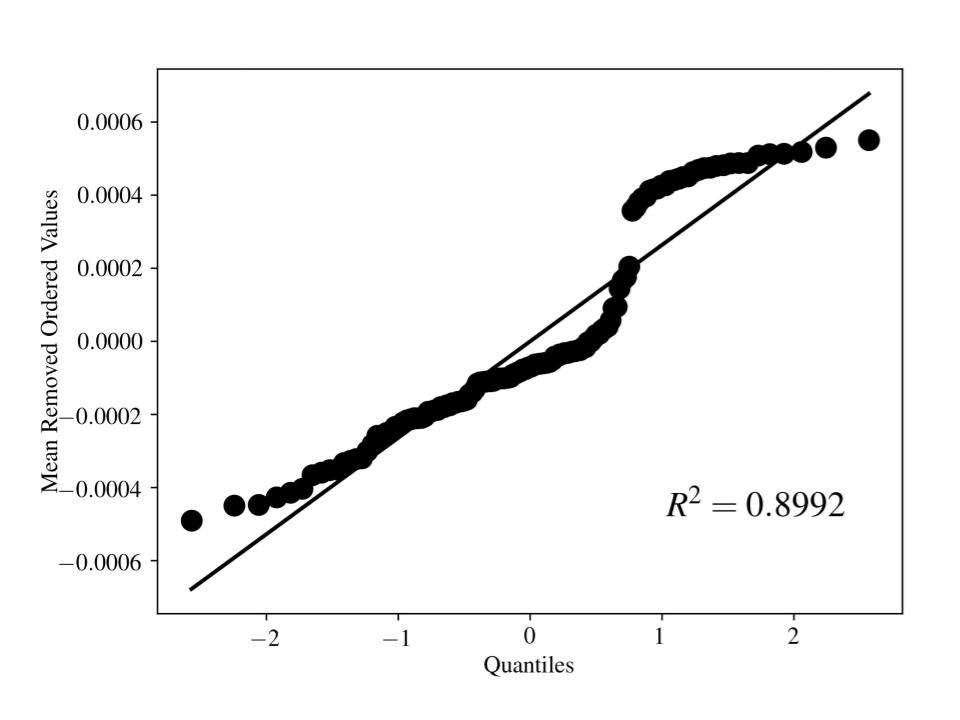
Figure S1. Q–Q plot for the mean ratio between components in the 4–8-s-period band compared to a standard normal distribution. We removed the sample mean from our mean ratio samples.
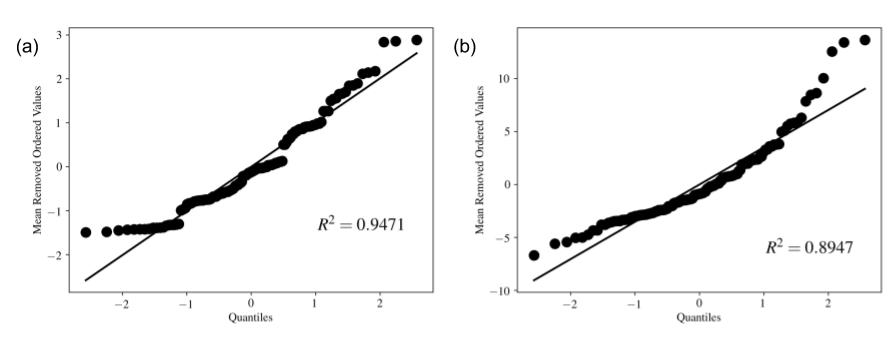
Figure S2. (a) Q–Q plot for the mean PSD in the 0.1–30-s-period band as compared to a standard normal distribution. (b) Q–Q plot for the mean PSD in the 30–100-s-period band as compared to a standard normal distribution. We removed the sample mean from our mean ratio samples.
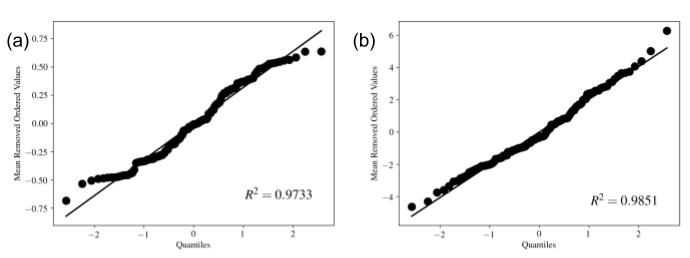
Figure S3. (a) Q–Q plot for the incoherent self-noise in the 0.1–30-s-period band as compared to a standard normal distribution. (b) Q–Q plot for the incoherent self-noise in the 30–100-s-period band as compared to a standard normal distribution. We removed the sample mean from our mean ratio samples.
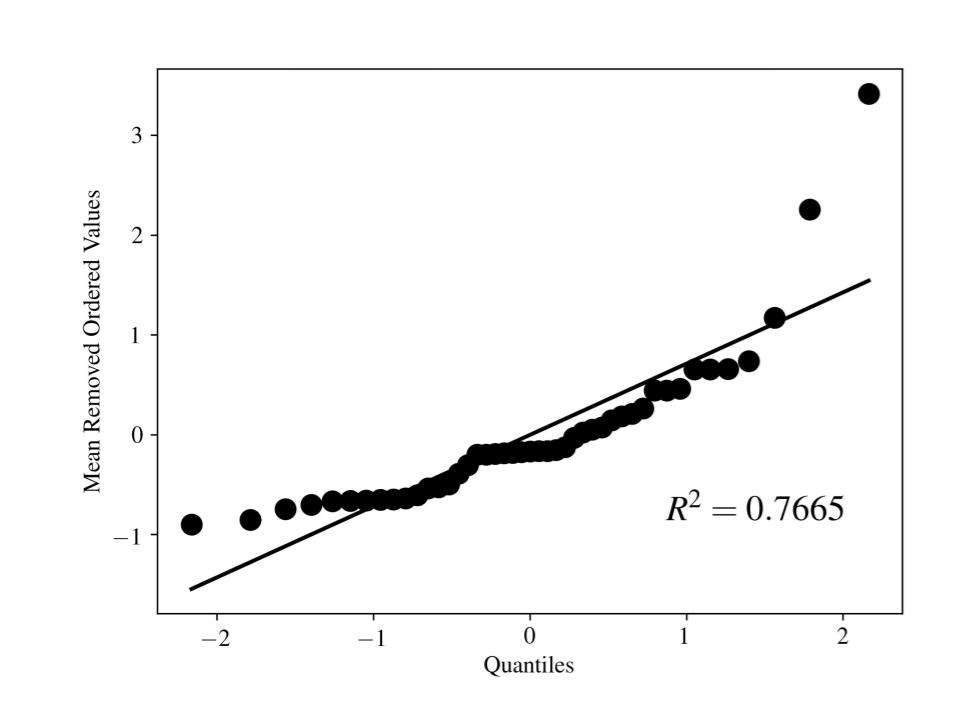
Figure S4. Q–Q plot for the relative orientation as compared to a standard normal distribution. We removed the sample mean from our mean ratio samples.
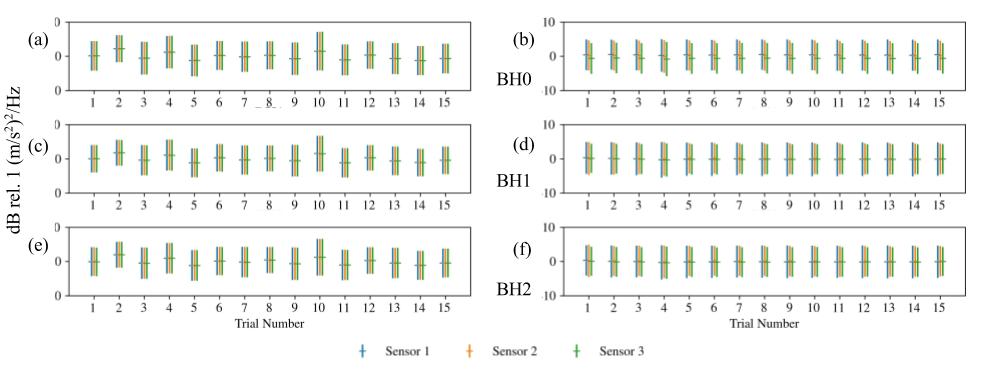
Figure S5. Mean removed (common mean from all trials and components) estimated PSD and estimated self-noise from 0.1–30 s period of the 15 trials for the vertical (a,b; channel BH0), the north–south (c,d; channel BH1), and the east–west (e,f; channel BH2). Error bars represent ±1 standard deviation.
[ Back ]