This electronic supplement contains extra figures from the Kamaishi earthquake cluster data set. Figures S1–S5 include waveforms, and Figures S6–S10 include multichannel deconvolution (MCD) apparent source time functions (ASTFs) for KiK-net stations IWTH04, IWTH14, IWTH21, IWTH23, and MYGH03.
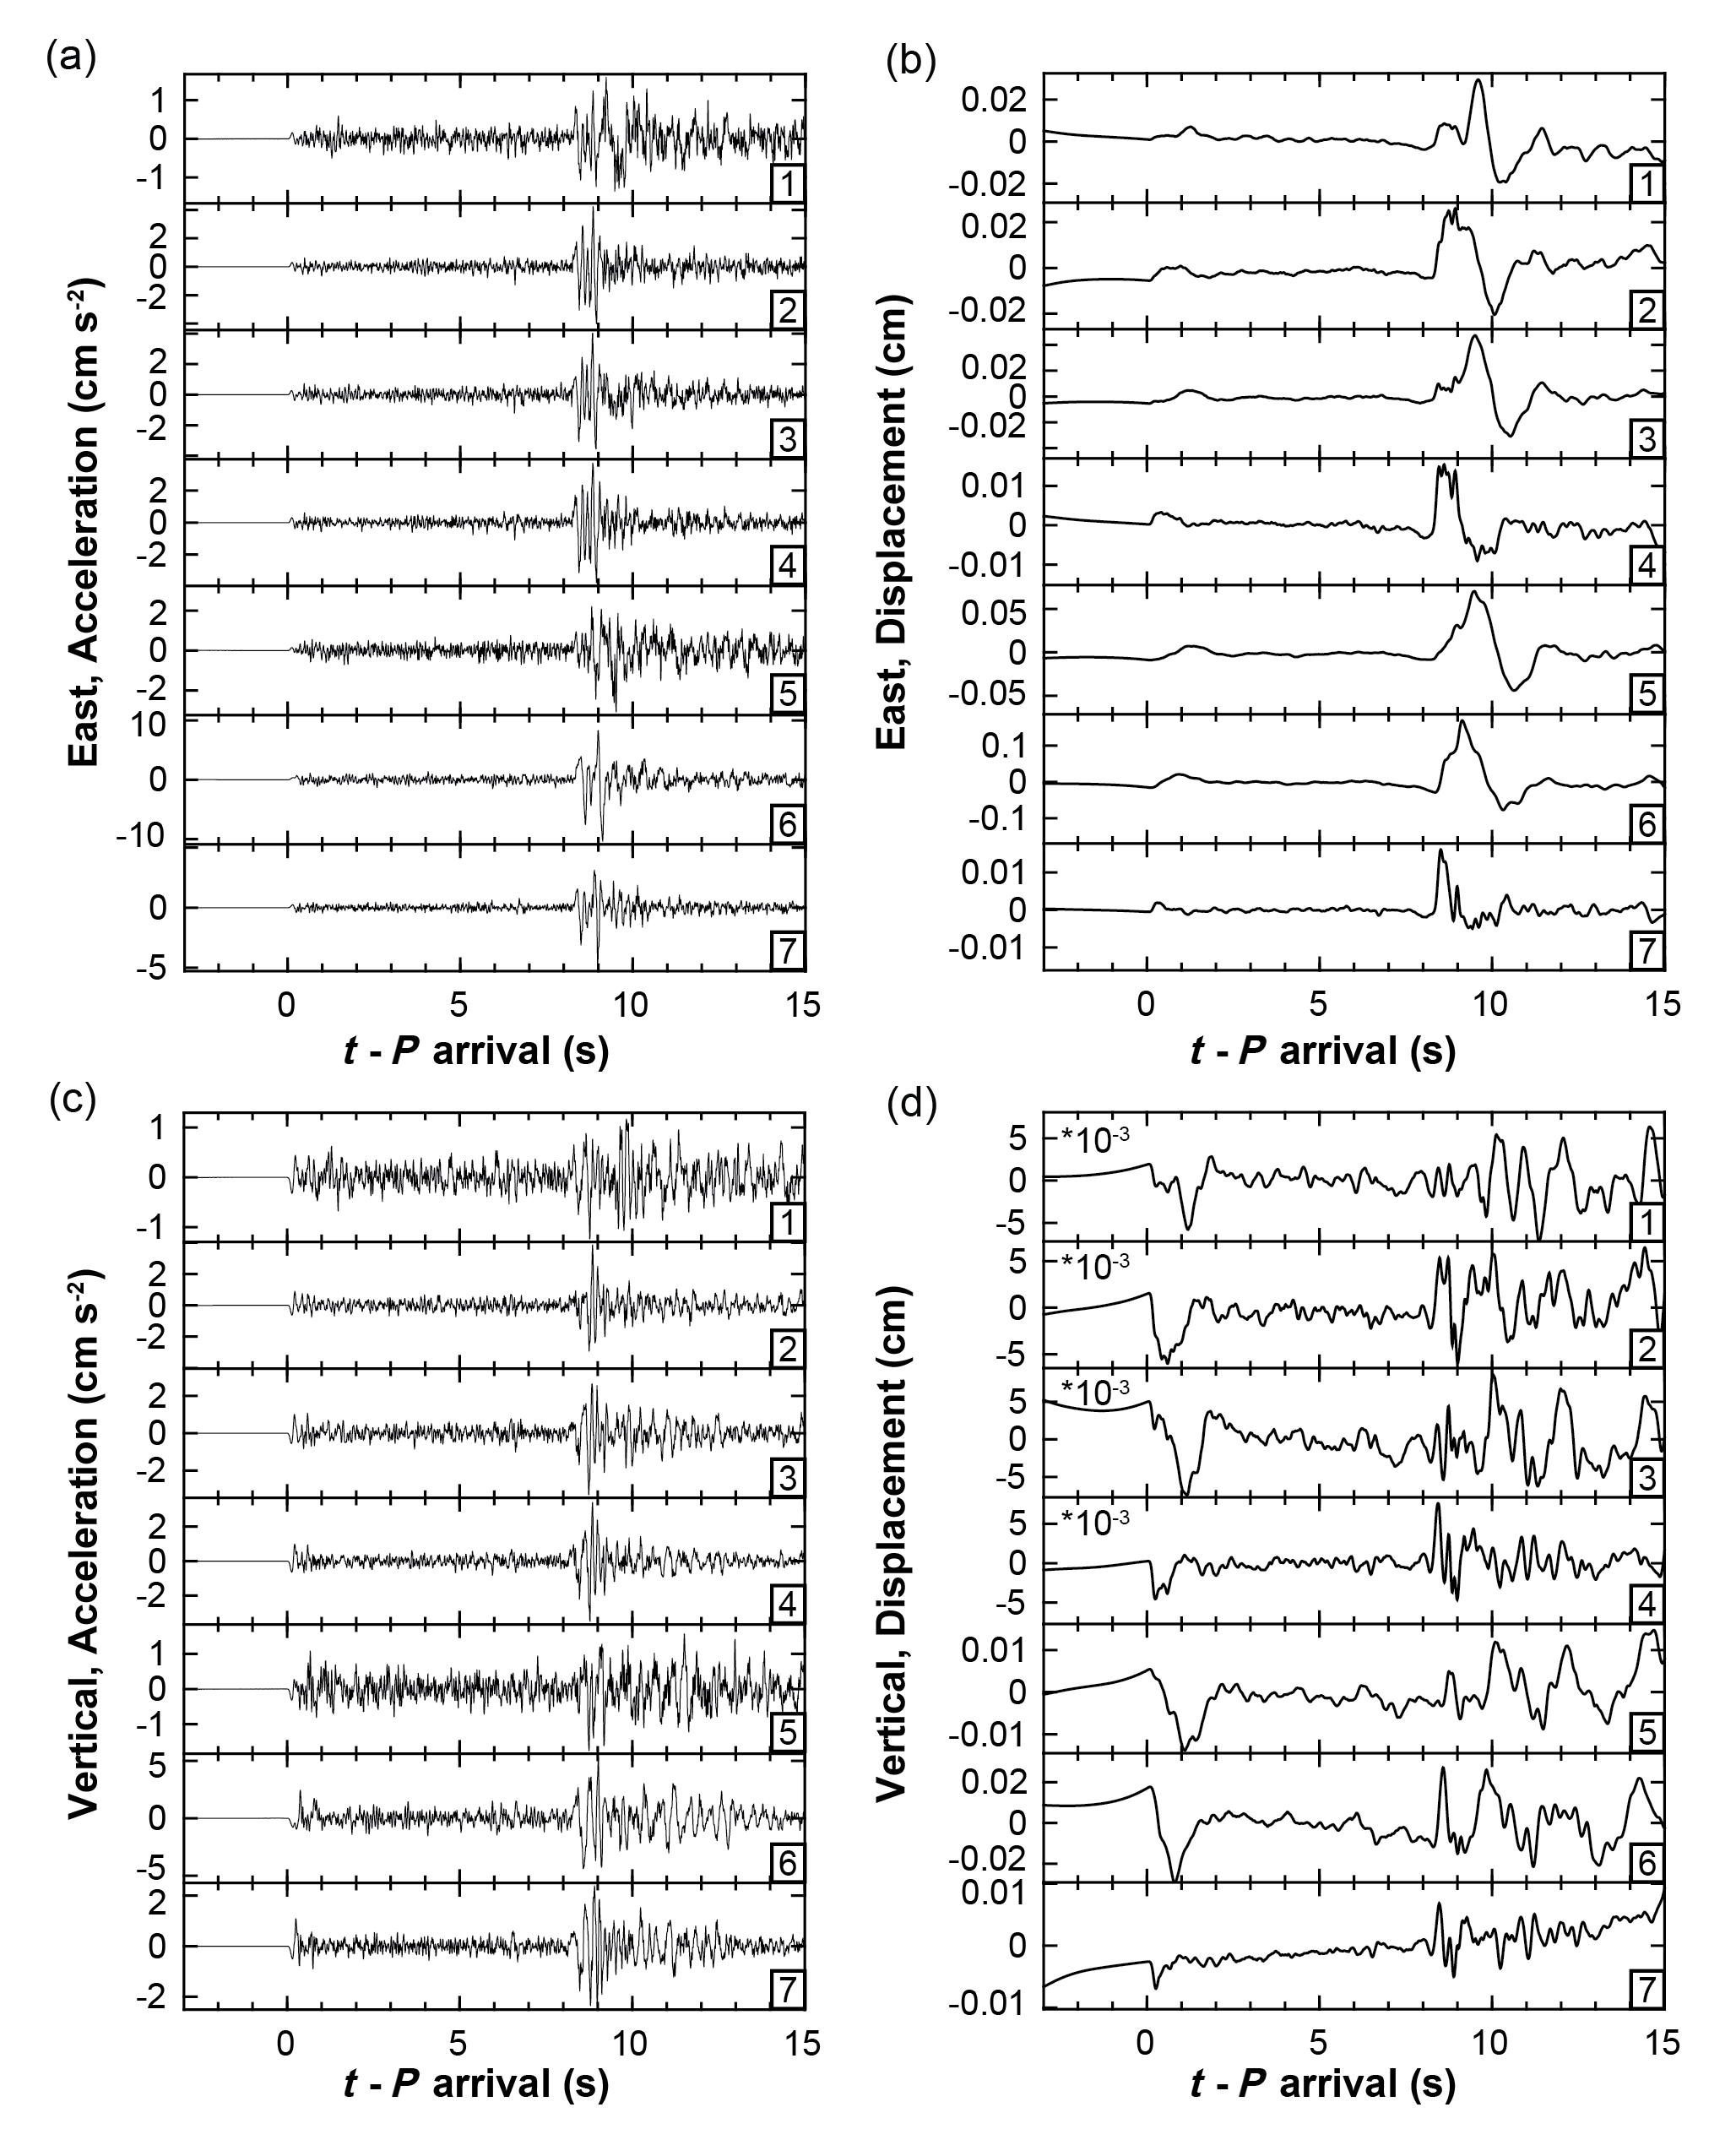
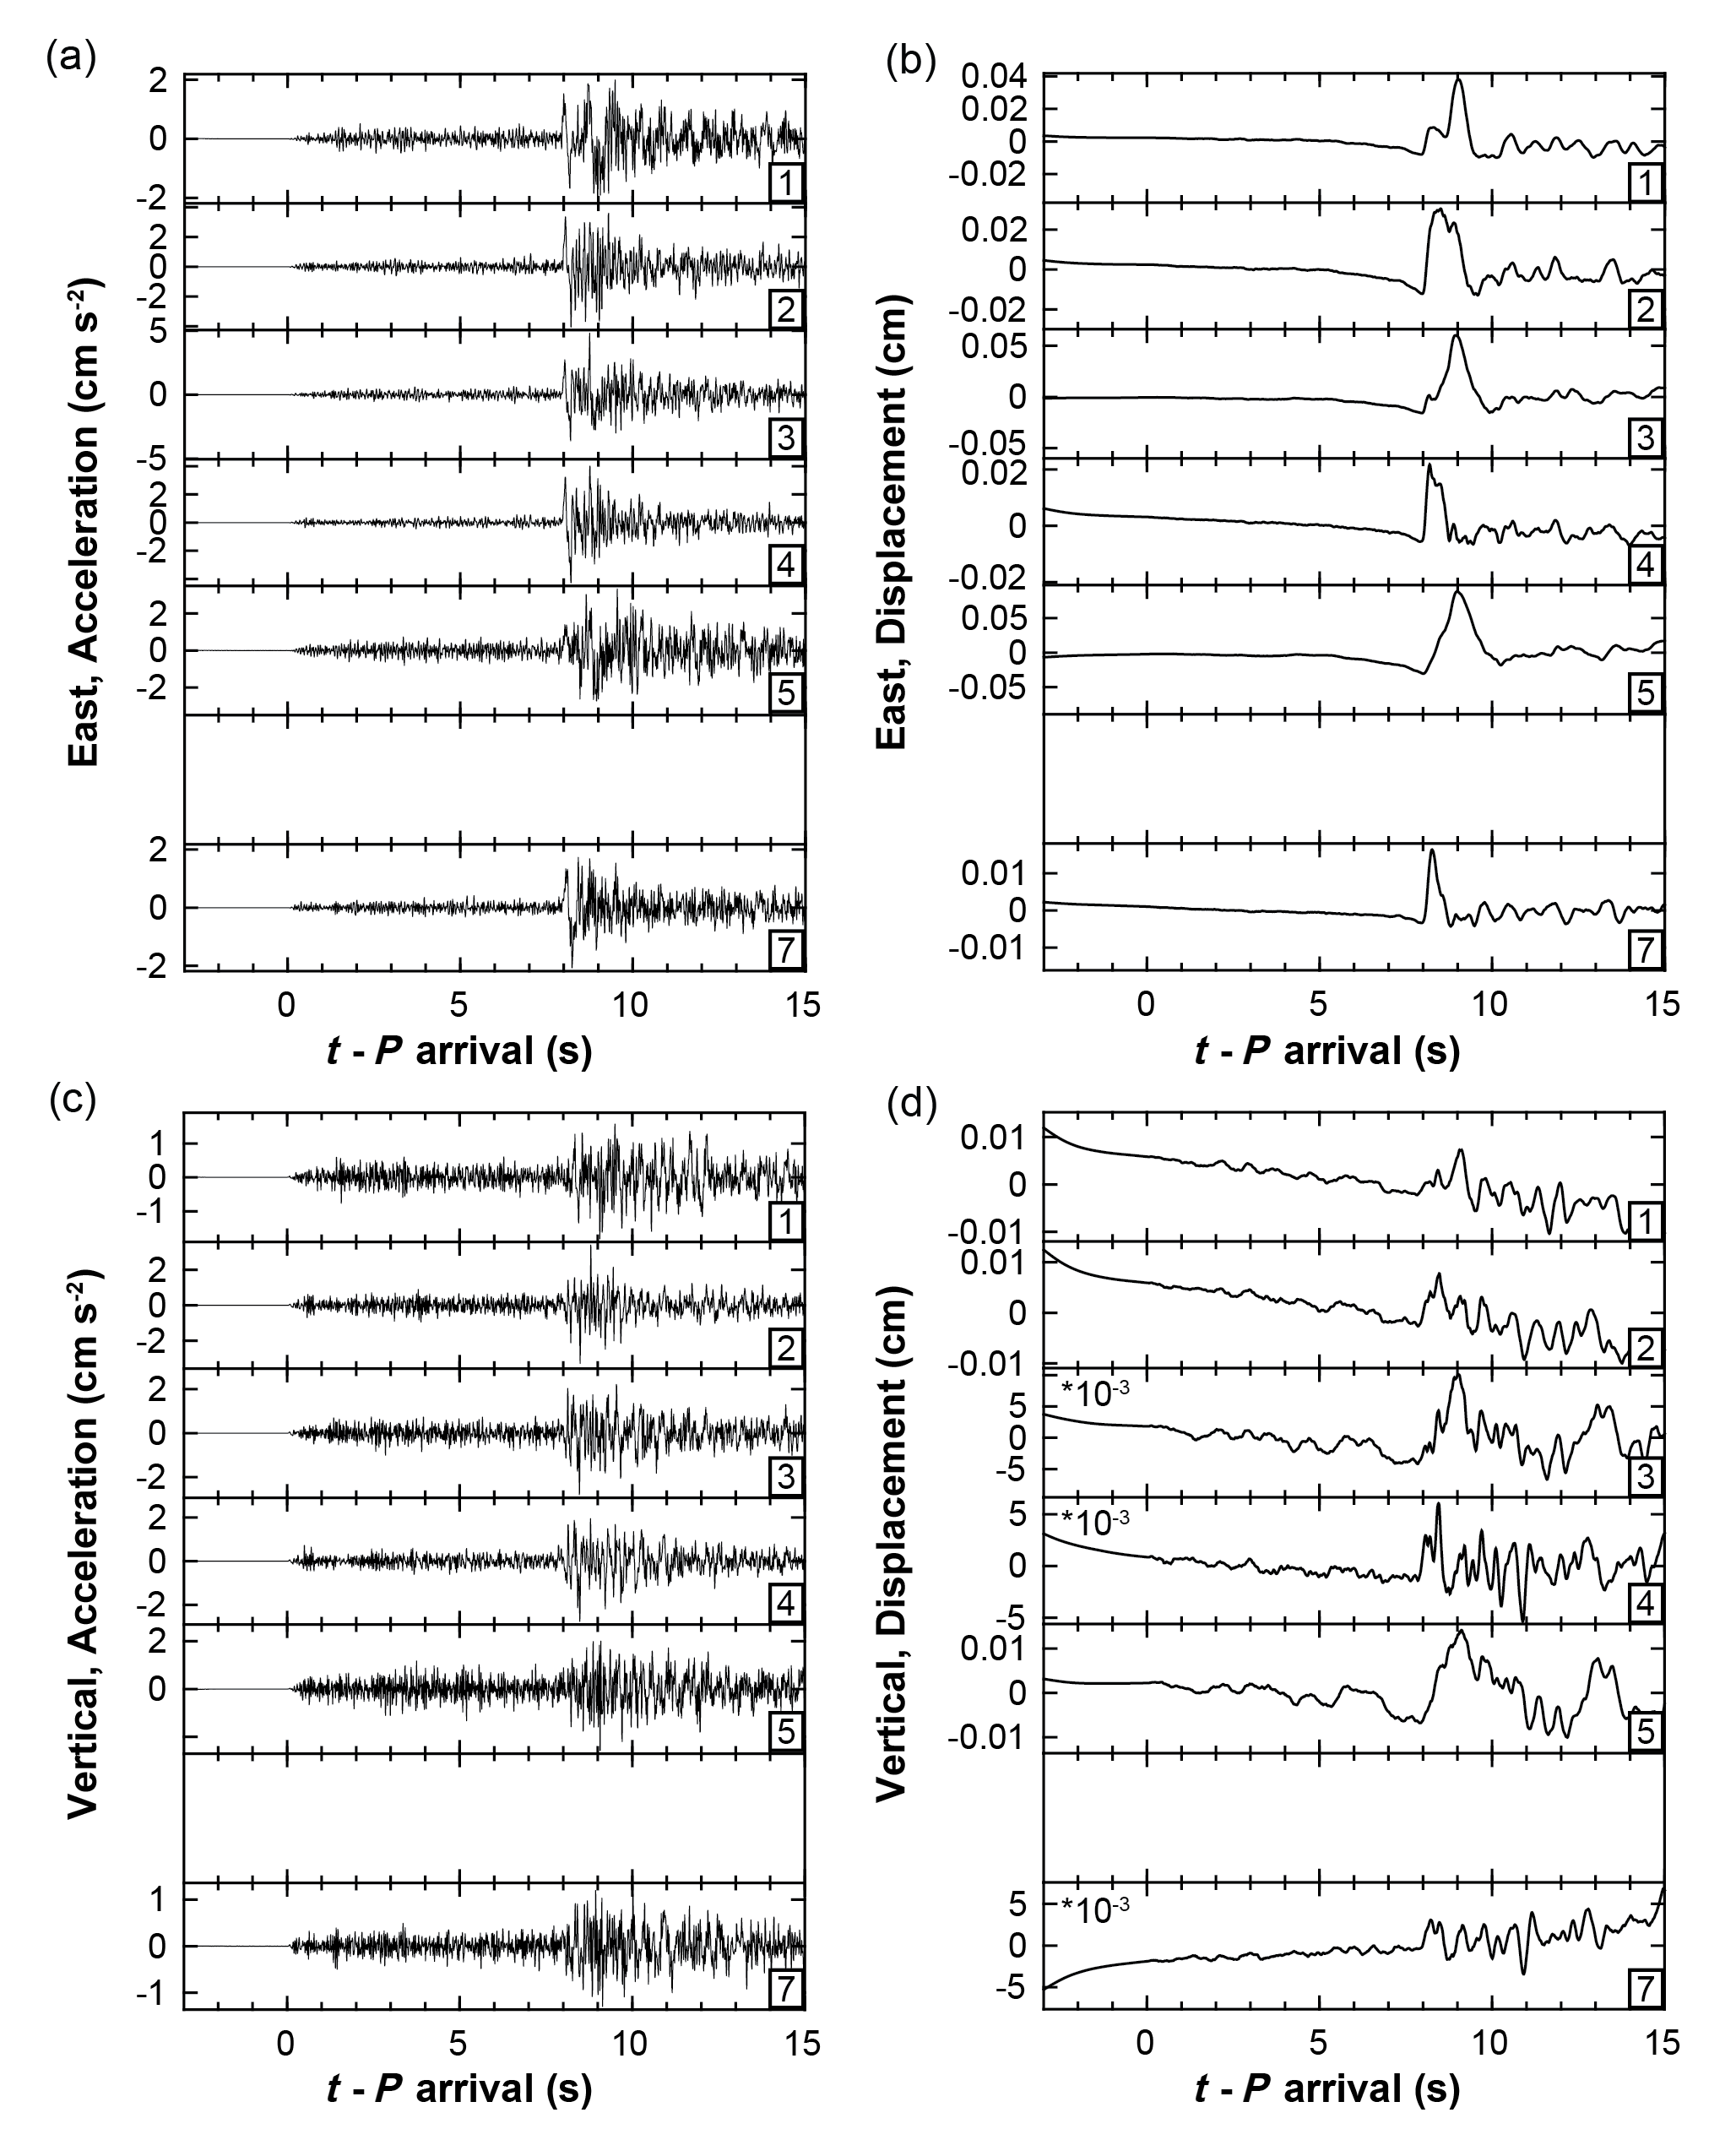
Figure S1. Unfiltered acceleration seismograms at station IWTH04 for the seven earthquakes used in this study, aligned on the P arrival. (a) East component, acceleration, used for S-wave ASTFs. (b) East component, displacement. (c) Vertical component, acceleration, used for P-wave ASTFs. (d) Vertical component, displacement. Clear source pulses are visible on displacement seismograms, on the east component for S, and on the vertical component for P.
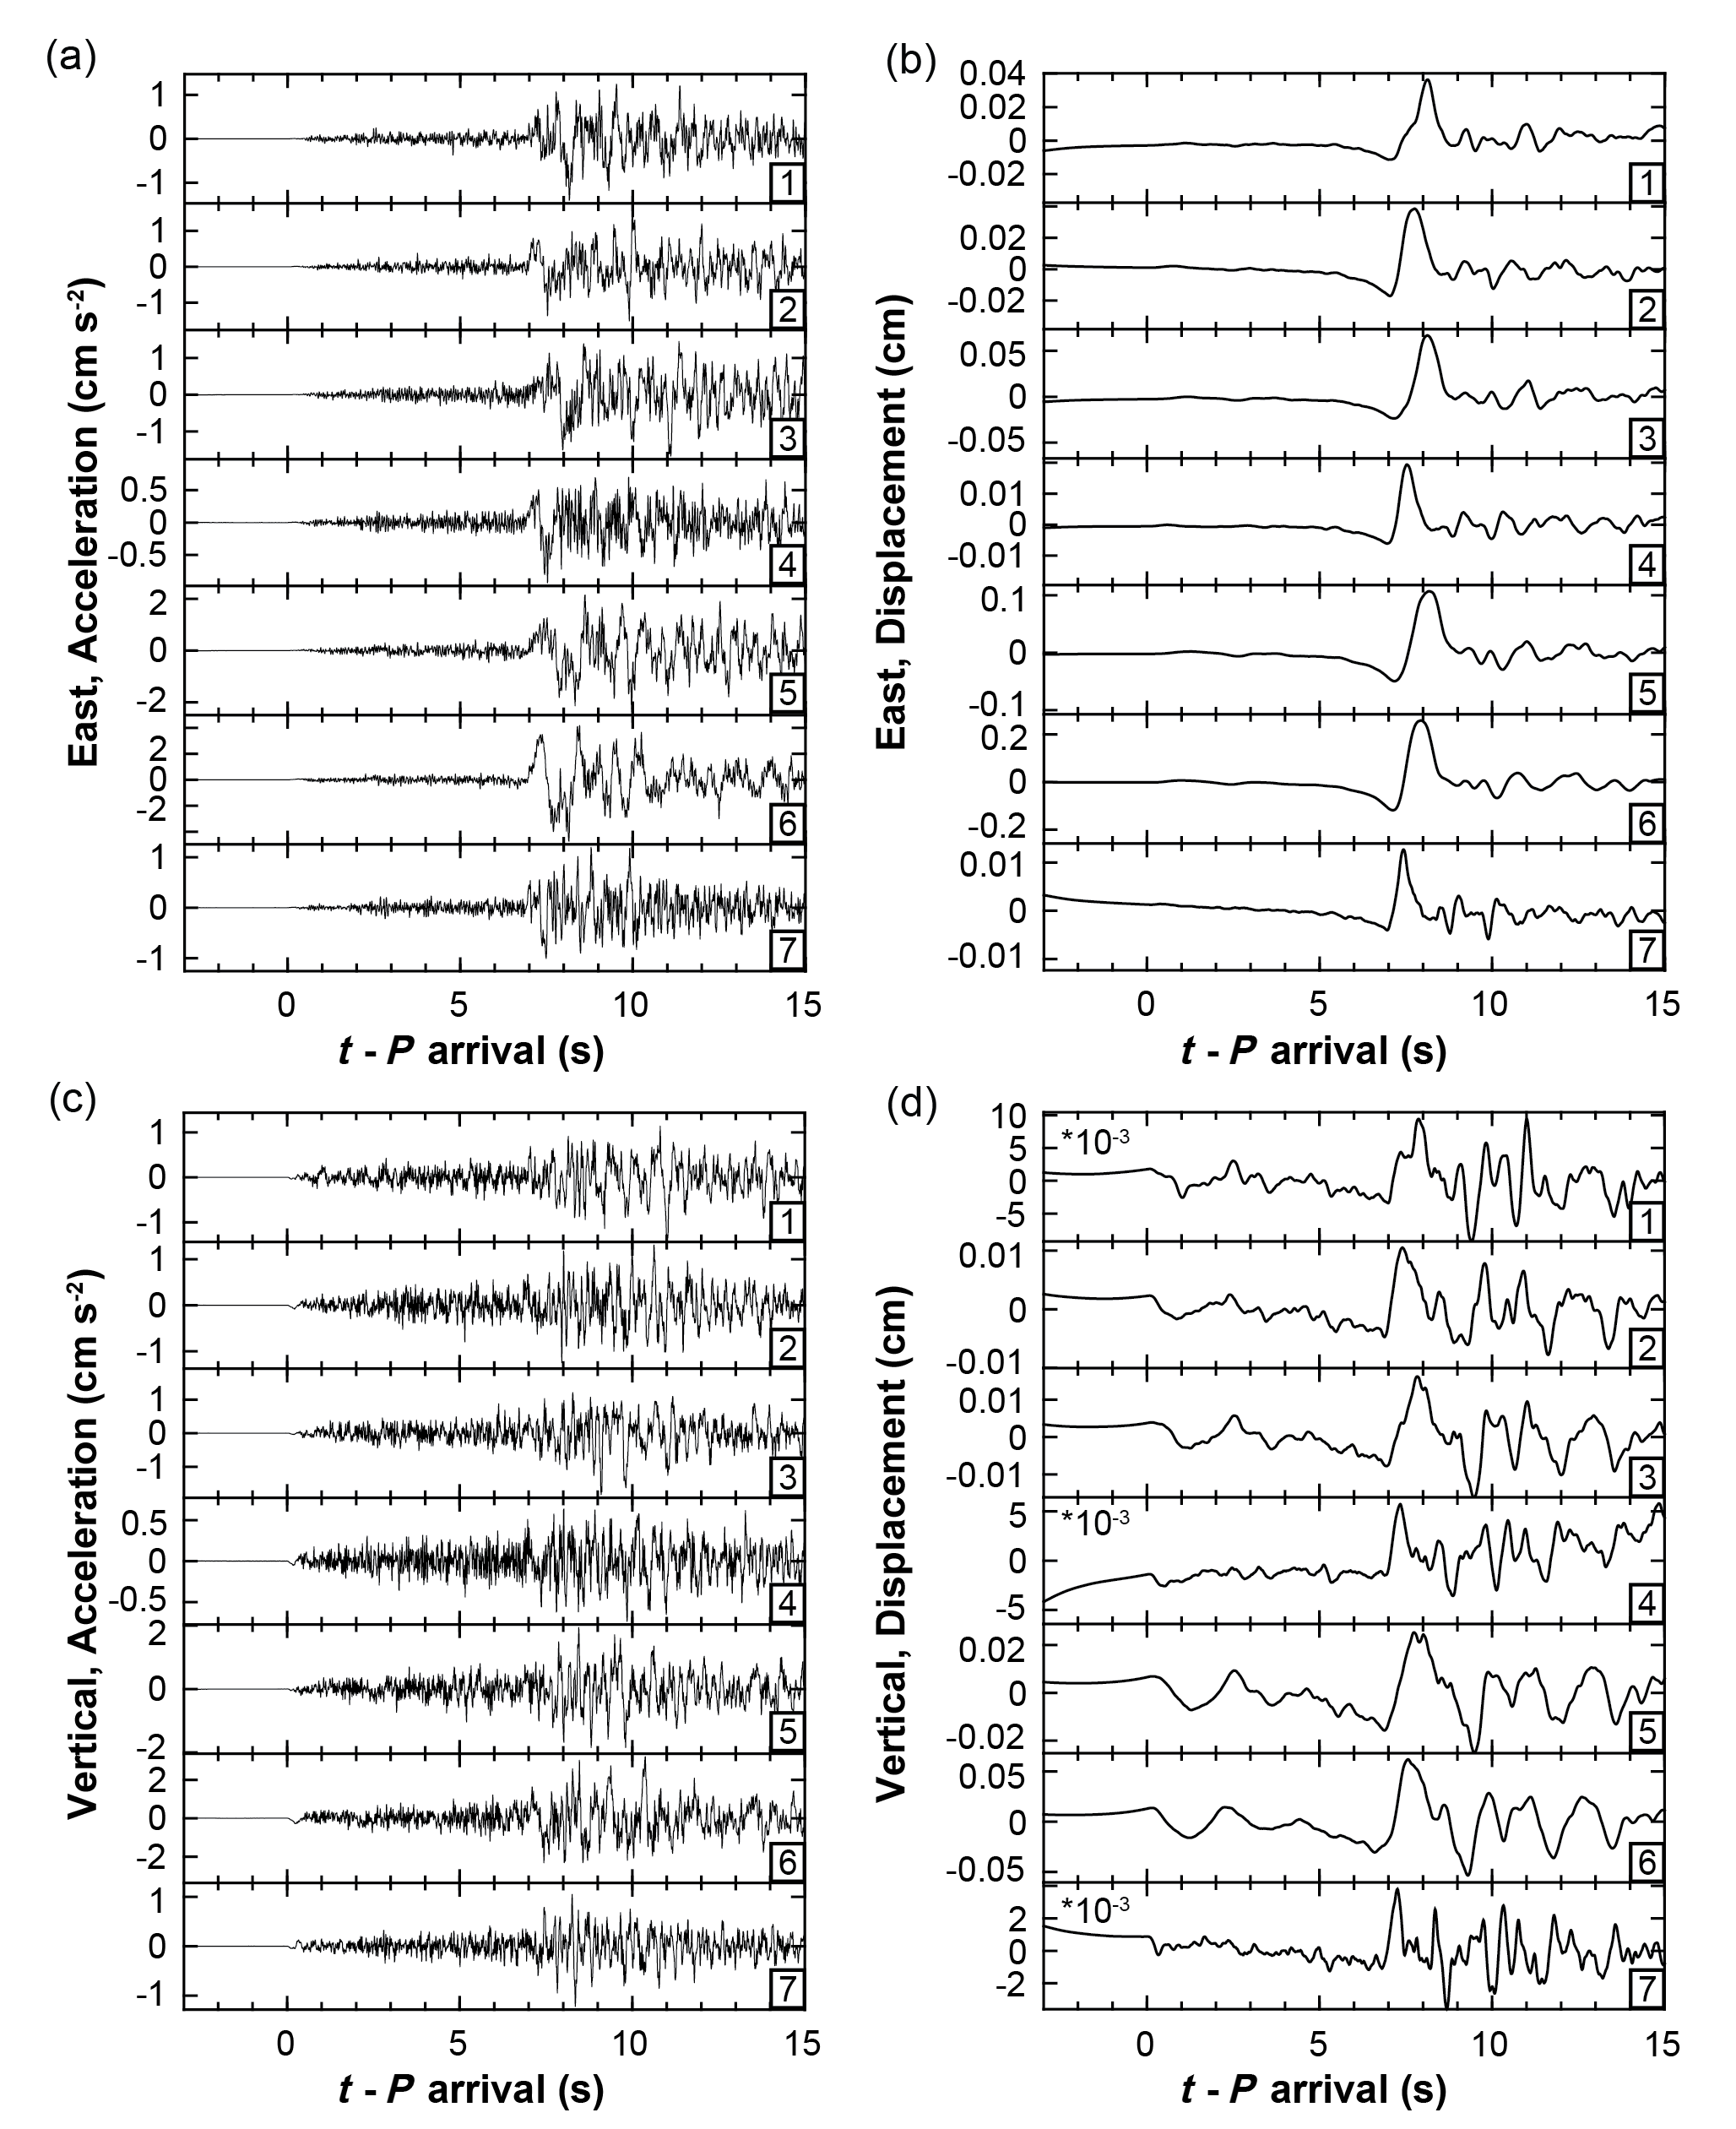
Figure S2. Seismograms at station IWTH14 (see Fig. S1 for details). Source pulses are visible on displacement seismograms, on both components for S, and on the vertical component for P, but they appear smoothed relative to other stations.
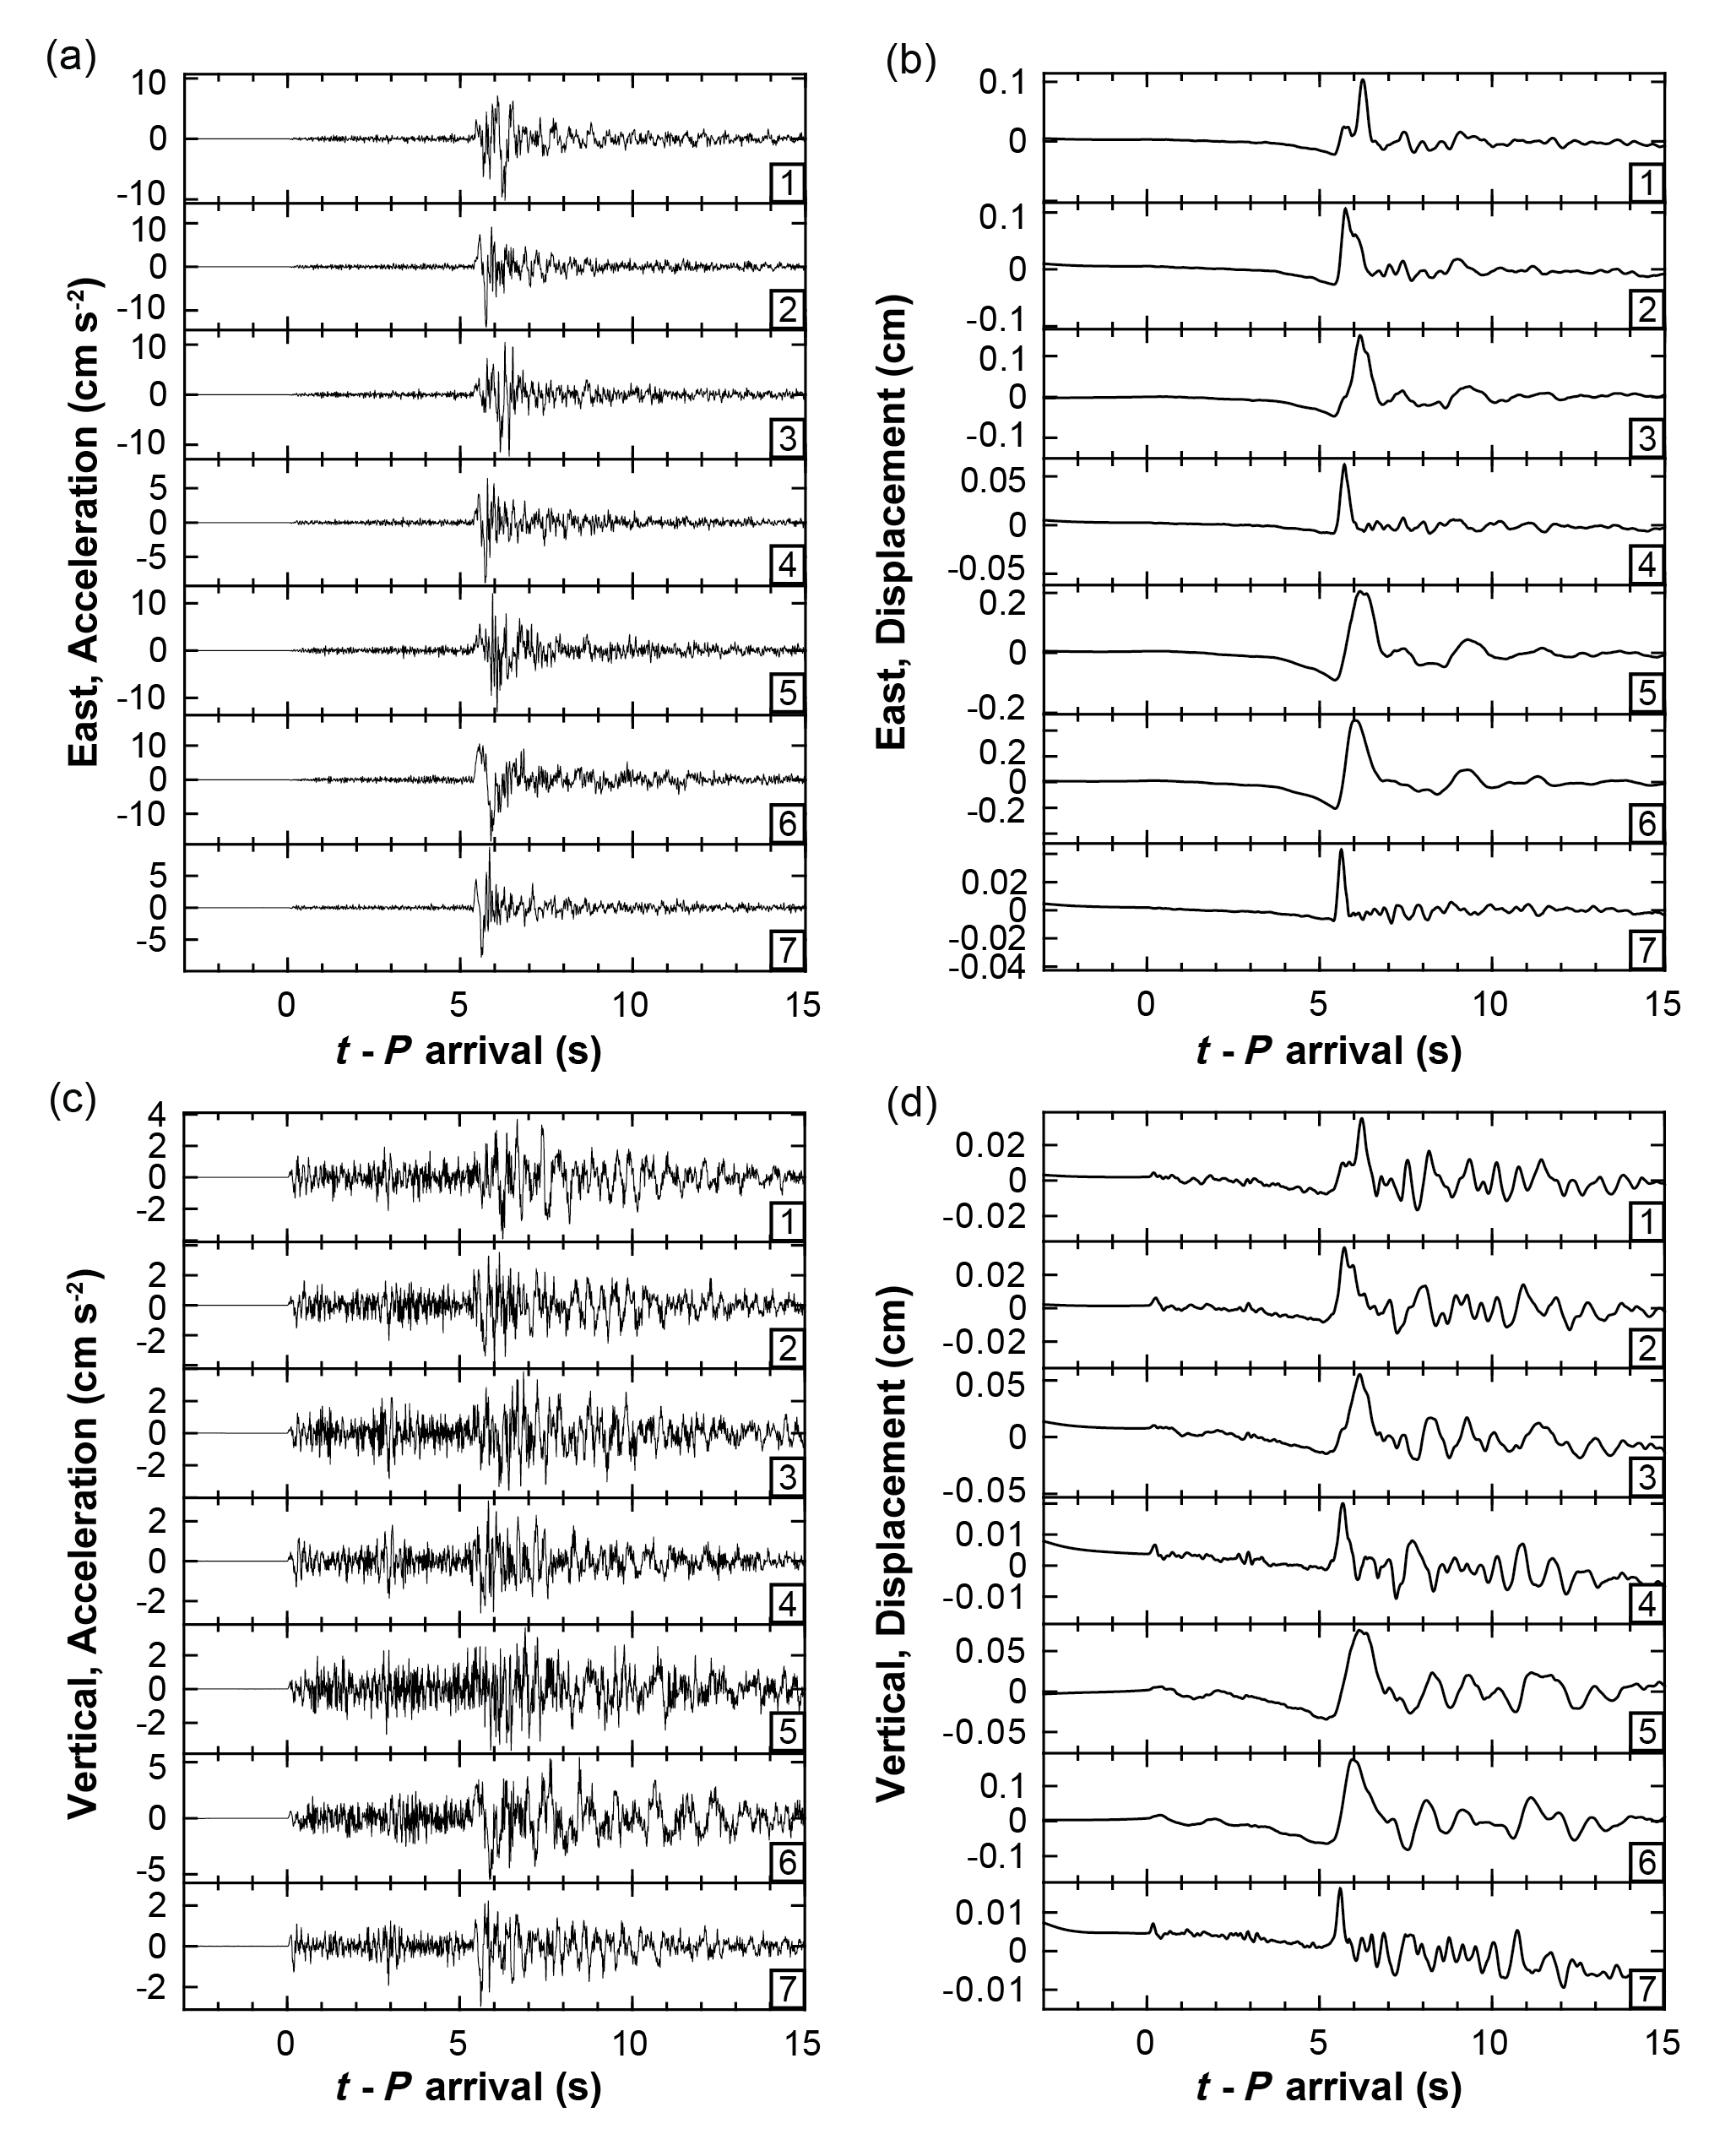
Figure S3. Seismograms at station IWTH21 (see Fig. S1 for details). Clear S source displacement pulses are clearly visible on both components, whereas P source pulses are present on the vertical component but at smaller amplitudes.
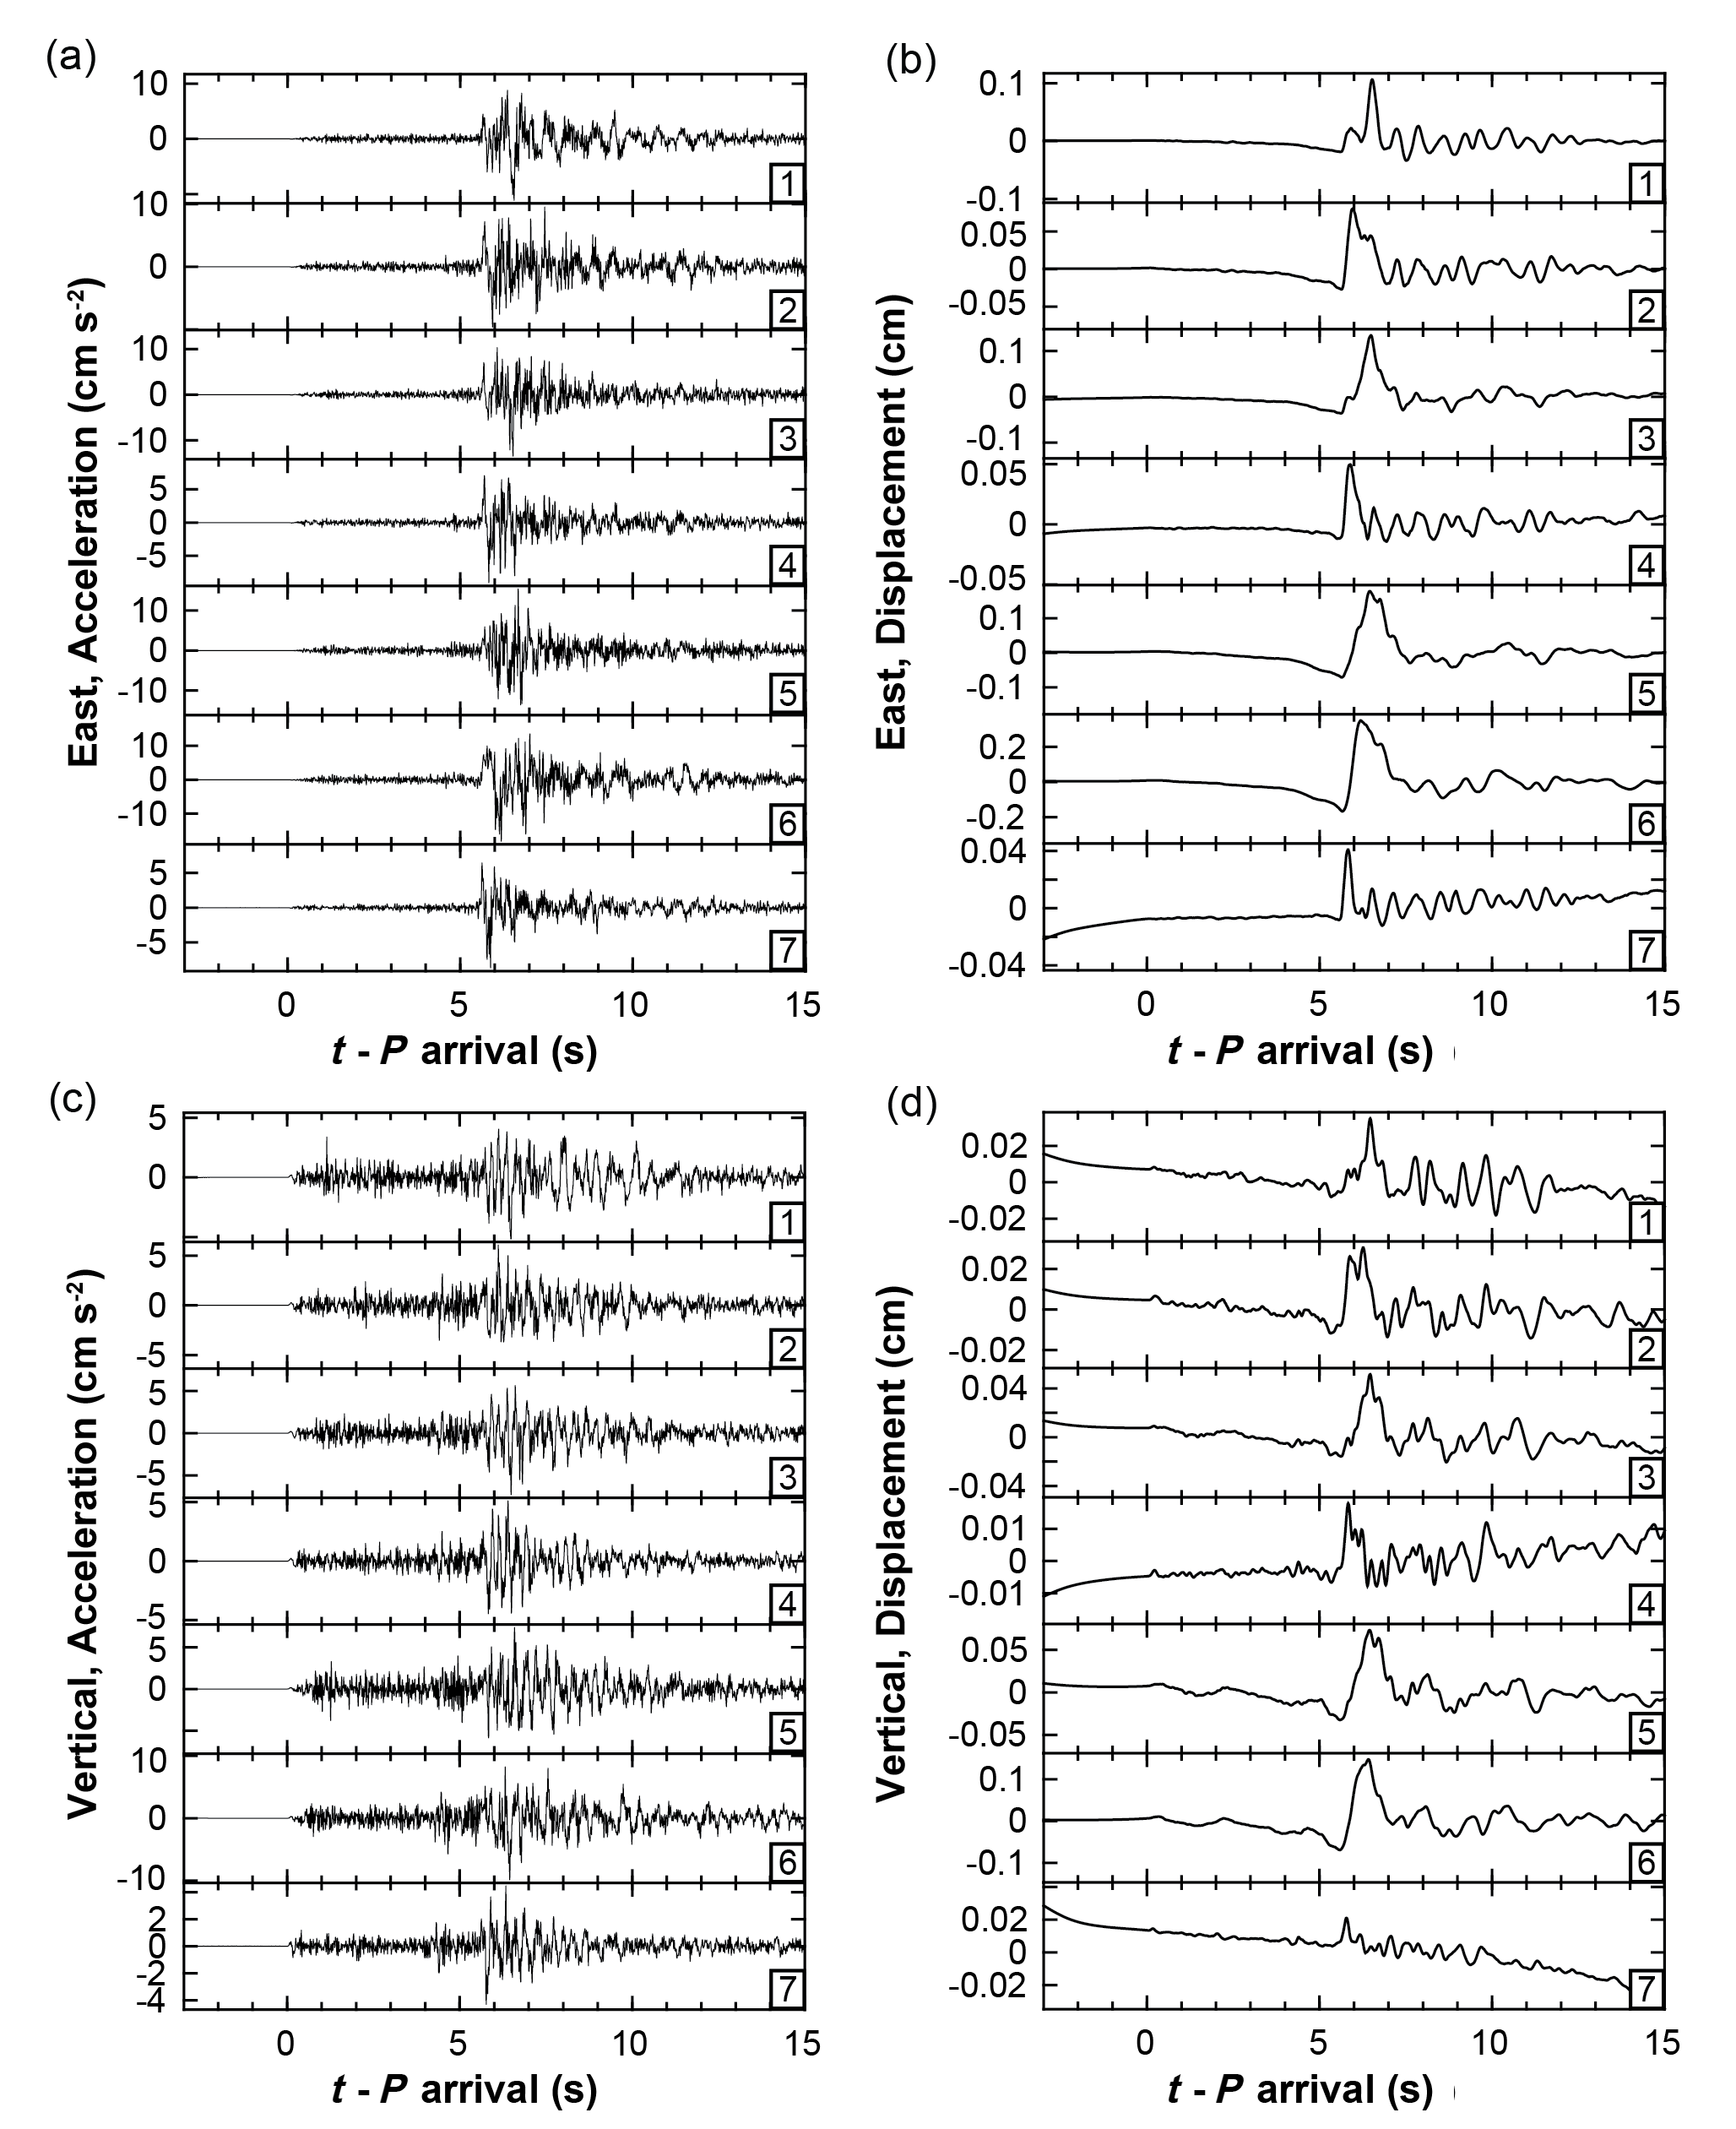
Figure S4. Seismograms at station IWTH23 (see Fig. S1 for details). Clear S source displacement pulses are clearly visible on both components, but P displacement waveforms have much smaller amplitudes without clear source pulses.
Figure S5. Seismograms at station MYGH03 (see Fig. S1 for details). Clear S source displacement pulses are clearly visible on the east component, but P displacement waveforms have much smaller amplitudes without clear source pulses.
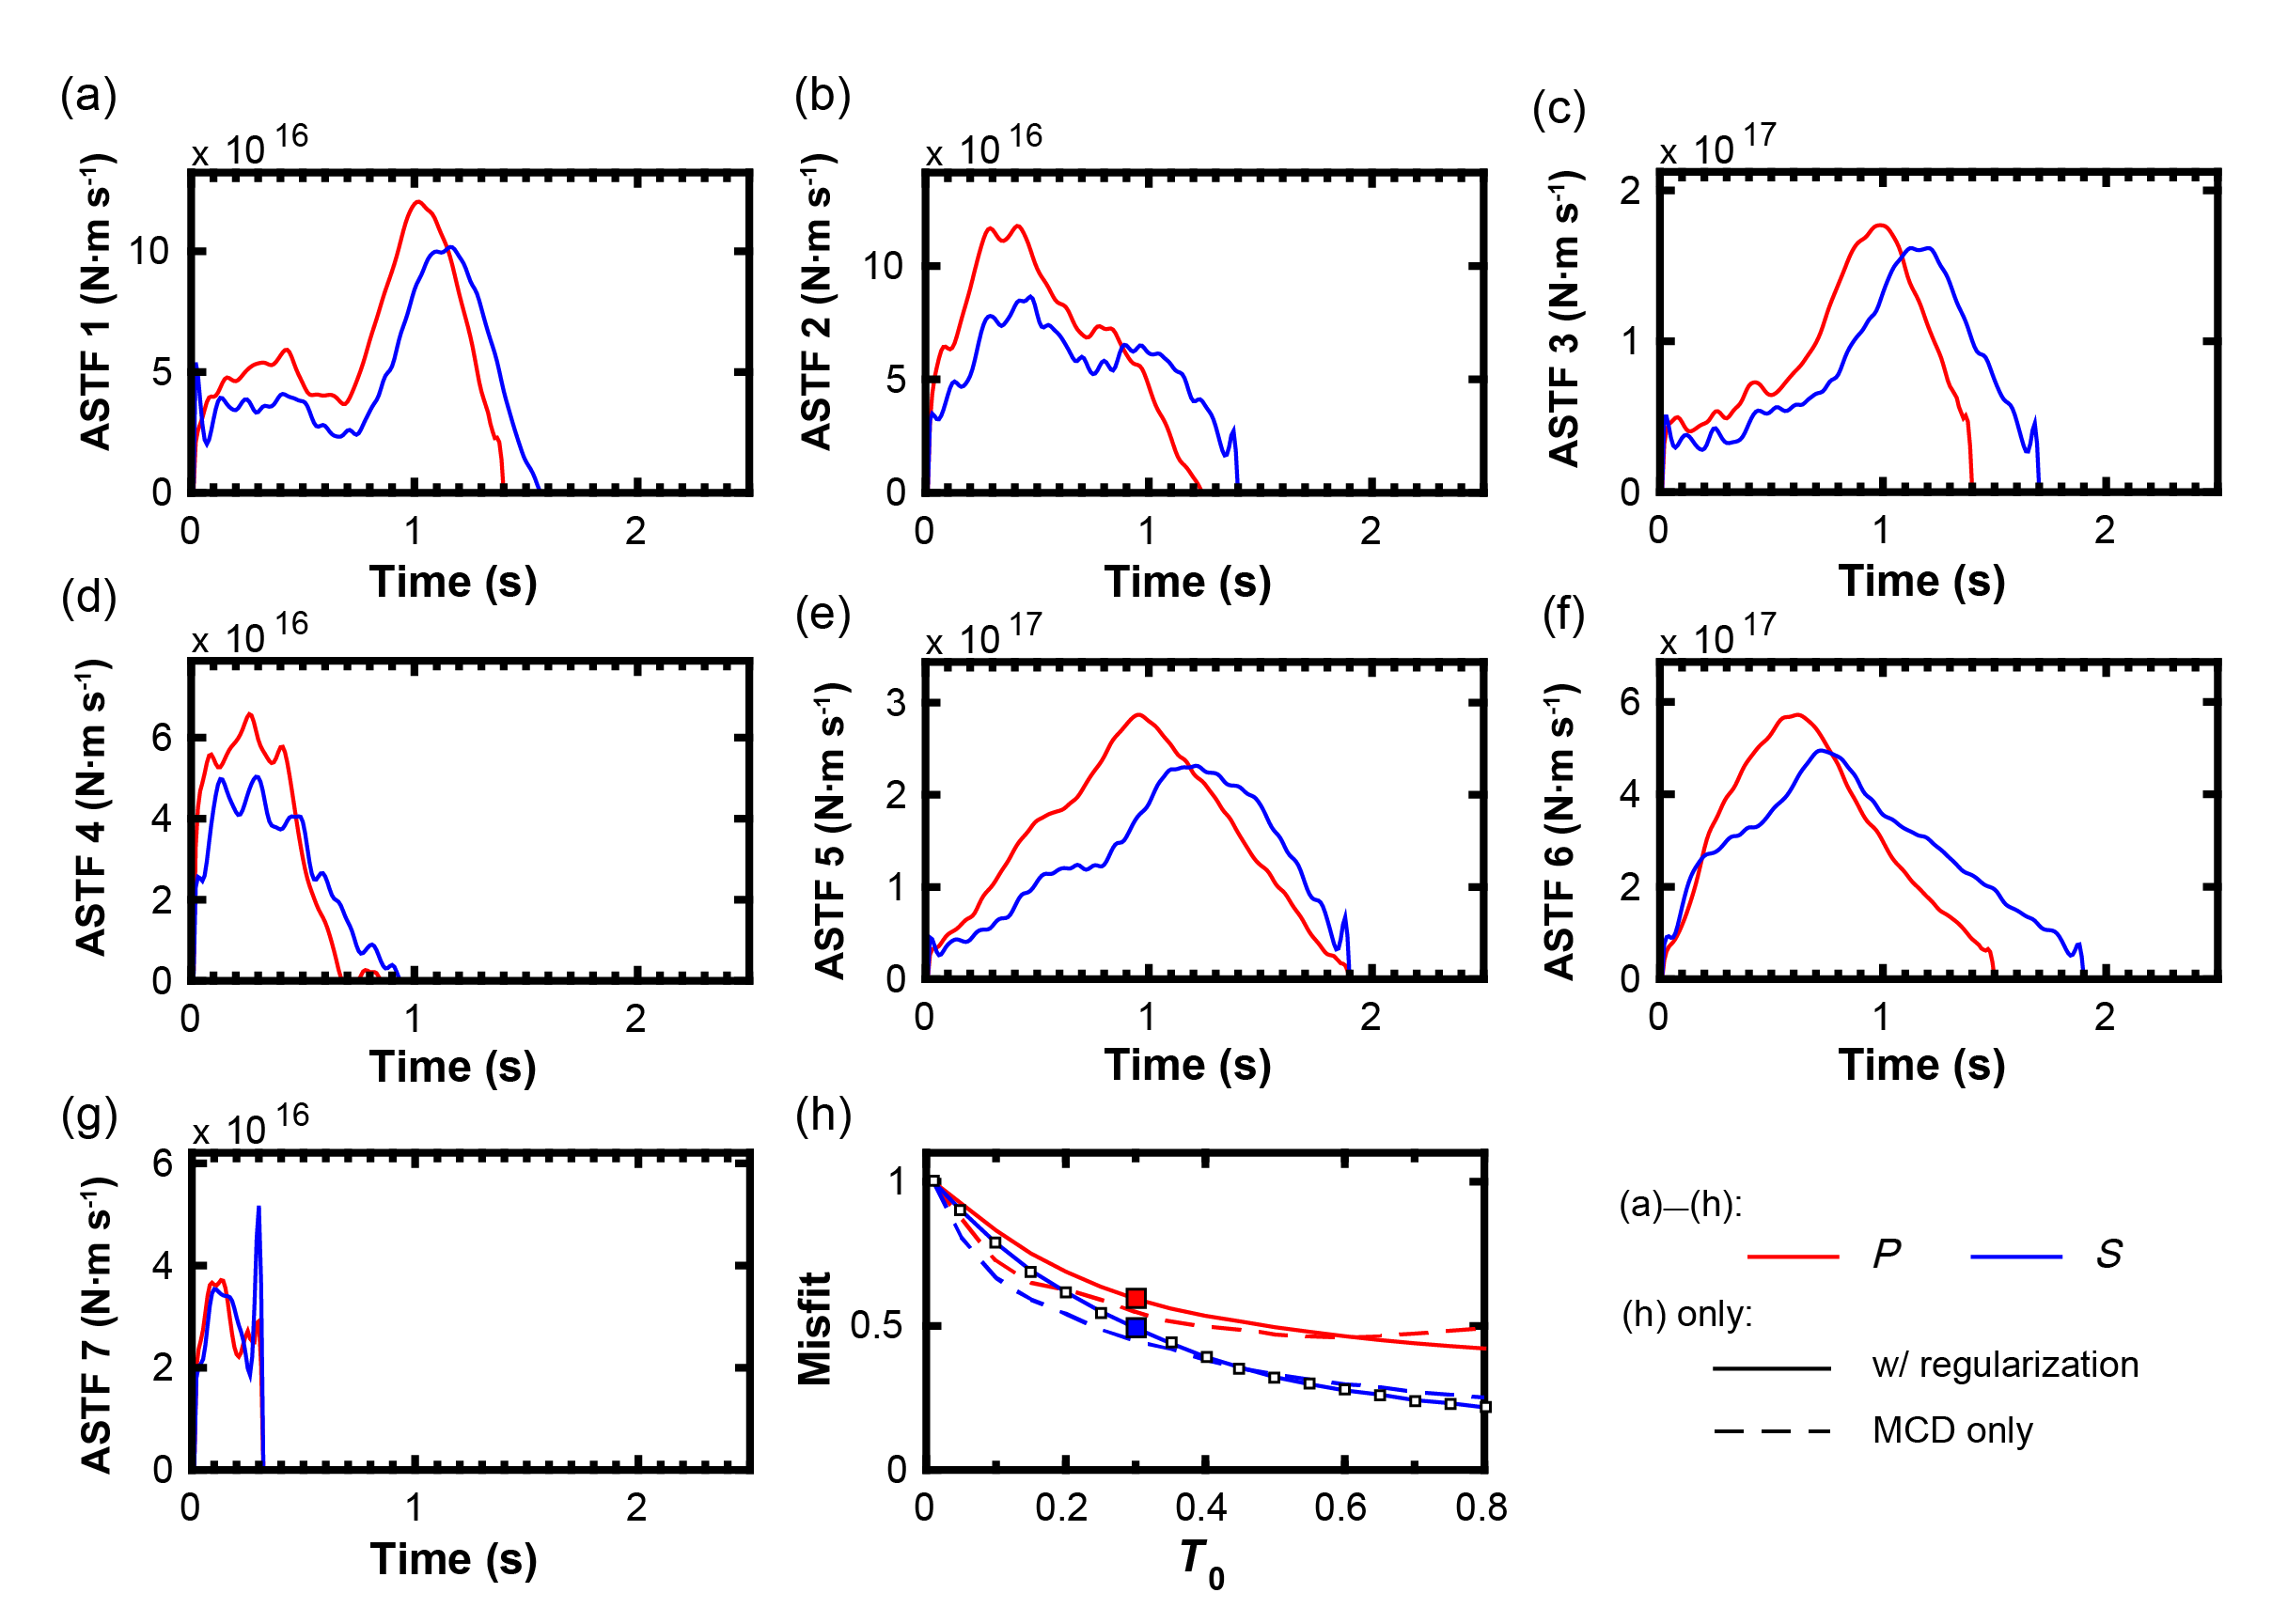
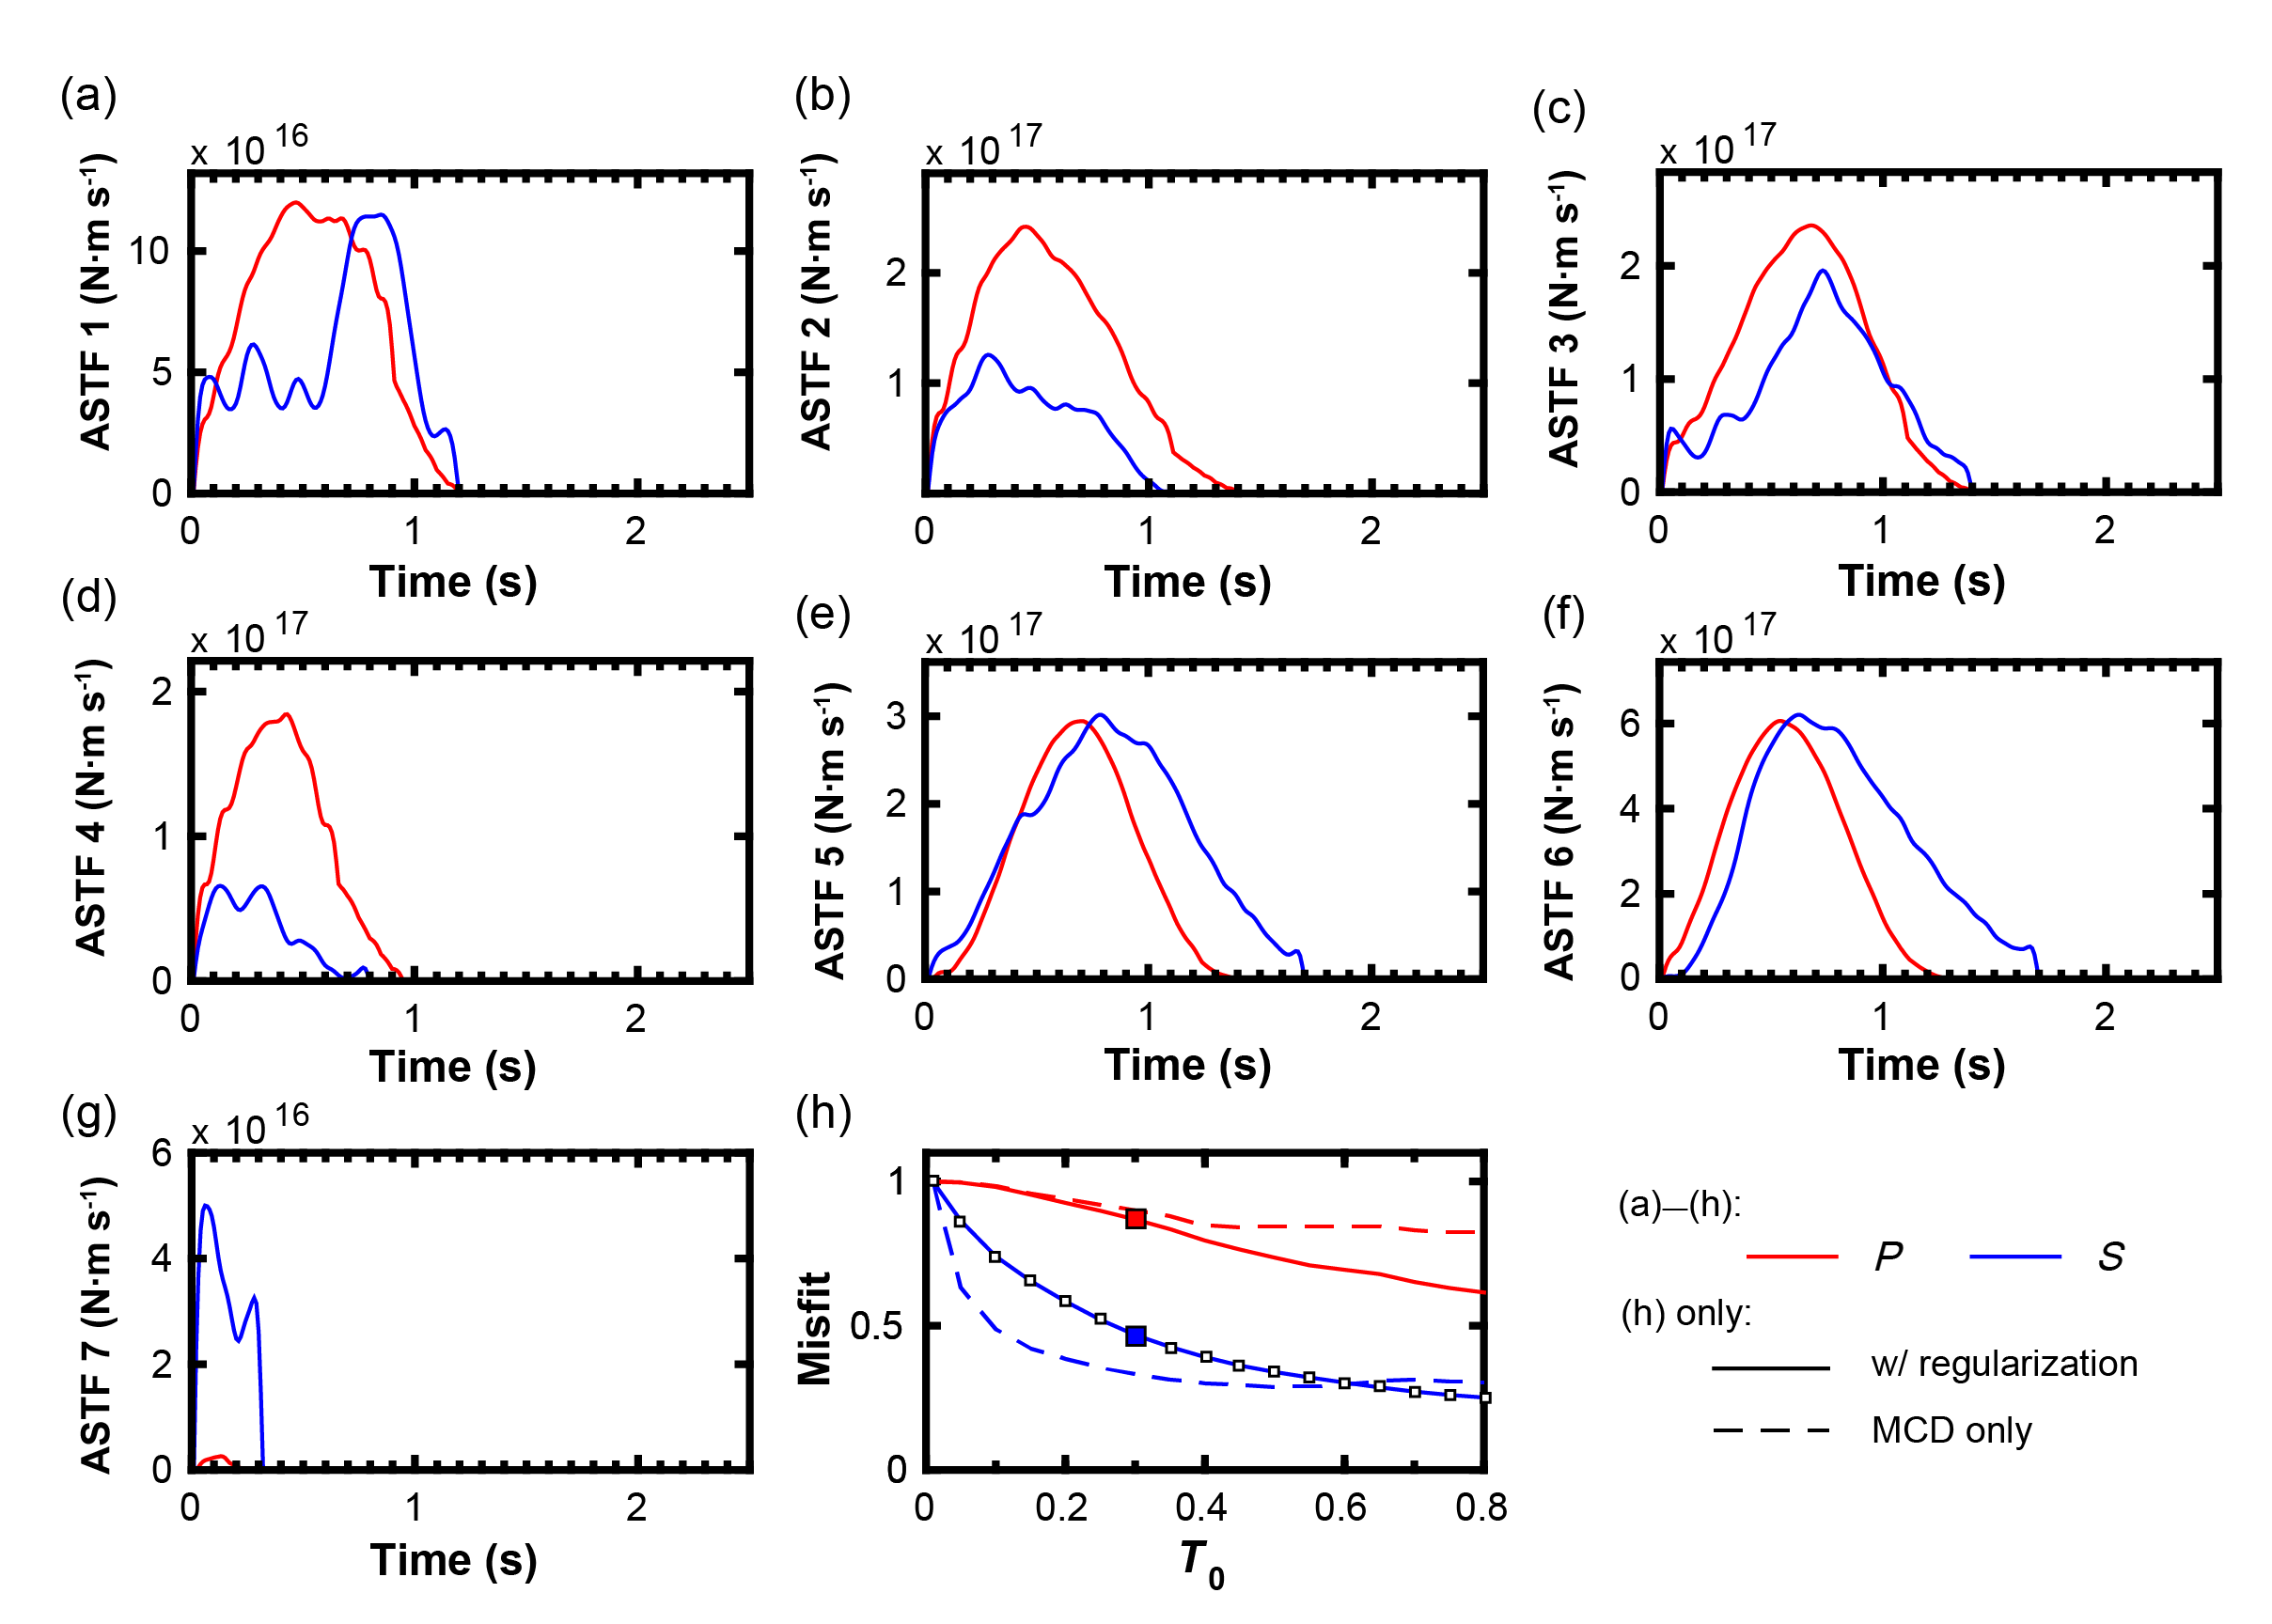
Figure S6. MCD ASTFs at station IWTH04. (a)–(g) ASTFs for the seven earthquakes recovered by MCD following empirical Green’s function (EGF) deconvolution. Event 7 was used as the EGF. (h) Relative ΦMCD versus T0 (solid lines), the allowed duration of ASTF 7. ASTFs 1–6 had allowed durations of T0 plus their selected duration from the EGF problem. Dashed lines indicate the mean relative value of || Ui ∗ Sj − Uj ∗ Si ||2, which should be a similar value to ΦMCD but ignoring regularization. For both P and S inversions, we choose T0 = 0.30 s, highlighted with larger squares.
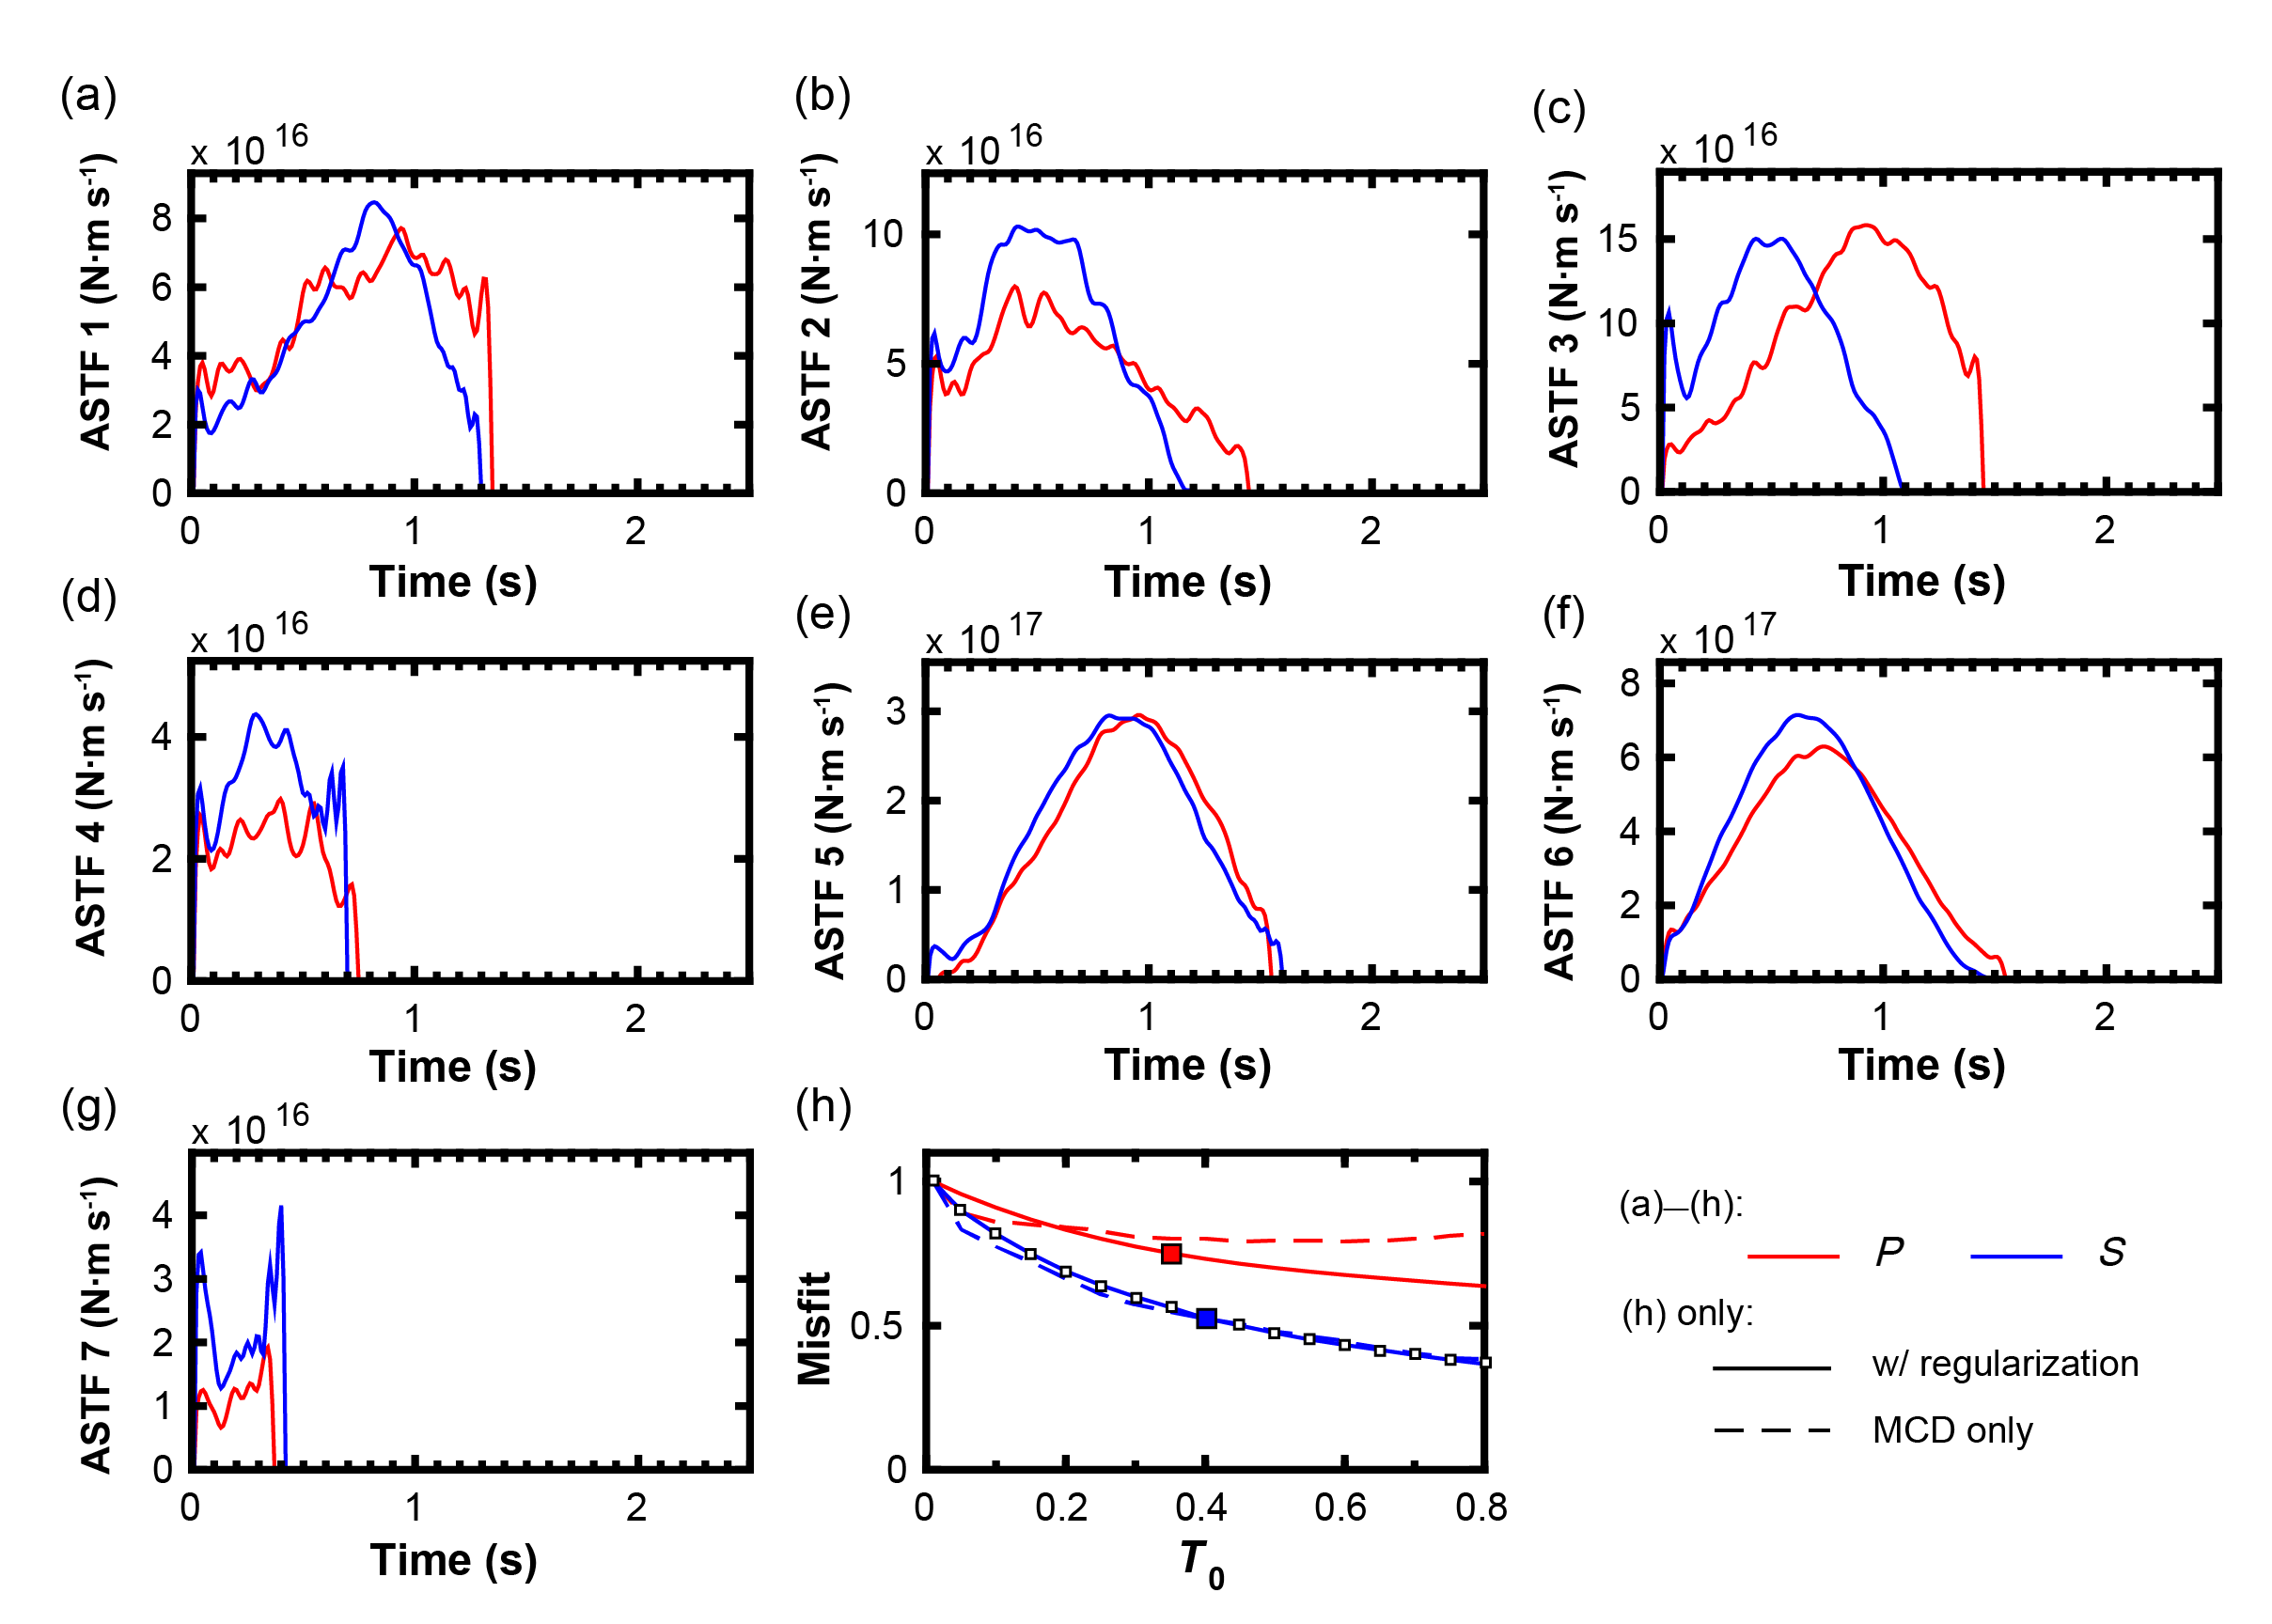
Figure S7. MCD ASTFs at station IWTH14 (see Fig. S6 for details). We select T0 = 0.35 s for P ASTFs and T0 = 0.40 s for S ASTFs, highlighted with larger squares.
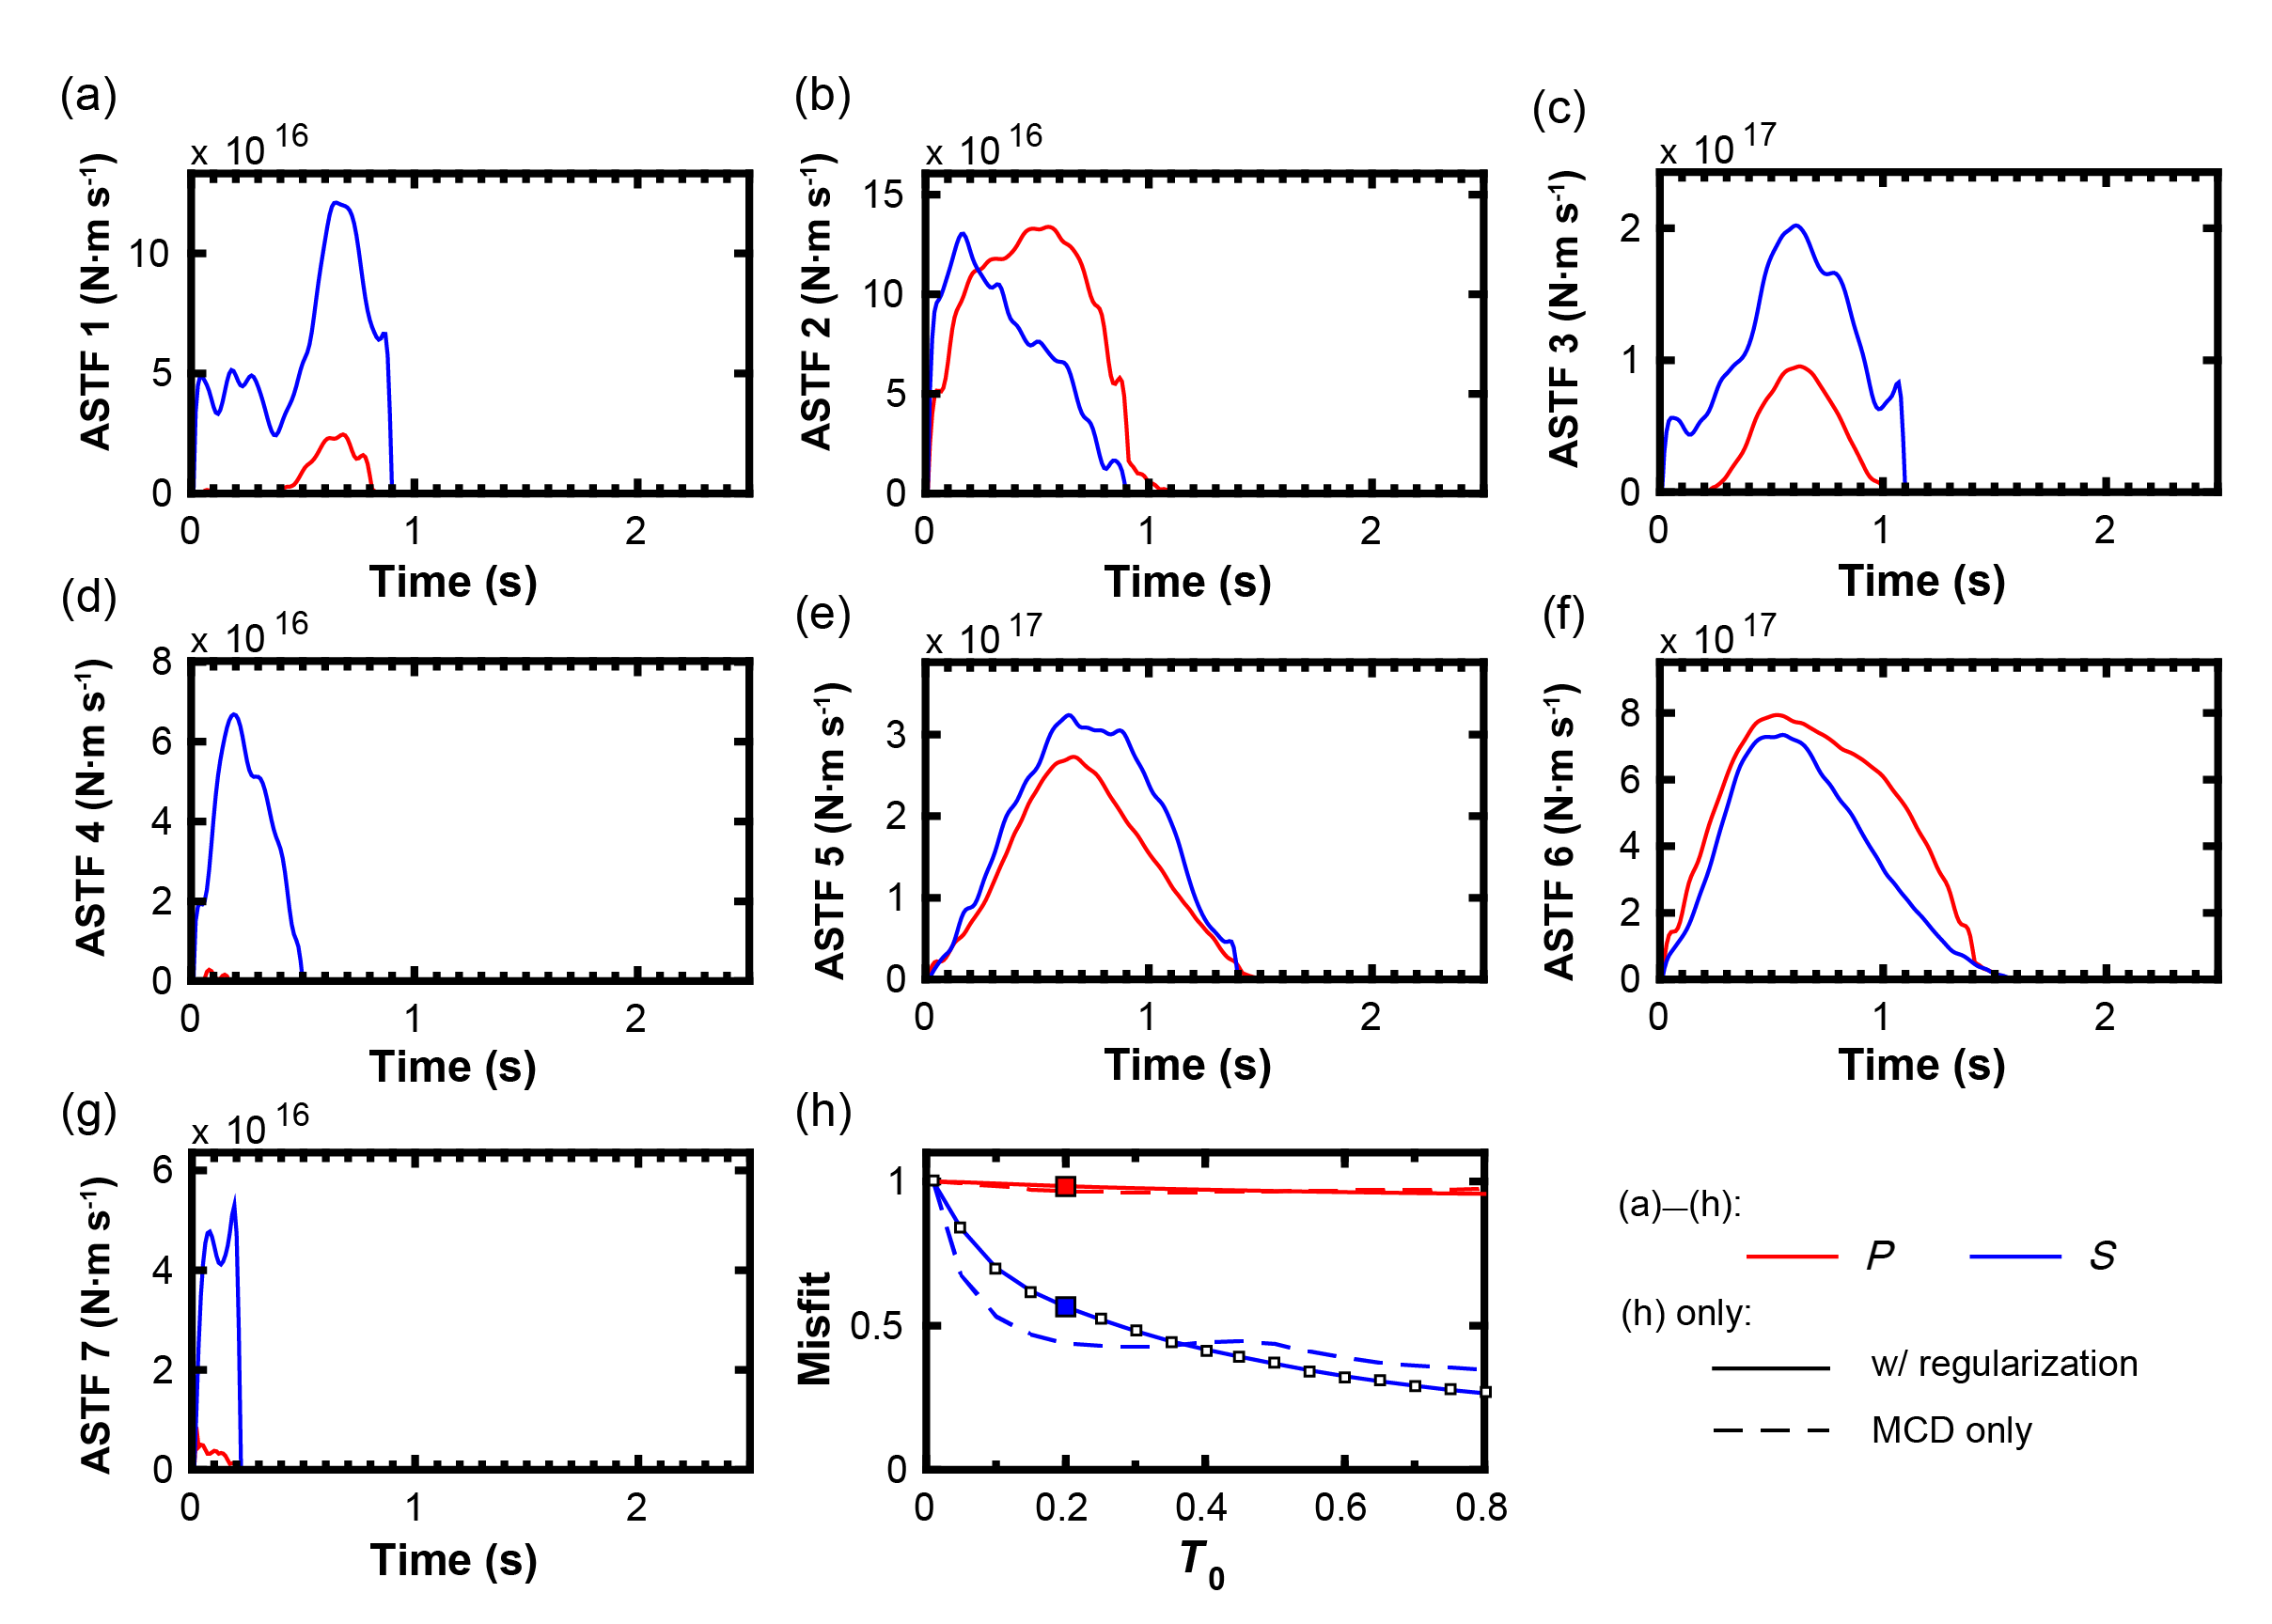
Figure S8. MCD ASTFs at station IWTH21 (see Fig. S6 for details). For both P and S inversions we choose T0 = 0.20 s, highlighted with larger squares. The inversion for P ASTFs resulted in effectively zero misfit improvement from the EGF solution; this is likely due to low signal-to-noise ratio (SNR) on the low-amplitude P waveforms.
Figure S9. MCD ASTFs at station IWTH23 (see Fig. S6 for details). For both P and S inversions, we choose T0 = 0.30 s, highlighted with larger squares. The inversion for P ASTFs resulted in only minor misfit improvement, likely because of low SNR.
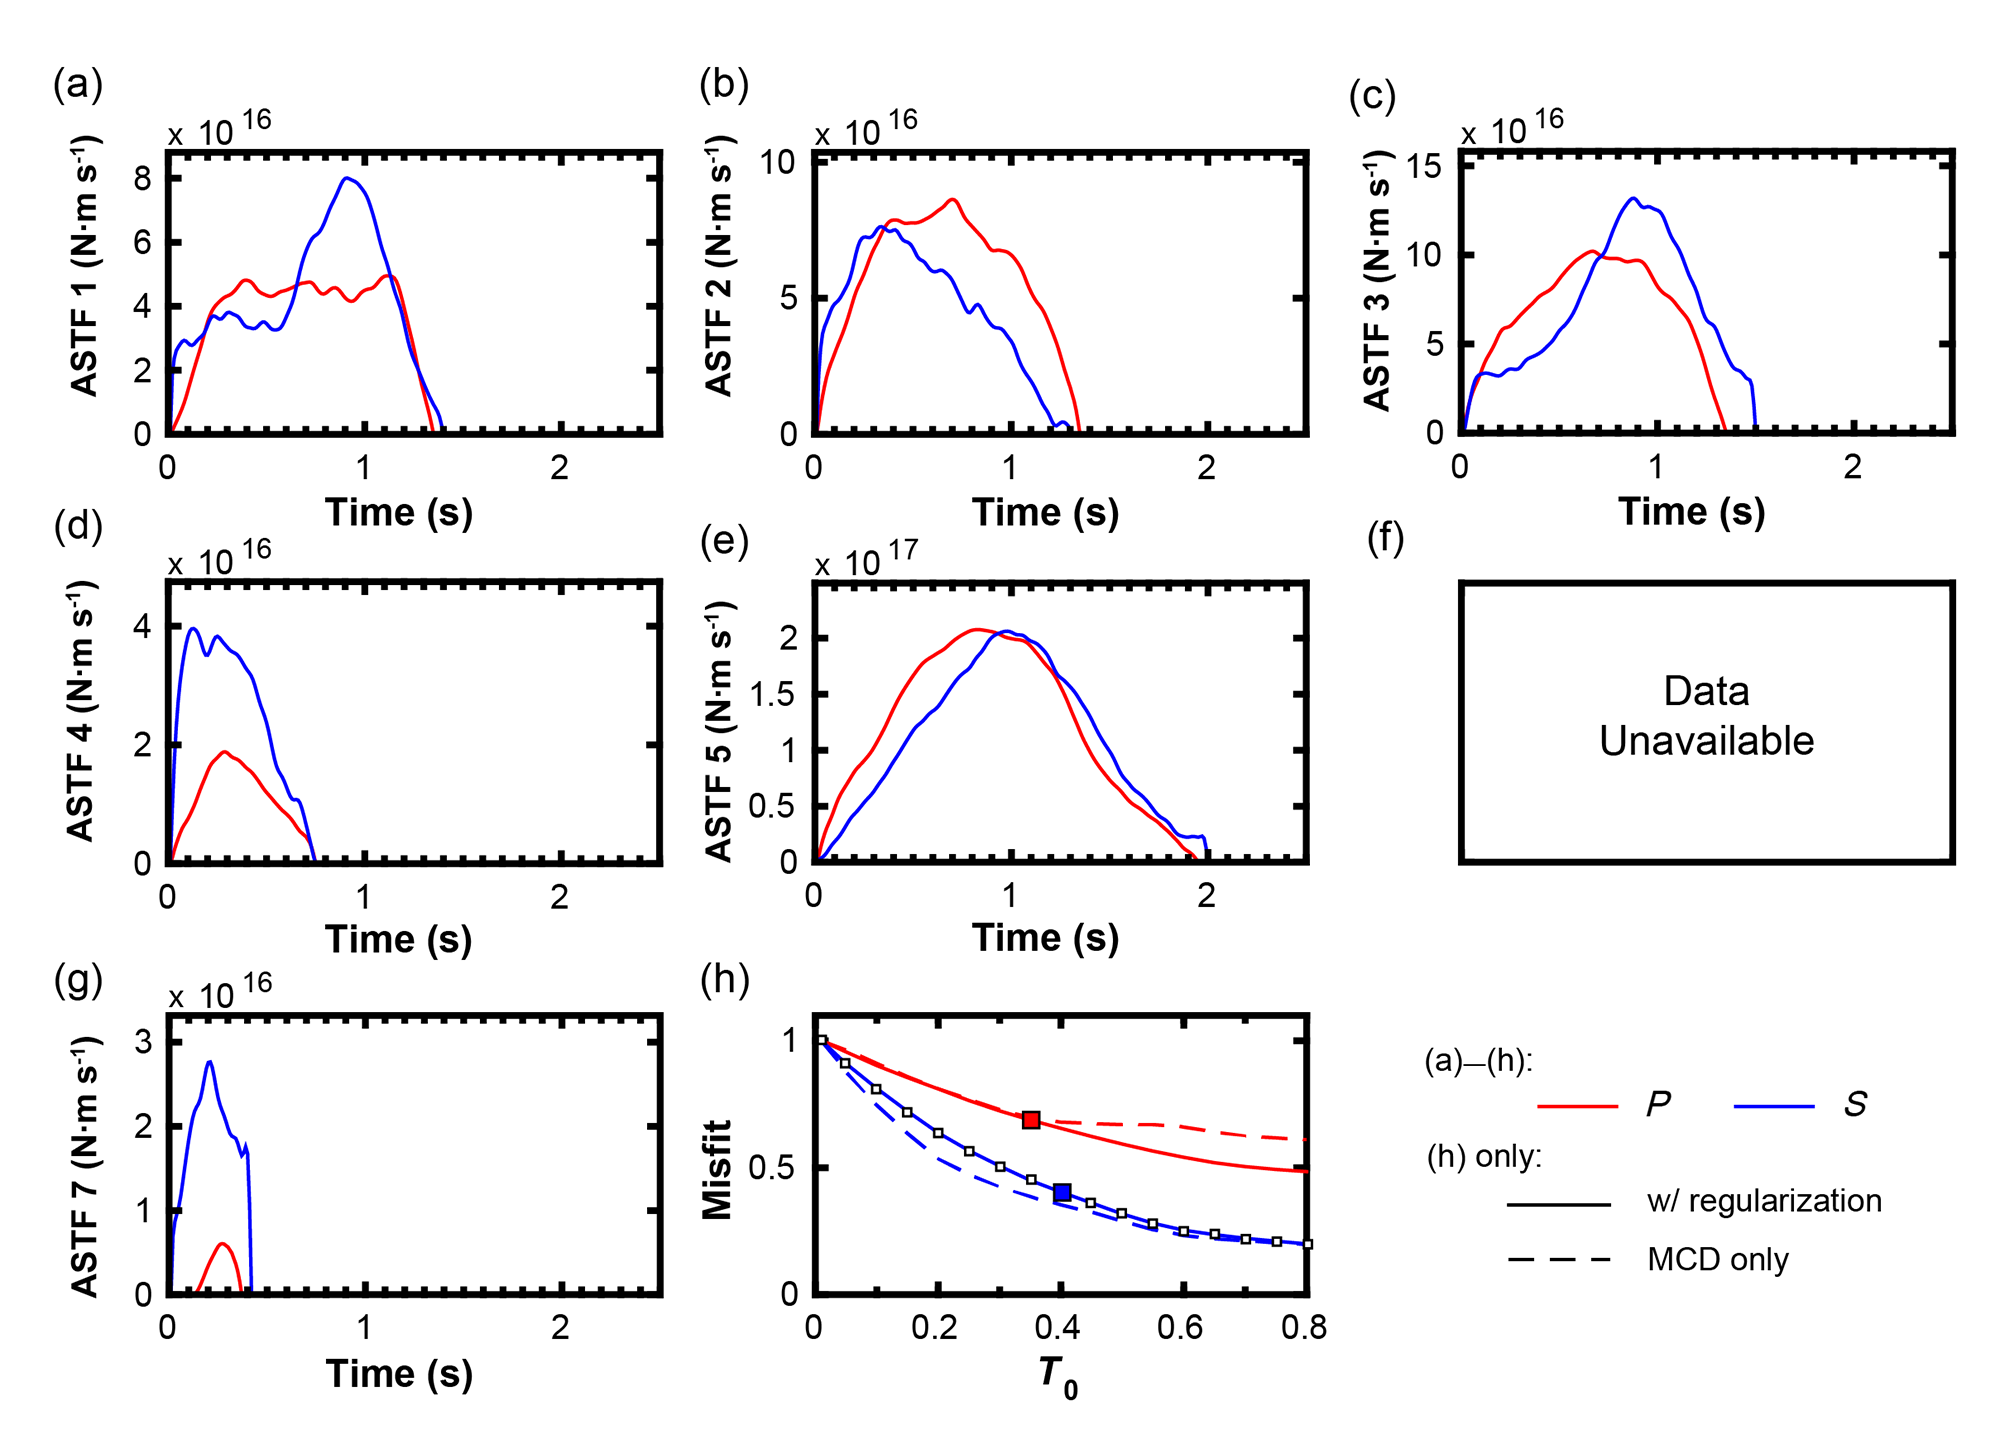
Figure S10. MCD ASTFs at station MYGH03 (see Fig. S6 for details). We select T0 = 0.35 s for P ASTFs and T0 = 0.40 s for S ASTFs, highlighted with larger squares. Waveforms of event 6 were not available for MYGH03, so only six events were included. The inversion for P ASTFs resulted in less misfit improvement than for S, likely because of lower SNR.
[ Back ]