In this supplement, we provide higher resolution versions of several figures from the manuscript (Figures 3, 5, and 6) and in addition we include map-view slices through the 3D Vp model. To facilitate studies by others utilizing our results, we also provide tables of our P wavespeed model, absolute and double-difference event locations, and a complete list of stations used and their coordinates along with the station corrections we derived.
Figures
Figure ES1. (High-resolution version of Figure 3 in the paper) Fault-normal cross-sections from Y = -21 km
(northwest) to Y = 30 km (southeast). Vp is shown by black contours (labeled with km/s) and colors from
red (slow) to blue (fast). The white dashed contours show the limits of the region where the model is well
resolved (resolution diagonal element > 0.4). Black circles are hypocenters of the earthquakes used in the Vp
model inversion that are less than half the distance in the X direction to the adjacent section.
Figure ES1a-c [~2.1 MB]
Figure ES1d-f [~2.1 MB]
Figure ES1g-i [~2.0 MB]
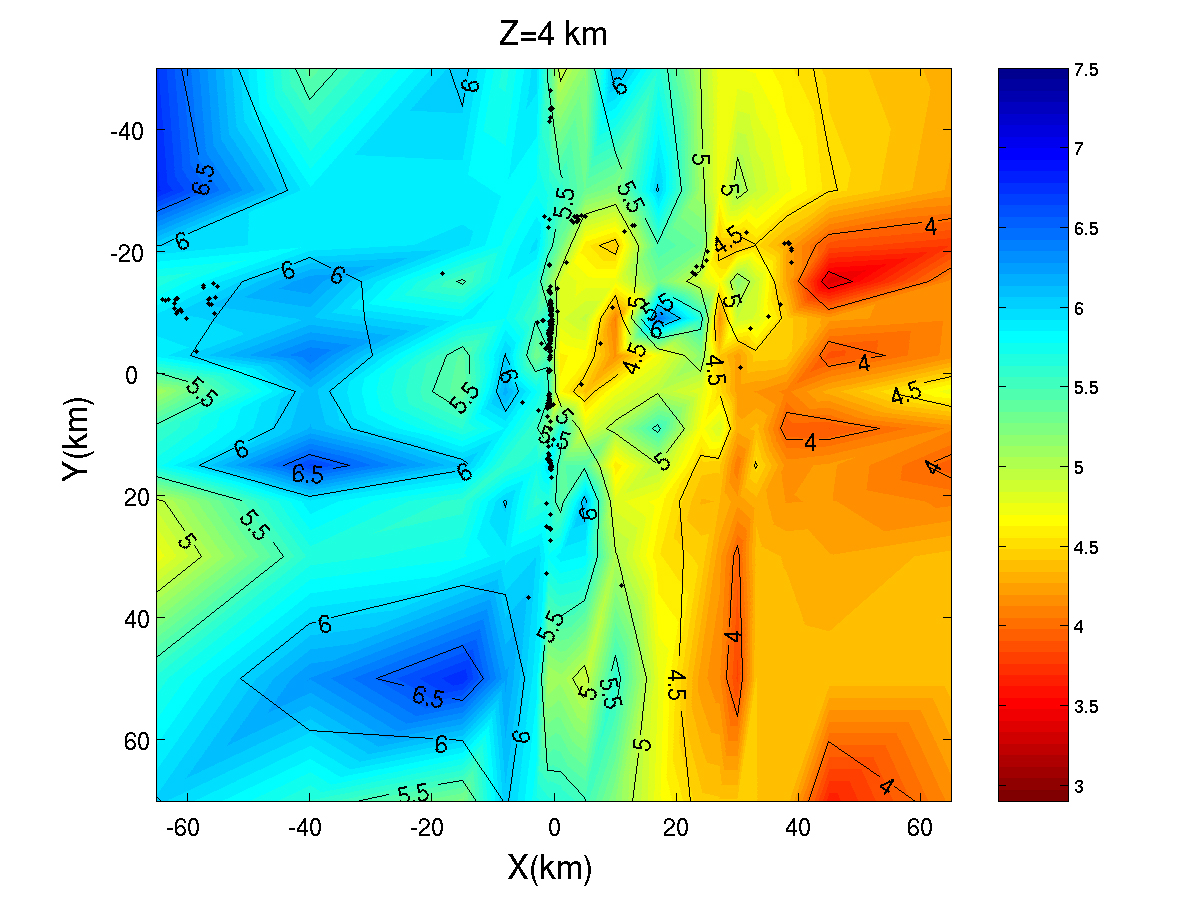
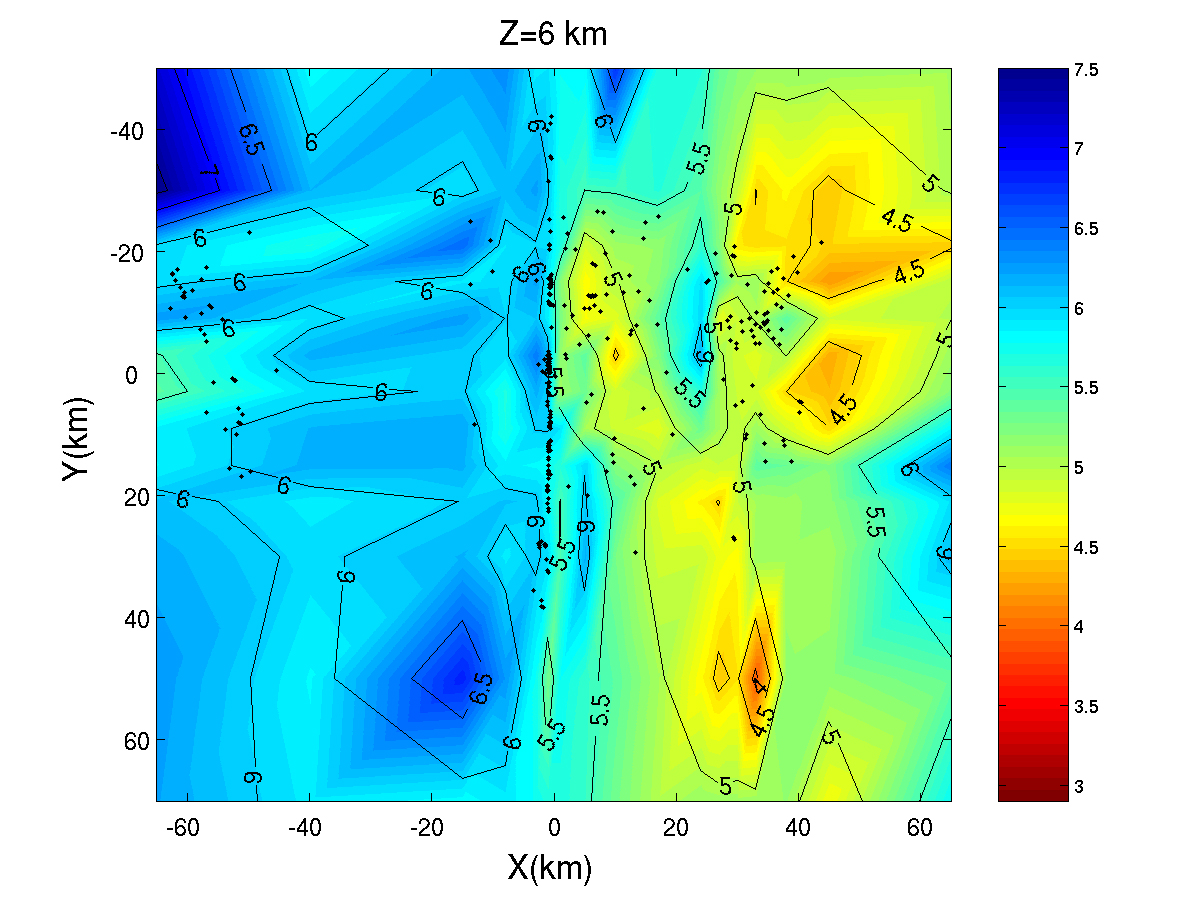
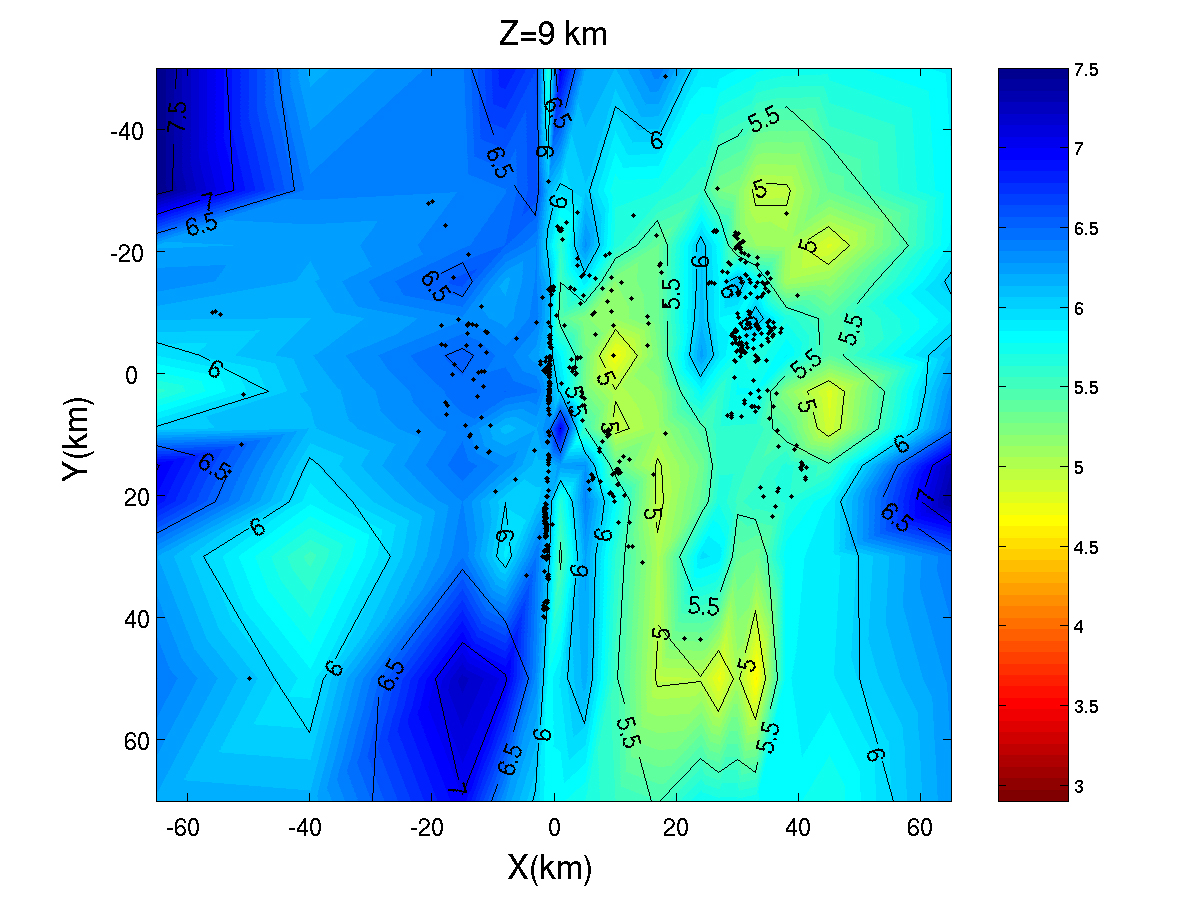
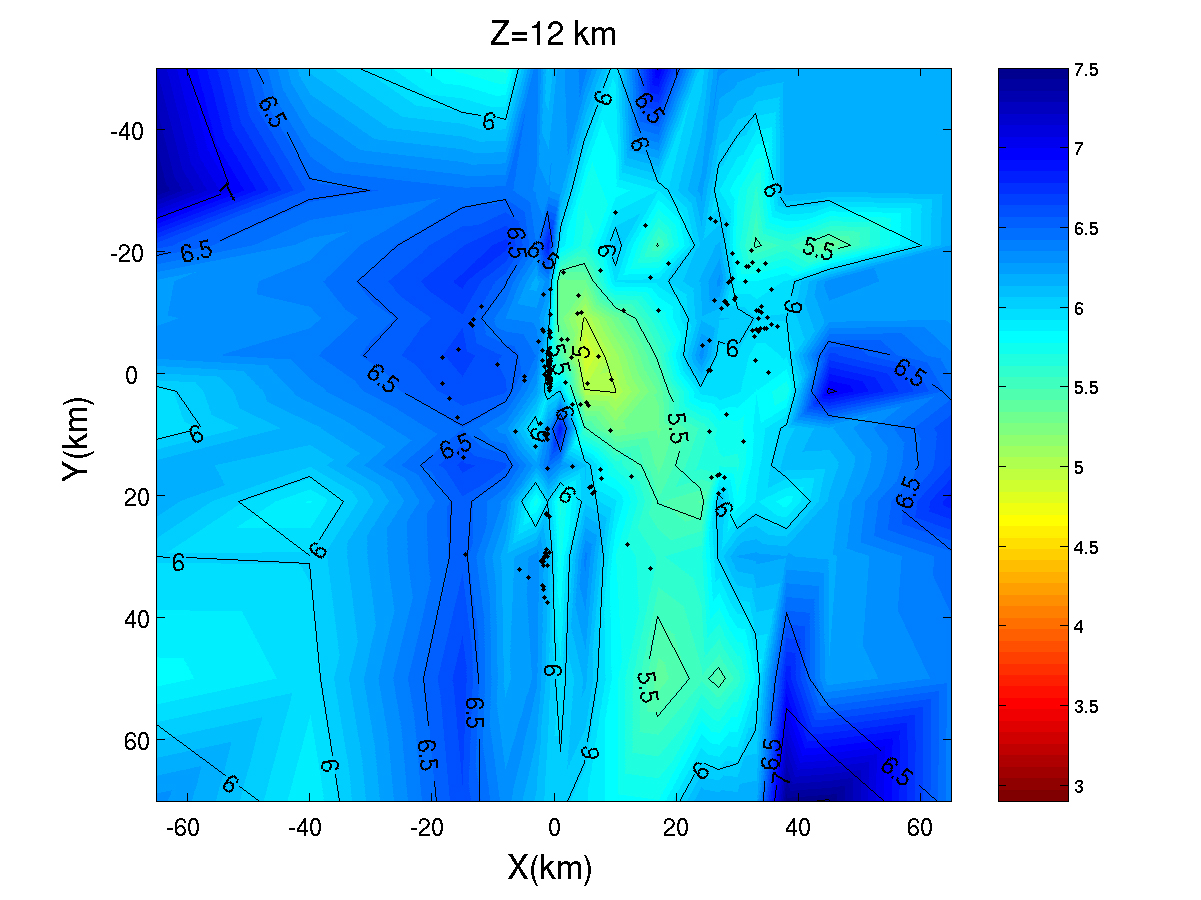
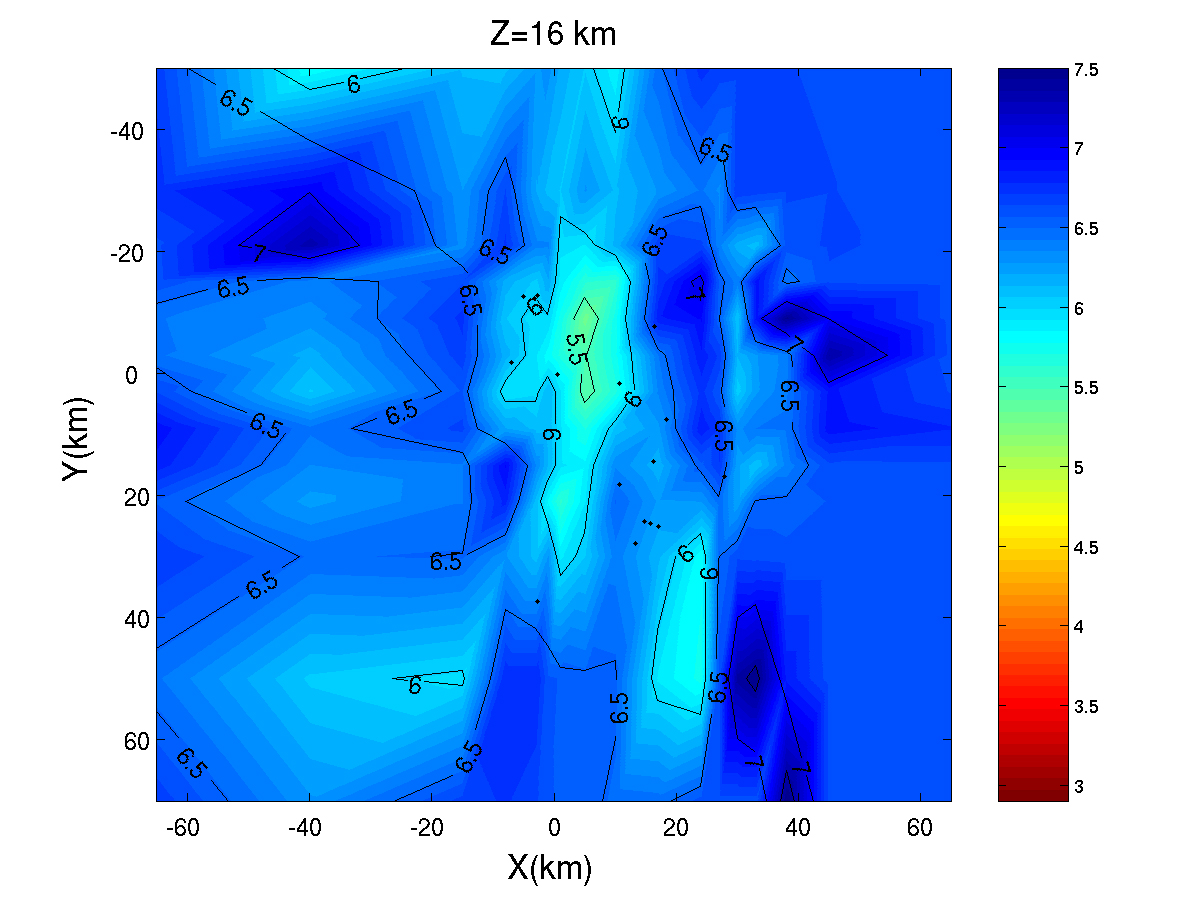
Figure ES2. Map-view slices through the 3D Vp model (km/s) at depths of 2, 4, 6, 9, 12, and 16 km below
sea level.
Z=2 km [~0.7 MB]
Z=4 km [~0.7 MB]
Z=6 km [~0.7 MB]
Z=9 km [~0.7 MB]
Z=12 km [~0.6 MB]
Z=16 km [~0.5 MB]
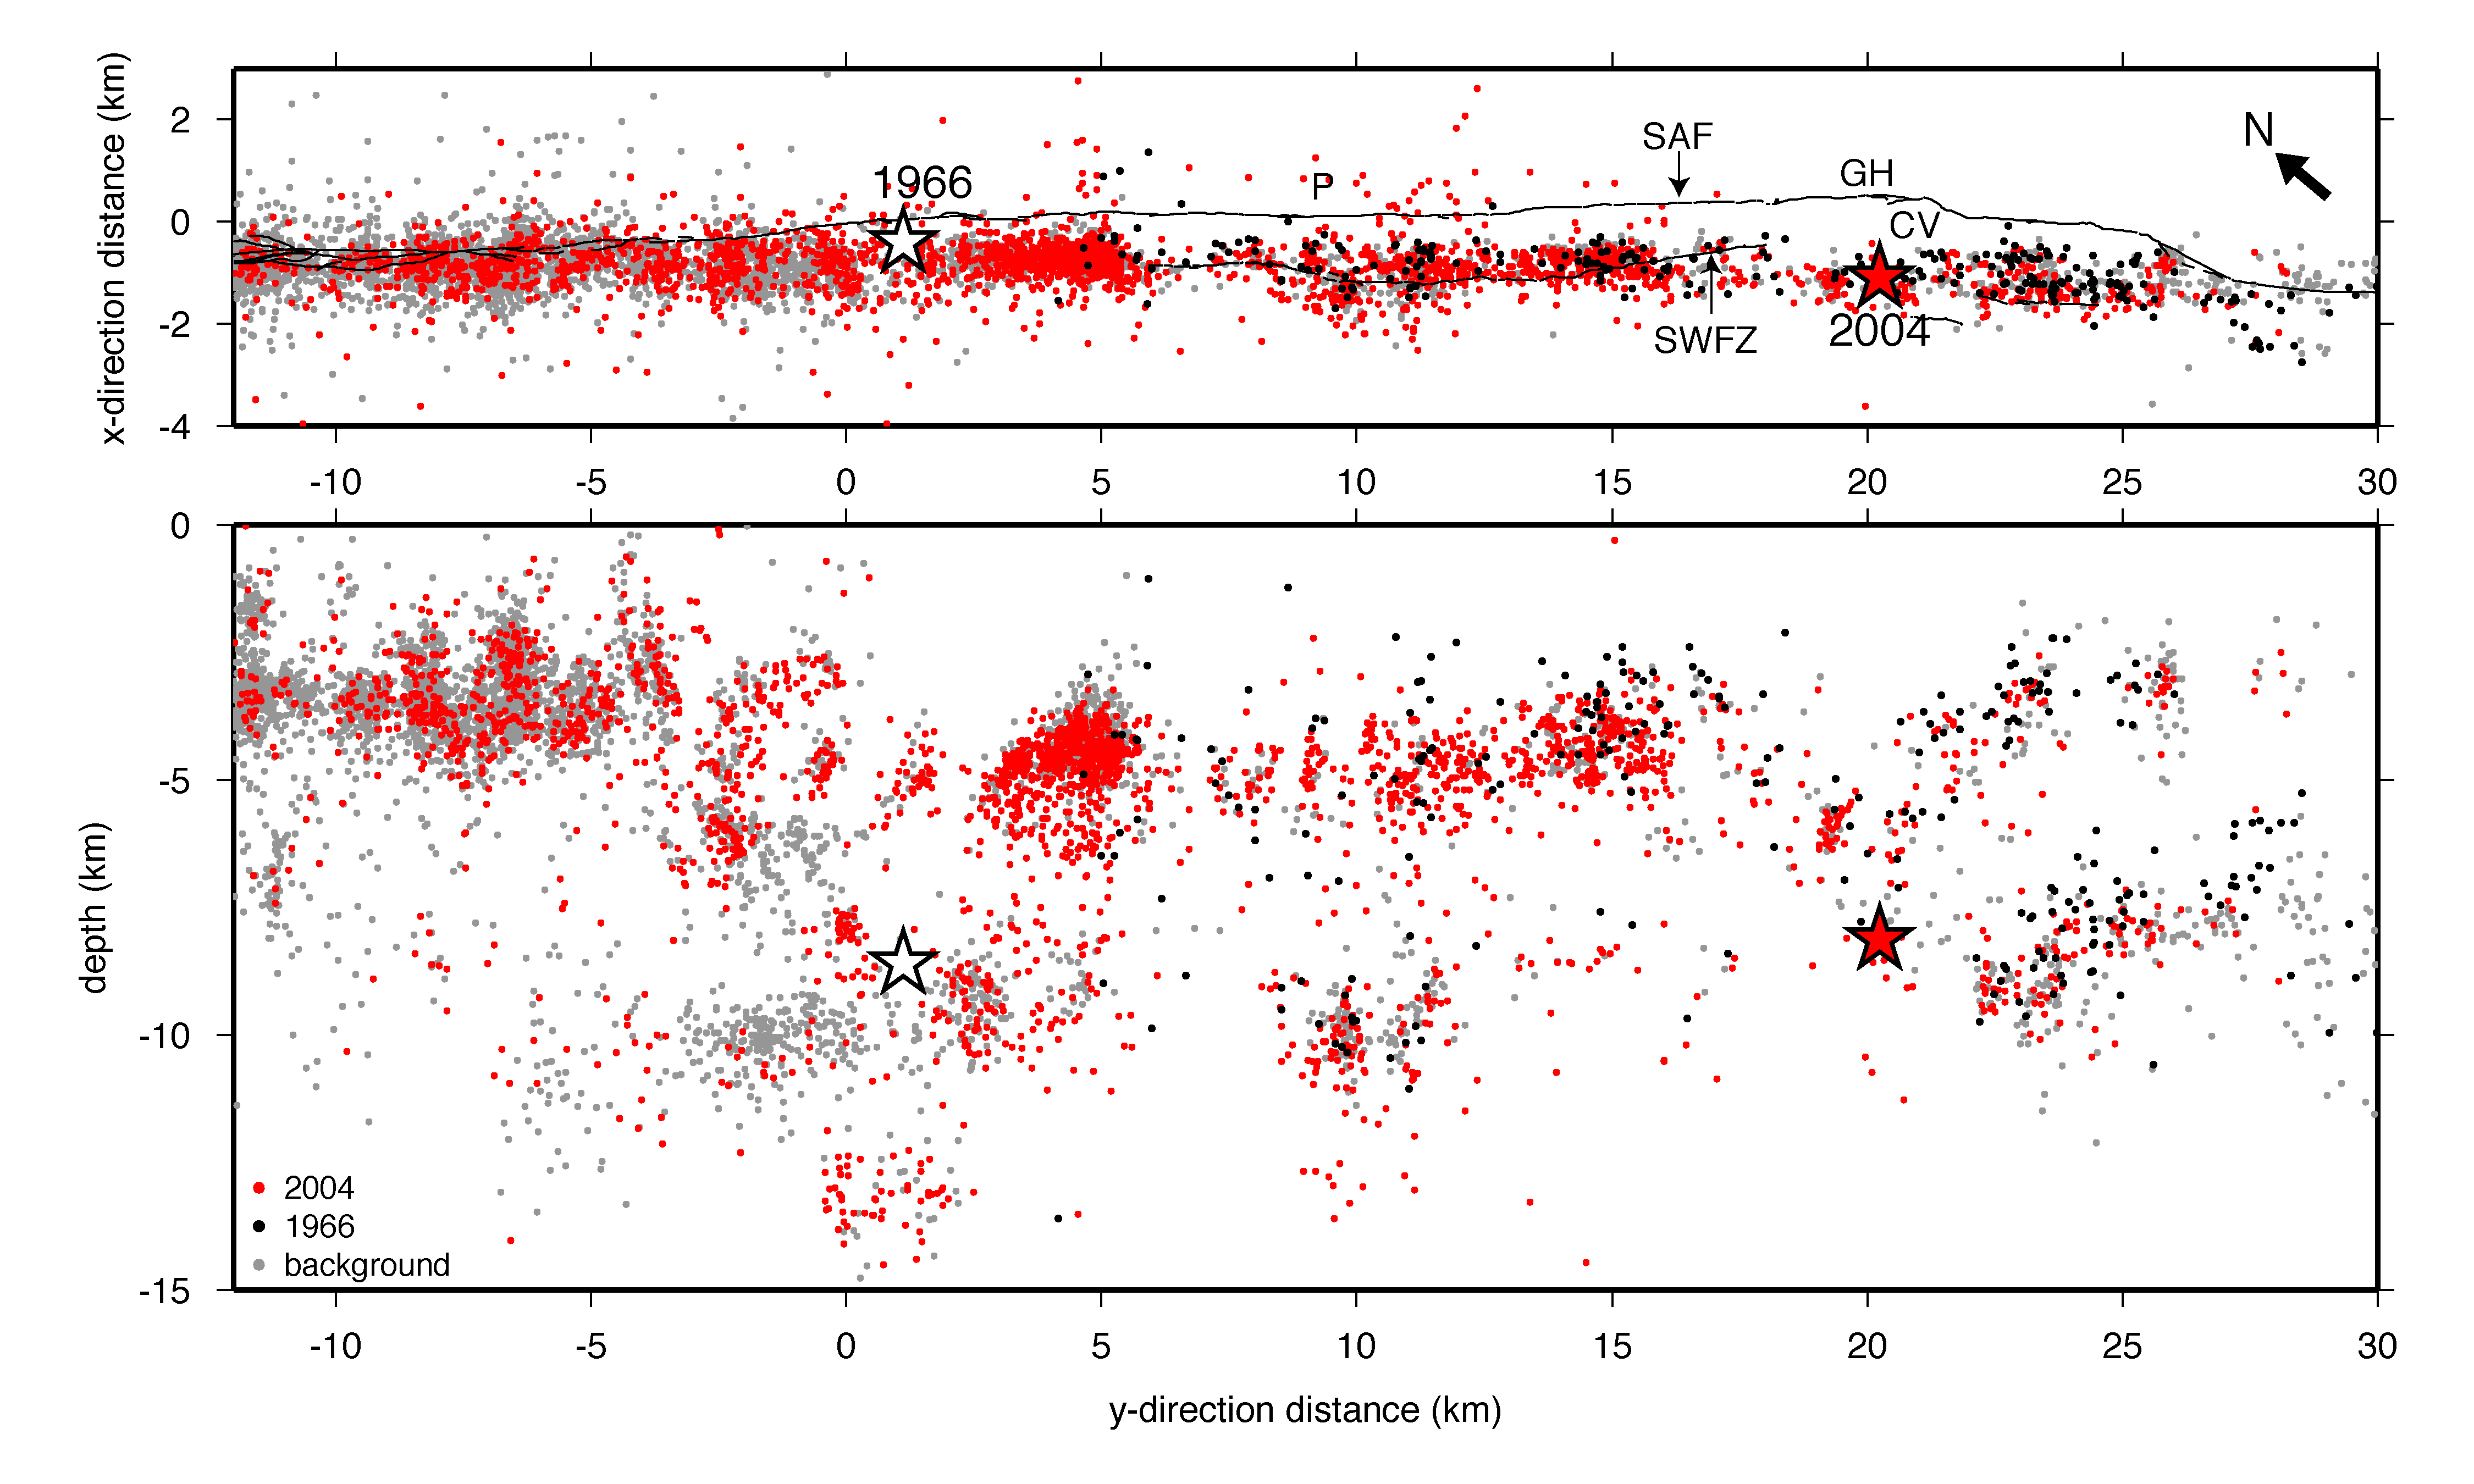
Figure ES3. [~3.5 MB] (High-resolution version of Figure 5 in the paper) Single-event relocations of ~16,000 earthquake from 1966 to 2005 (RMS residual < 0.1s), using the 3D Vp model and station corrections. P = town of Parkfield; GH = Gold Hill; CV = Cholame Valley; SAF = main trace of San Andreas; SWFZ = Southwest Fracture Zone.
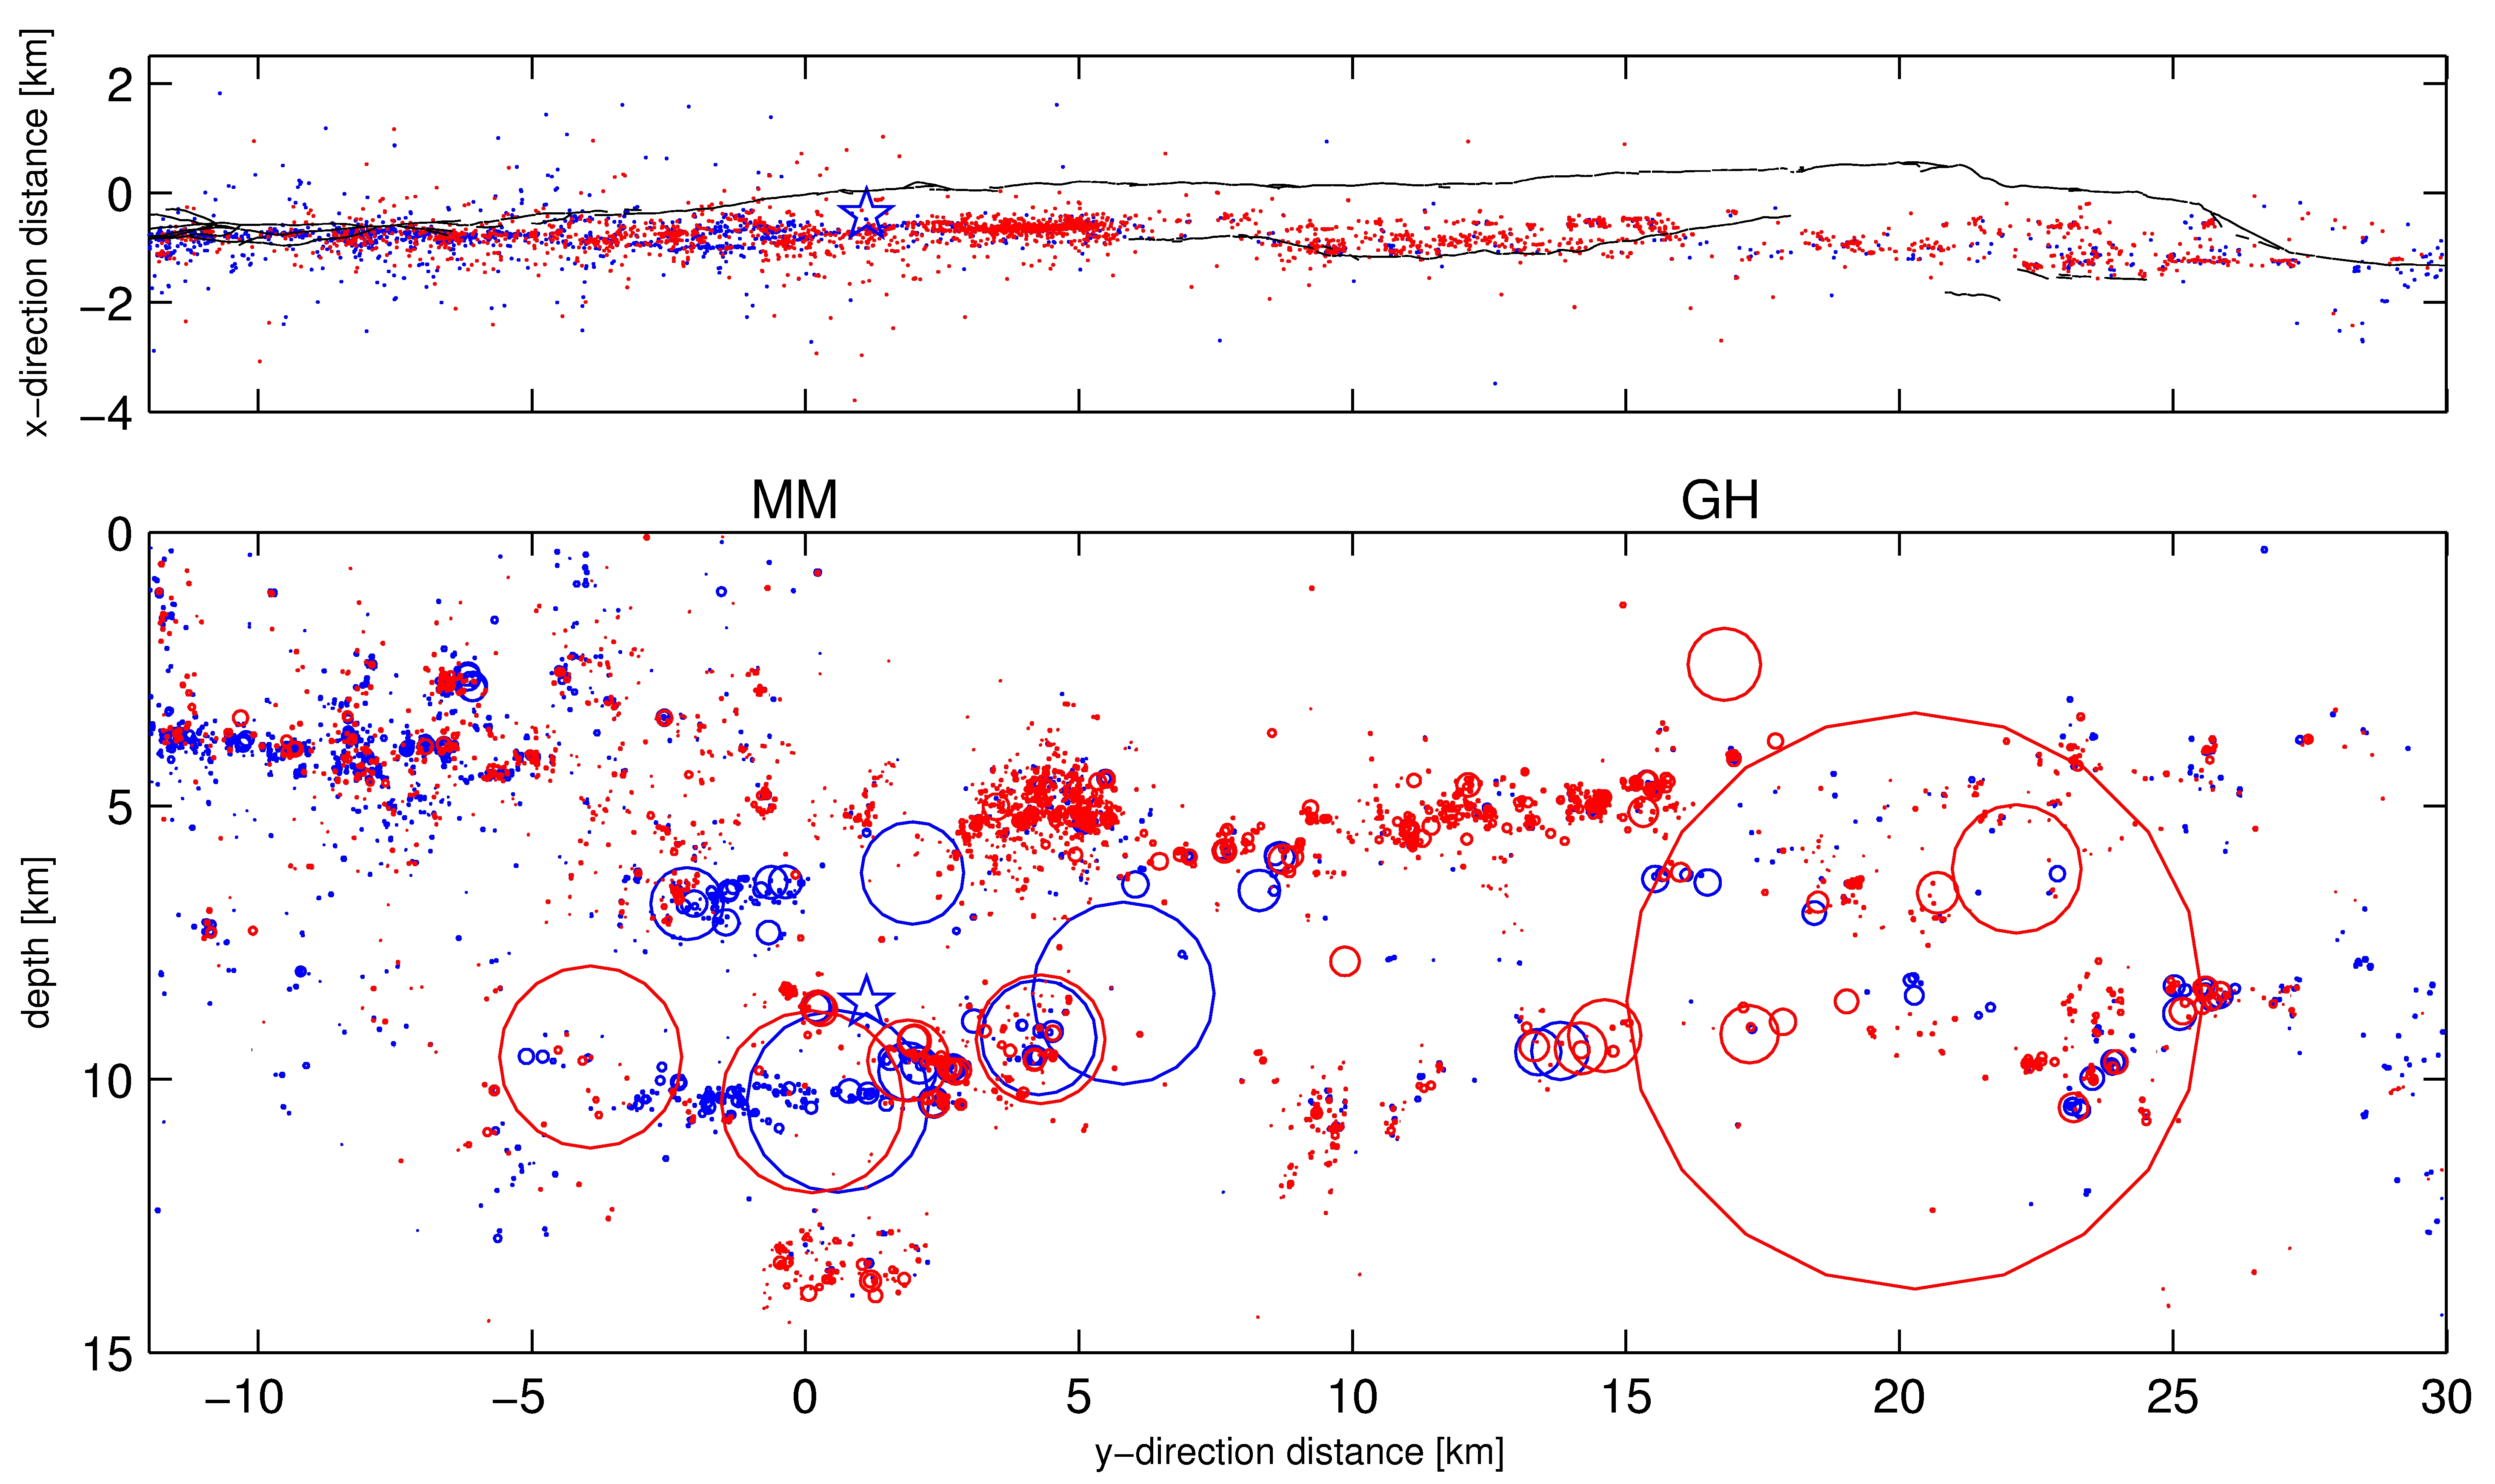
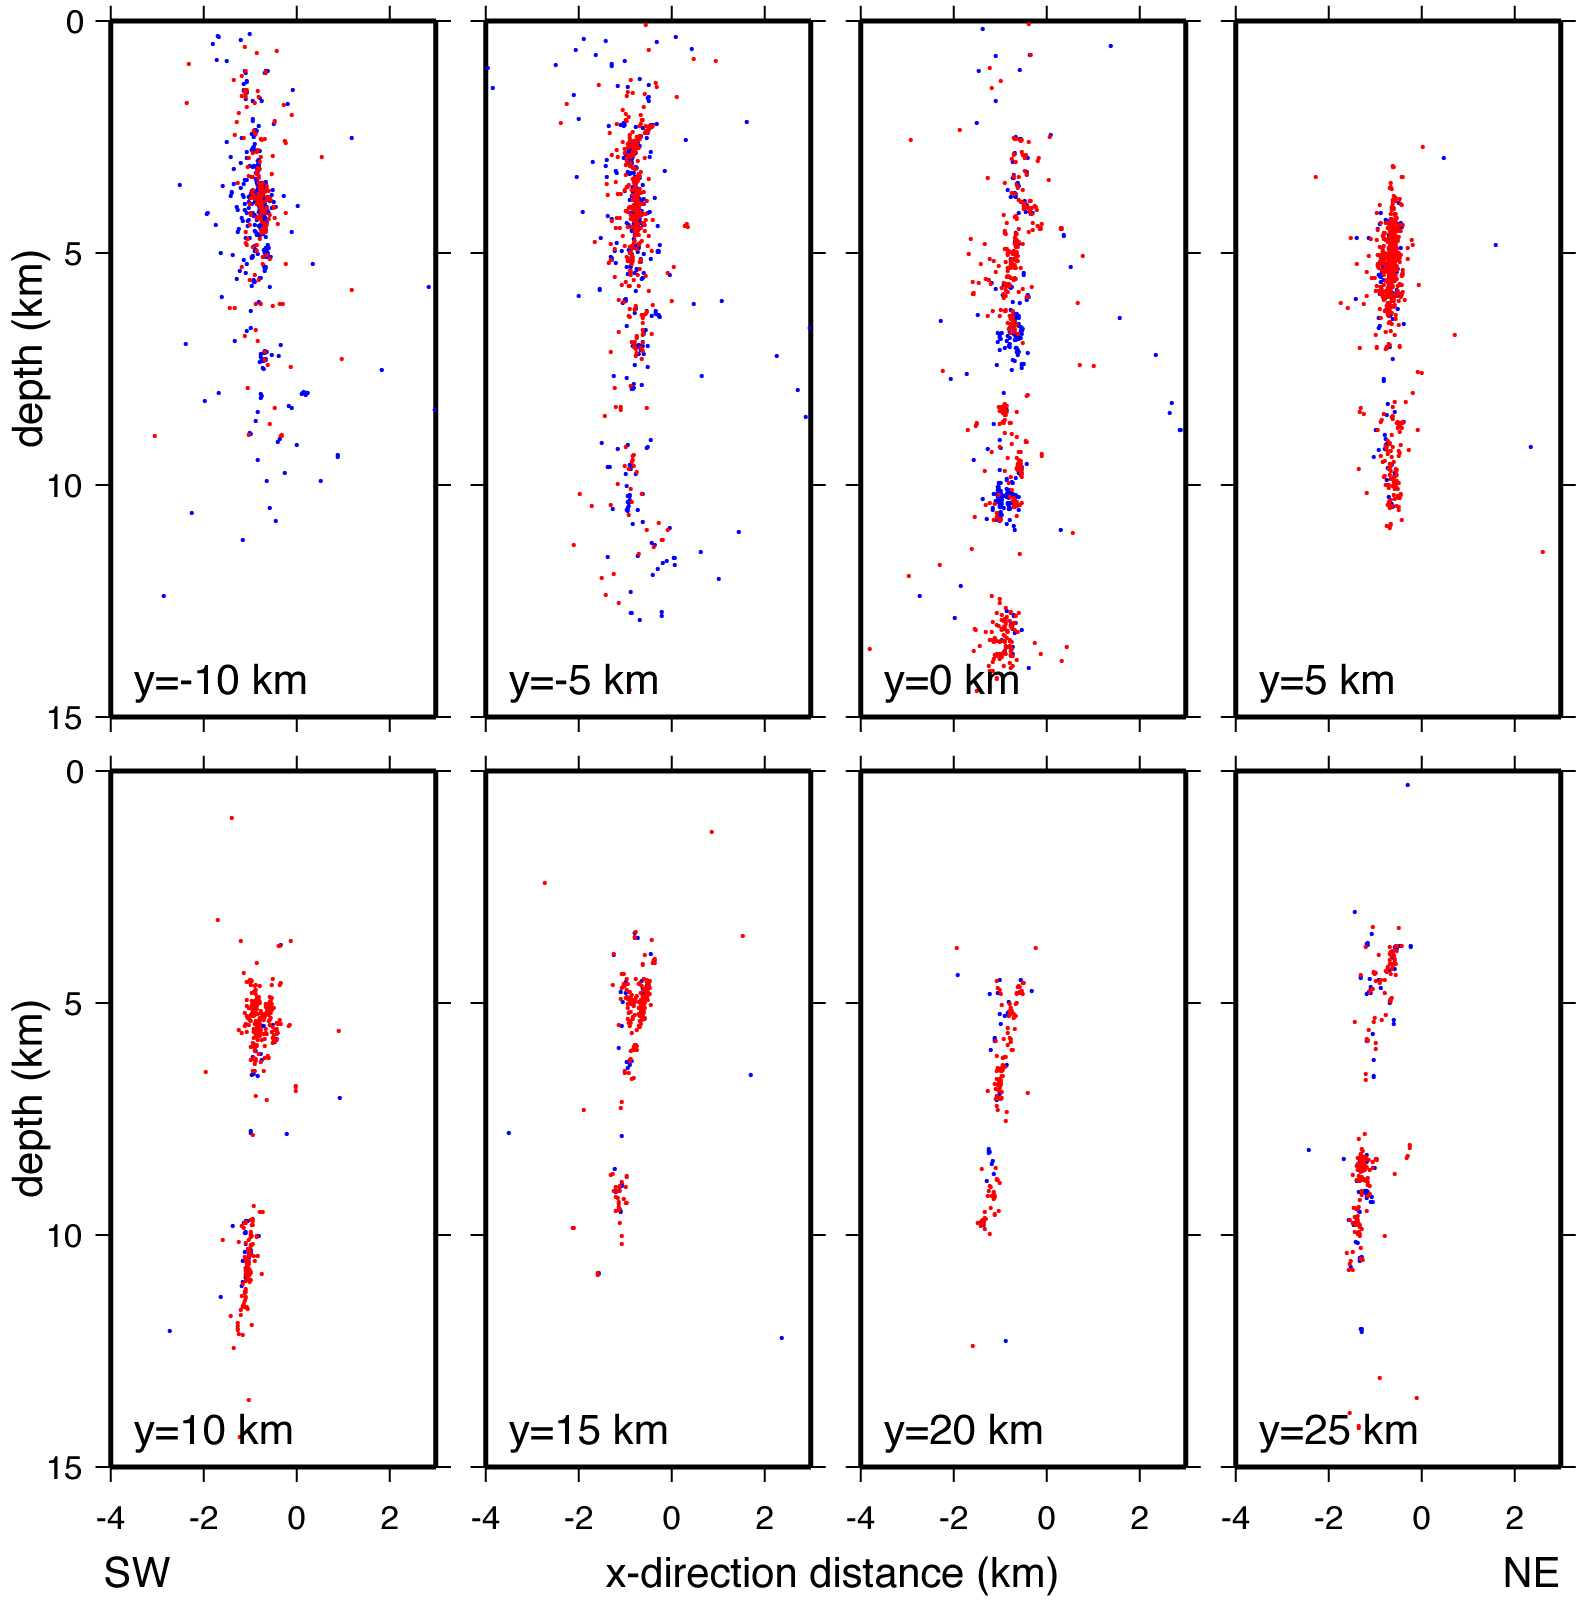
Figure ES4. (High-resolution version of Figure 6 in the paper) (a) [~2.8 MB] Map and along-fault cross-section and (b) [~0.6 MB] fault-normal cross-sections of double-difference relocations of ~9,08,500 earthquakes from 1984 to 2005 using the 3D velocitywavespeedVp model. Blue are events from 1984 to the 2004 mainshock while red are the 2004 mainshock and its aftershocks. In the cross-section in (a), symbols (circles) indicate size of a model circular source with a 30 bar stress drop. Star indicates location of 1966 hypocenter. MM = Middle Mountain; GH = Gold Hill.
Tables
Table ES1. Compressional wavespeed model table file (latitude, longitude, depth, wavespeed value).
[ Back ]