
March/April 1997
Steve Malone
E-mail: steve@geophys.washington.edu
Geophyics AK-50
University of Washington
Seattle, WA 98195
Phone: (206) 685-3811
Fax: (206) 543-0489
FOREWORD
The Internet has become a major research tool for seismology, and from his first column the Electronic Seismologist has primarily reviewed Internet data or information access techniques. While such access is important, seismologists still do their data analysis primarily on their own computers using specific programs developed or adapted by themselves or colleagues. Some analysis procedures are fairly standardized, while others are highly specialized. Because analysis tools are often closely associated with a particular data format, the source of data to be analyzed often strongly influences the analysis programs used. Although conversion from one data format to another is usually possible, information is often lost because of incompatible fields in the data headers. At best format conversion is a hassle, taking time and resources. The number and variety of formats currently in use by seismologists, not to mention the number of analysis tools or programs available, can be overwhelming. Even experienced seismologists may not know the best format or analysis tool for a particular task.
While the Electronic Seismologist is far from expert in all seismic formats and analysis tools, he feels that a review of some of them in this column would be a service to the community. In the next several issues this column will cover some of the more common or interesting analysis programs and the formats they require for their use. In order to characterize most accurately the various programs and analysis tools provided for general use, the Electronic Seismologist encourages the authors of such programs to contribute to this column. Please send e-mail to steve@geophys.washington.edu if you would be willing to provide a short (1,000 word or less) description of your favorite program to be included in this column.
Formats, Formats ...
As a start to this topic a very general overview of the most common seismic data formats is appropriate. There are two major data exchange formats, Standard for the Exchange of Earthquake Data (SEED) and Group of Scientific Experts (GSE). SEED has been adopted by the Federation of Digital Seismograph Networks (FDSN) as the exchange format for the Global Seismograph Network (GSN) data, and GSE is the major exchange format for the nuclear test-detection community and is most suitable for an e-mail-based distribution system such as the AutoDRM (Kradolfer, 1996). Both formats are designed for the bulk exchange of seismic waveform data and are not really suited for use by analysis programs directly. For analysis purposes three major formats are currently used, Seismic Analysis Code (SAC), Ad Hoc (AH), and Center for Seismic Studies (CSS). There are a number of conversion programs to convert from the exchange formats into the analysis formats and also between different analysis formats.
MATLAB-based Analysis Programs
Before boring the reader to tears with the arcane details of these and other seismic formats the Electronic Seismologist feels that at this time it is most appropriate to give a couple of examples of modern seismic analysis packages which are available over the Internet. The basis for these two packages is the interactive, matrix-based software system called MATLAB from The MathWorks (http://www.mathworks.com). While the Electronic Seismologist is not a proponent of seismologists depending on commercial software, he makes an exception in this case. Like FORTRAN or C commercial compilers, MATLAB is now available for most computers from workstations to PC's. MATLAB provides a high-level language well suited to the analysis of time series and so many seismologists are already familiar with its use. The following two seismic analysis packages are made up of sets of MATLAB scripts and functions, or a toolbox of related commands to perform operations on seismic waveform data. Both have been packaged for distribution including some documentation. While the Electronic Seismologist has used neither of these packages extensively, he is still impressed with their comparative ease of use and applicability to some very common seismological analysis tasks. The first provides a nice graphical user interface (GUI), while the second uses typed commands for control.
MatSeis: A SEISMIC GUI AND TOOLBOX FOR MATLAB
Mark Harris and Chris Young
Sandia National Laboratories
http://www.nemre.nn.doe.gov/nemre/data_page.html
MatSeis is a GUI-controlled MATLAB package of seismic data visualization, processing, and analysis tools. Current capabilities include phase-picking, filtering, beaming, vespagram creation, spectrogram creation, fk analysis, and spatial coherency analysis. Custom startup configuration and system functions such as for printing have also been developed. Performance has been optimized by converting often used routines from MATLAB scripts to compiled C-MEX files.
MatSeis is executed from a MATLAB command terminal window which produces a graphical user interface with embedded controls (Figure 1). Using the menus and controls, users can accomplish a wide variety of seismic data-analysis tasks ranging from simple to very complex. For example, to pick S waves for a given event one might follow this sequence:
- Select the event by double-clicking on its ID number in the Origin Display Window. The waveforms will automatically be shifted to the correct epicentral distance in the waveform display.
- Use the Traveltime Pulldown Menu to read in and display the S travel time curve if it is not already shown.
- Double-click on the S curve to align the display on S. The alignment makes it easier to compare waveforms and to zoom to a tighter time window.
- Use the zoom buttons to zoom the waveform display around the S curve to a good view for picking arrivals.
- Use the Arrival Pulldown Menu to set the default arrival phase type to S.
- Pick S arrivals by clicking the right mouse button on each waveform at the desired point.
If the arrivals are not obvious, the user might want to add a few more steps:
- Select any ambiguous waveforms by double-clicking on each. Make spectrograms for them by choosing the Spectrogram option from the Analysis Pulldown Menu. The spectrograms can be used to check for any changes in frequency content at the predicted S arrival times.
- Filter the selected waveforms using the Filter option of the Signal Processing pulldown menu. Filtering is accomplished via a pop-up GUI which prompts the user for the type of filter and for band limits. By examining the spectrograms created in the previous step, optimal filter bands can be chosen. Simple plots of the frequency response, impulse response, or poles and zeros can be viewed before the filter is applied.
- Once all the arrivals are picked, write them to the database using the Write option of the Arrival Pulldown Menu.
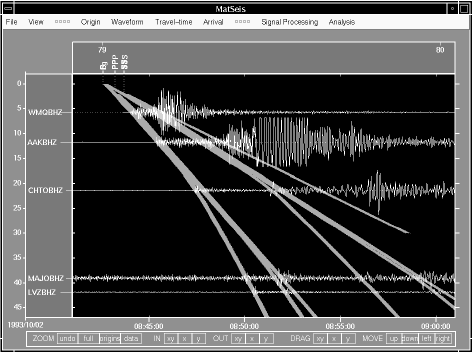
Figure 1. Sample of the main MatSeis graphical window showing the function menus at the top, pushbutton controls across the bottom, and a time-distance waveform display in the center.
Though many users will find the functionality in the current version of MatSeis to be more than adequate, perhaps the greatest strength of the package is the ease with which new functionality can be added. Since MatSeis is based upon MATLAB, the standard MATLAB environment is available from the command window, and data displayed in MatSeis may be accessed on the command line for manual processing and the results plotted using MATLAB or entered back into MatSeis. MatSeis is distributed as full source code, so one can modify and add to existing functionality as needed. A large library of utility functions that the user can call to quickly develop sophisticated signal processing applications (compete with GUI's) is provided. Online documentation for each function is available in the usual MATLAB fashion: Type "help function-name" in the command window. Templates provide numerous examples for the user to follow in designing functions. New functions can be tested from the command line and then added to a custom pull-down menu.
While MatSeis was originally written to access an Oracle CSS 3.0 database, this limited its general usefulness, so it has been modified to access other more common database types. MatSeis will now interface with CSS 3.0 flat files (e.g., Datascope), and a set of templates is included for a generic "Local" database which can be easily modified to fit most users' data formats. The database type may be changed at any time during MatSeis execution, so data from different sources may be combined using several read operations during the same MatSeis session. MatSeis may be customized to start up with a specific configuration of origins, waveforms, etc., that can be set by environment variables or through a configuration file. Using this technique, it is possible to spawn MatSeis from another program as a general seismic data viewer.
MatSeis was developed at Sandia National Laboratories as part of the United States Department of Energy's Comprehensive Test Ban Treaty Research & Development (CTBTR&D) program. The Waveform Correlation Event Detection System (WCEDS) project (Young et al., 1996) needed easy access to a large library of signal processing routines and to waveforms in an Oracle CSS 3.0 database. Previous experience with MATLAB convinced Sandia personnel to use it as the base for integrating these needs. MatSeis is now a fairly complete system allowing a user to apply the full power of MATLAB to seismic data from CSS 3.0 data files via a simple point-and-click interface. It can be obtained via the Internet by submitting a request through the Web page referenced above, or sending e-mail to matseis@sandia.gov. There is no charge for MatSeis, but a formal request must be made and reviewed before releasing the software to comply with Lab policy. Efforts have been made to make the code as platform-independent as possible. Requirements for running MatSeis are MATLAB and its Signal Processing Toolbox. Compiling the source code for a new platform requires a C compiler. MatSeis documentation and data examples are also provided on the Web page. We encourage any interested users to develop new applications and feed them back to the original software base at Sandia to make them available to all. We believe that such an open development environment backed by the robustness of the underlying commercial quality MATLAB software could ultimately make MatSeis a useful tool for many seismologists.
Sandia's MatSeis development was supported by the United States Department of Energy under contract DE-AC04-94AL85000. Sandia is a multiprogram laboratory operated by Sandia Corporation, a Lockheed Martin Company, for the United States Department of Energy.
CORAL
Ken Creager
University of Washington
http://www.geophys.washington.edu/People/Faculty/kcc/coral_doc.html
CORAL consists of a "toolbox" of about fifty documented MATLAB functions that are especially useful for seismologists and a MATLAB script called CORAL that integrates these tools and standard MATLAB tools to analyze record sections of seismic waveform data. The CORAL script allows one to read waveform data and to associate these data with events from moment tensor catalogs. Data can be windowed around any of about sixty seismic phases. Instrument responses can be deconvolved, and seismograms aligned by a variety of methods including cross-correlation. CORAL is often used as a convenient preprocessing program to bring waveform data into MATLAB, where sophisticated algorithms can be easily developed employing the wealth of graphic and signal processing tools provided by MATLAB as well as the tools in the CORAL toolbox.
The CORAL toolbox includes routines to read data from the AH format into MATLAB variables (a routine to read SAC-formatted data has also been developed). Another routine calculates the travel times for about sixty phases from the radial earth models PREM, IASP91, and AK135. Travel time, ray parameter, and derivatives of ray parameter with respect to distance and time with respect to source depth are calculated by cubic-spline interpolation of tau_p tables using a MATLAB interface into a code written by R. Buland (Buland and Chapman, 1983). Access to these travel-time tables in MATLAB has proven to be extremely valuable for many purposes. One example is a graduate-level homework problem in which the student is asked to pick travel times of S waves and write an iterative earthquake-location program. Once the event is located the student is asked to write a MATLAB program based on the Herglotz-Wiechert method to determine the structure of the entire mantle. From one earthquake and fifty stations the resulting models match standard radial models to within 5% throughout the lower mantle.
The toolbox also includes functions to manipulate absolute and differential times, and calculate epicentral distance, ellipticity corrections, radiation patterns, and geometric spreading. Time series tools include tapering, time- and frequency-domain filtering, instrument response deconvolution, differentiation, integration, Hilbert transforms, envelope functions, Futterman filters, cross-correlation, and linear and nonlinear slant stacking.
The CORAL MATLAB script provides for the easy use of these and other tools. Like SAC, it is executed by typing commands. There is currently no GUI interface, though it would not be difficult to add one. Because CORAL is simply an ASCII script it is straightforward to add your own tools. However, for those who do not want to modify CORAL, it has the ability to execute user-supplied MATLAB scripts. We have used this method to incorporate specialized functionality such as receiver function deconvolution. A more complicated example is a script that calculates the amplitude and phase shift of a given phase due to focal mechanism and geometric spreading. The user can choose one or more phases (say SS and S) from many stations and one earthquake. CORAL will find the event from the Harvard Centroid Moment Tensor Catalog, pick out windows from each of the seismograms around the predicted times for these phases, and modify their phases (polarity as well as 90 degree phase shifts of SS) so that all the waveforms should look the same. One can then cross-correlate all the seismograms with respect to each other to align all the phases, providing a simple measure of their relative travel-time residuals and amplitude anomalies. Figure 2 shows an example in which transverse (thick) and radial (thin) displacement seismograms are superposed to search for evidence of anisotropy in the lithosphere and at the base of the mantle.
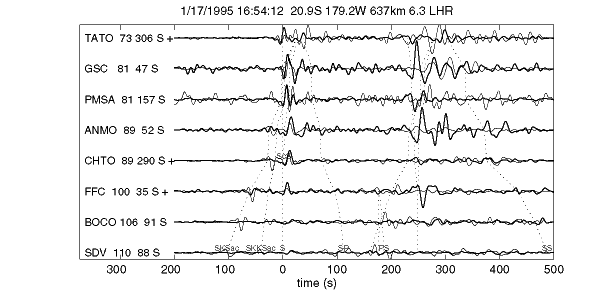
Figure 2. Transverse (thick) and radial (thin) displacement seismograms aligned on the predicted time for S (zero time). Labels show station name, epicentral distance, and azimuth. Seismograms are flipped and scaled so that all S waves should have the same amplitude and polarity. Beyond 100 degrees, however, S waves are too small because the theory does not account for diffraction effects. Travel-time curves of prominent phases are displayed, though depth phases such as sSKSac, sS, and sScS are not labeled.
We have used CORAL to calculate and analyze receiver functions from a linear array of seismometers, align and slant-stack the P-wave coda of hundreds of seismograms to look for coherent signals that are caused by discontinuities such as the 660-km seismic discontinuity, pick absolute and differential travel times by cross-correlation of two or more observed seismograms, or between observed and synthetic seismograms, and for waveform quality control at the IRIS DMC. Record sections for four thousand earthquakes have been produced from long-period and broad-band data in the IRIS FARM and SPYDER® system (http://www.iris.washington.edu/cgi-bin/wilberII_page1.pl and http://www.iris.edu/data/spyder.htm). This is being done automatically by running CORAL in batch mode.
CORAL does not represent a huge software development effort, and we do not have plans for any major changes. University of Washington graduate students T. McSweeney, J. Winchester, and J. Castle have made significant contributions to the development of this code. Anyone who wants to use it is welcome to obtain a copy from anonymous FTP at ftp://ftp.geophys.washington.edu/pub/out/coral.tar.Z.
References
Buland, R. and C. H. Chapman (1983). The computation of seismic travel times, Bull. Seism. Soc. Amer. 73, 1,271-1,302.
Kradolfer, Urs (1996). AutoDRM: The first five years, Seism. Res. Lett. 67(4), 30-33.
Young, C., M. Harris, J. Beiriger, S. Moore, J. Trujillo, M. Withers, and R. Aster (1996). The Waveform Correlation Event Detection System Project, Phase I: Issues in Prototype Development and Testing, Sandia Report #SAND96-1916, 36 pp.
SRL encourages guest columnists to contribute to the "Electronic Seismologist." Please contact Steve Malone with your ideas. His e-mail address is steve@geophys.washington.edu.
Posted: 22 January 1999
URL's last updated: 21 January 2003