The document illustrates the structure of the Italian strong-motion database which is stored at the address http://itaca.mi.ingv.it. It contains a detailed description of the standard adopted for file formats and file naming and a description of the file headers. The tables contained in the relational database are also described with the relationship existing among them.
Download: Database_structure.pdf [~1.73 MB Adobe PDF]
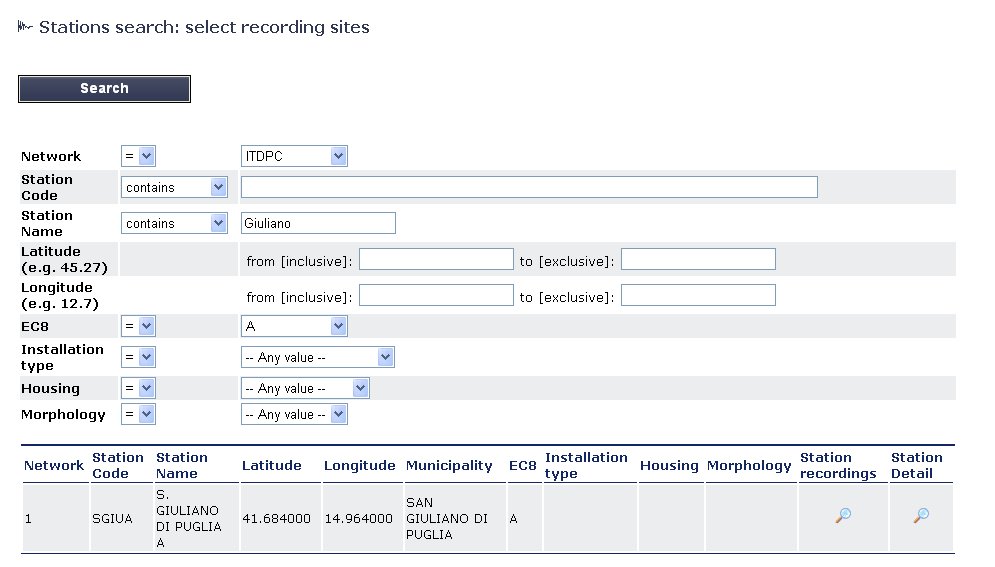
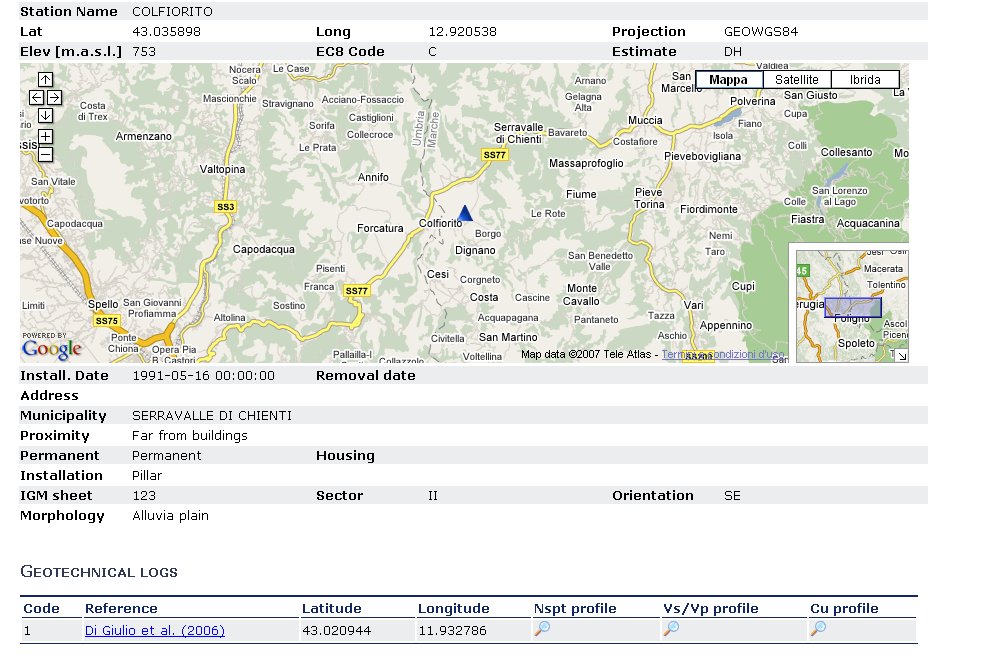
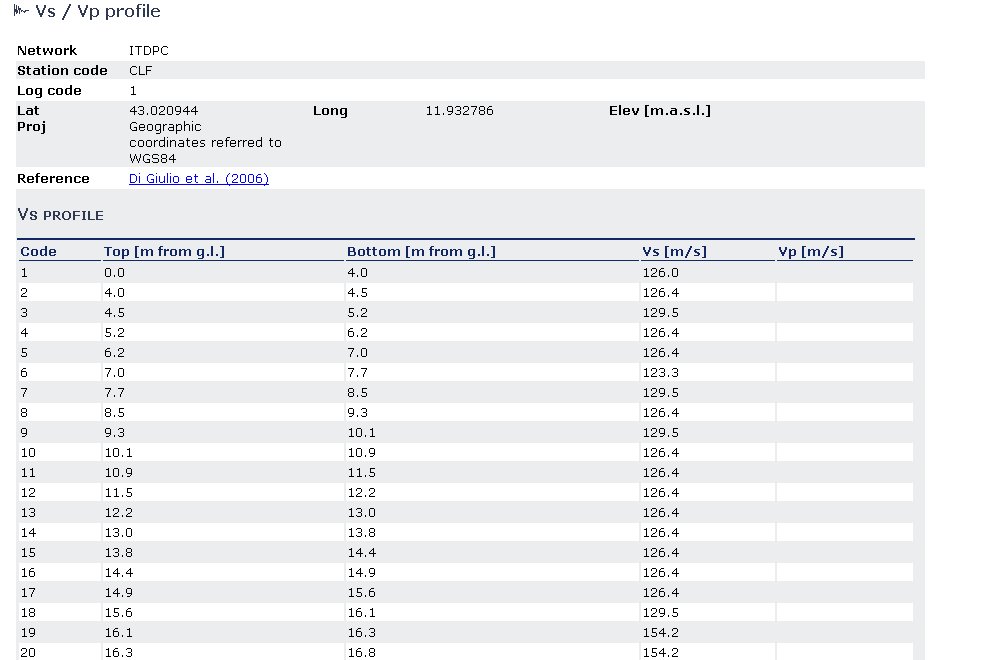
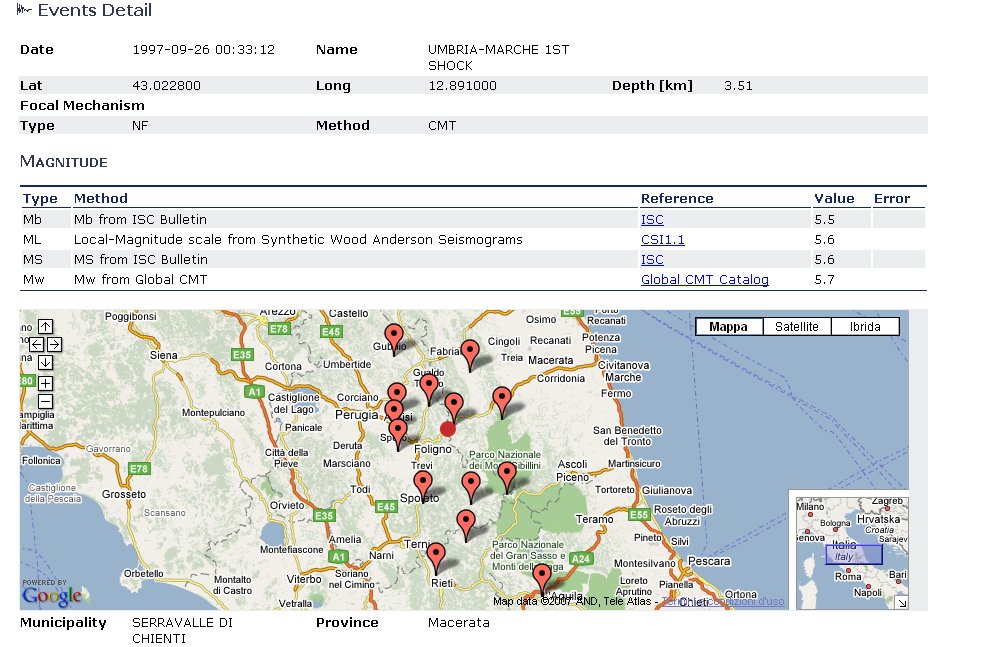
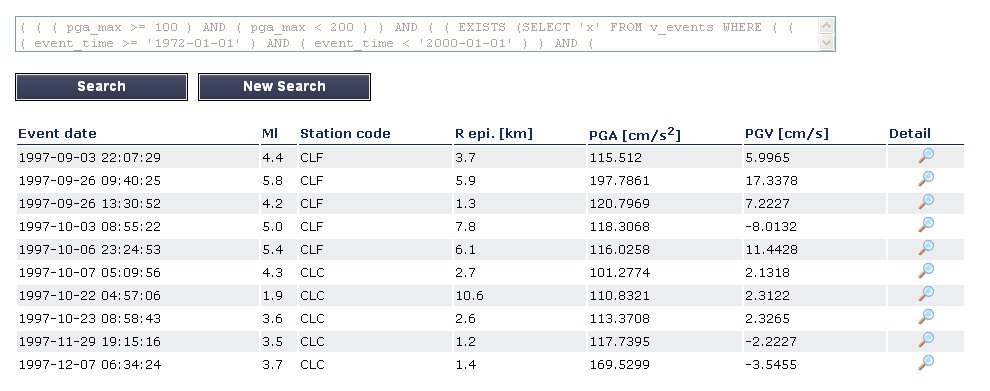
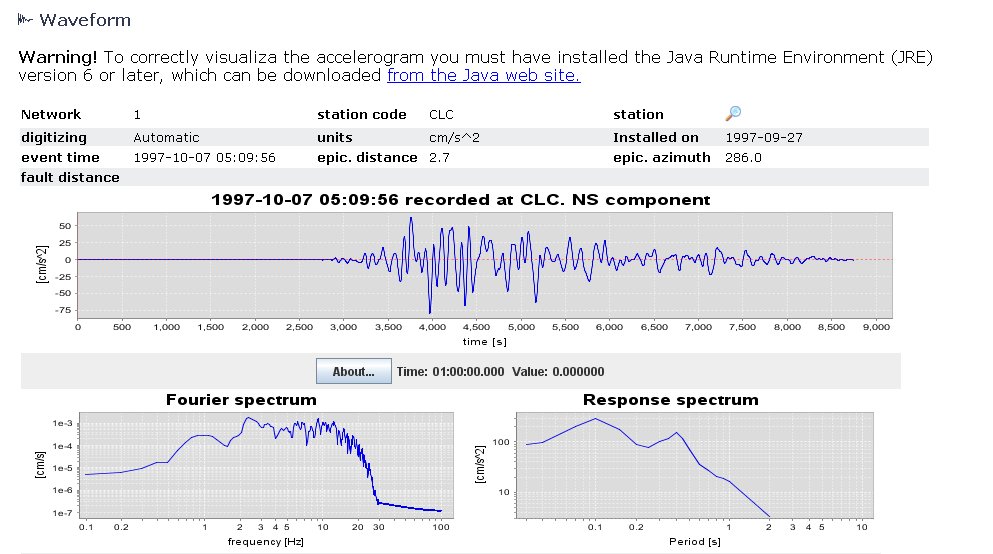
Figure 4 shows an example of recording station query with the station key fields, Figure 5 represents the web page with the detailed description of a selected recording station and Figure 6 is the table with the detailed P-wave or S-wave velocity profile. Figure 7 represents the web page resulting from an event search. Figure 8 is an example of complex query including station, event and waveform characteristics. Figure 9 exemplifies the visualization of the acceleration time-series, the corresponding Fourier and 5% damped acceleration spectra.
Figure 4. Screenshot of the graphical user interface for the station search (the search criteria are: network = ITDPC, station name contains Giuliano, and EC8 site class = A).
Figure 5. Screenshot of an example of station mapping using the Google Maps interface.
Figure 6. Screenshot of the Vs profile for station Colfiorito (CLF).
Figure 7. Screenshot of an example of epicenter location and triggered stations.
Figure 8. Screenshot of an example of data query and returned results with the following constraints: earthquake date from 1972 to 2000, station name contains colfiorito, and absolute PGA between 100 and 200 gals.
Figure 9. Screenshot of Web-based waveform visualization.