Electronic Supplement to
3-D Interdisciplinary Visualization: Tools for Scientific Analysis and Communication
by A. M. Jacobs, D. Kilb, and G. M. Kent
Abstract
Interactive three-dimensional (3-D) computer visualization is becoming an important tool for interdisciplinary science. Its ability to consolidate one-, two-, and three-dimensional geo- referenced datasets into a single view, greatly enhances an audiences ability to grasp both the linkages between disparate datasets, as well as how the Earth functions as a interconnected system. Additionally, with today's increasing computing capabilities, many visualization software packages can integrate datasets that span orders of magnitude in both physical size and scope. The interactive component of 3-D visualization makes it possible to quickly transition between large-scale global perspectives and fine-scale microbial perspectives, giving scientists of all levels an increased understanding of the spatial scales on which the Earth operates. We present four case studies to demonstrate how a combination of dynamic features within a 3-D visualization suite aides in the analyses of interdisciplinary research and how visualizations are an essential tool for communicating science to a very broad range of audiences.
Movies
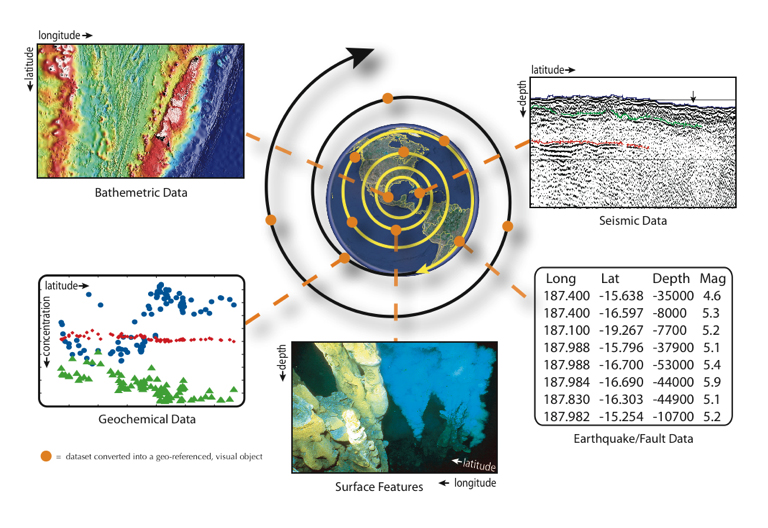
Movie 1. This movie, based on the Lau Basin-Tonga Trench scene, shows how 2- and 3-D datasets of various types and spatial scales can be integrated in a 3-D visual environment. It highlights the complementary nature of viewing an individual 2-D dataset alongside the integrated visualization. As the movie explores the spreading ridge, one can begin to understand how this graphical tool is beneficial in quickly viewing multiple datasets and subsequently choosing a specific location to focus future Ridge 2000 program experiments.
Download/View: Tonga07_final_small.mov (small version) [Quicktime Movie; ~116 MB]
Download/View: Tonga07_final.mov (HD Large Version) [Quicktime Movie; ~383 MB]
Tech Note: The movie files linked above are compressed using the H.264 video codec and may require Apple's free QuickTime software to view. QuickTime is included on all Apple Macintosh and many Microsoft Windows computers. If you need to install QuickTime software it can be downloaded from http://www.apple.com/quicktime/. Users of Linux or Unix operating systems may be able to play these movies using open source software such as Mplayer, Totem, or VLC.
Tables
Table 1. A list of the modular object files (i.e., sd files) in the global earthquake scene.
Table 2. A list of the modular object files (i.e., sd files) in the Lau basin scene.
Table 3. A list of the modular object files (i.e., sd files) in the Anza earthquake scene.
Table 4. A list of the modular object files (i.e., sd files) in the Lake Tahoe scene.
Scene Files
Scene 1. Global Seismicity scene. This scene highlights the thousands of seismic events within the Engdahl Centennial Earthquake Catalog (1900-2002). By plotting the earthquakes with global topography, plate tectonic boundaries, and volcanic hotspots, we can make observations about where earthquakes tend to occur and the shape and structure of subduction zones. Additionally, we plotted the 25 most populated cities in the world as of 2005. Combining the earthquake catalog with these locations creates a vehicle to quickly recognize potentially geohazardous regions of the world.
Download: VizPaper_GlobalQuakes.scene.zip [Zipped Fledermaus Scene File; ~12 MB]
Scene 2. Data from the Lau basin and Tonga Trench. This scene was created to encourage interdisciplinary analyses of the spreading centers in the back-arc basin. Most data collected along the axes show a wide range of systematic variability as the axes near the volcanic arc associated with the Tonga Trench. A highlight of this scene is how data of various scale scales were combined and can be viewed in one element. For more detailed imagery, please contact Stacy Kim skim [at] mlml [dot] calstate [dot] edu.
Download: VizPaper_Tonga2.scene.zip [Zipped Fledermaus Scene File; ~271 MB]
Scene 3. Data from southern California. The main goal of this visualization is to explore the fault configuration of aftershocks in the 2001 and 2005 Anza magnitude ~5 mainshock sequences. Key in the exploration is the ability to toggle on/off various visual objects, which allows one to confirm the relatively heterogeneous rupture processes of the aftershocks that map out a wedge shaped region of faulting that thins with depth.
Download: Vizpaper_SoCal.scene.zip [Zipped Fledermaus Scene File; ~7 MB]
Scene 4. Data from the Lake Tahoe, California-Nevada, region. Here, we explore the spatial distribution of two bursts of seismicity in 2003 and 2004, the first of which was uncharacteristically deep in comparison to the historic seismicity of the region. The spatial orientation of these data fail to present a single ggood view, confirming again that interactively is an important component of the research process.
Download: Vizpaper_Tahoe.scene.zip [Zipped Fledermaus Scene File; ~118 MB]
Tech Note: The Fledermaus Scene files linked above may be viewed using the freely downloadable iView3D software that runs on many popular platforms (e.g., Mac OS X, Windows XP/Vista, Linux). More information is available on the iView3D product page at the IVS 3D website. For additional help downloading and using the Scene files visit: http://www.siovizcenter.ucsd.edu/library/objects/help.php
Download: iView3D. [Link to external website form. Free registration required.]