Electronic Supplement to
Analysis of Seismic Activity near Theodore Roosevelt Dam, Arizona, During the Occupation of the EarthScope / USArray Transportable Array

by Jeffrey S. Lockridge, Matthew J. Fouch, J Ramón Arrowsmith, and Lepolt Linkimer

Figure

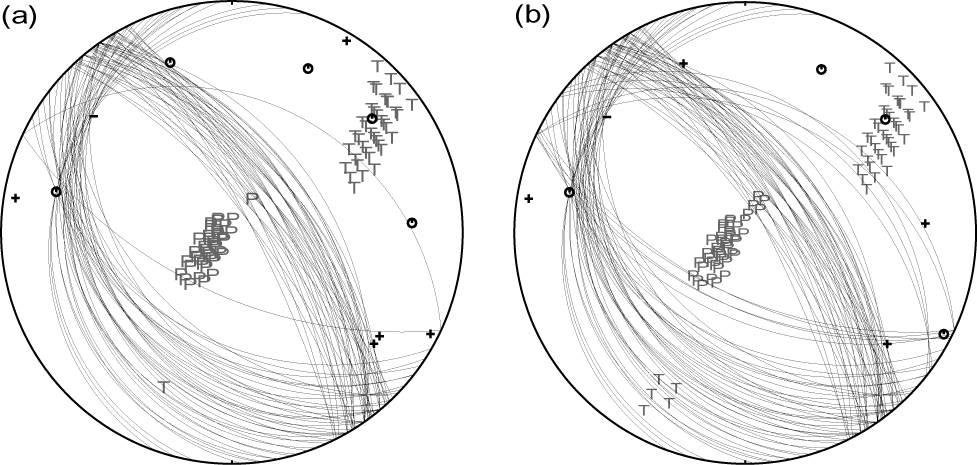
Figure S1. Suite of viable focal mechanism solutions showing nearly identical fault orientation and slip for the two largest events recorded during the Roosevelt Lake cluster. Individual fault plane solutions are labeled by their pressure (P) and tension (T) poles. Arrival polarities for each event are identified as compression (+), dilatation (-) and emergent compression (o). (a) ML 3.1 6/25/2007 14:52:28 GMT earthquake. (b) ML 2.7 6/25/2007 13:04:55 GMT earthquake.

Table

Table S1
AZ Transition Zone
(Sinno et al. 1981)
P-Velocity
(km/s)
Depth
(km)
3.34 0
6.05 1
6.4 15
7.67 24
 
S-Velocity
(km/s)
Depth
(km)
2 0
3.62 1
3.83 15
4.6 24
[ Close ]
. 1-D regional seismic velocity model used in this study. Regional P-wave velocity model is drawn from Sinno et al. 1981. Regional S-wave velocity is computed assuming Vp/Vs = 1.67.

[ Back ]