Class-C accelerometers to date are all MEMS (MicroElectroMechanical Systems — micromachined devices etched from silicon). They have tiny (typically microgram) silicon proof masses suspended on silicon springs, and generally work in a capacitive-sense capacitive-feedback mode with either analog (volts) or digital outputs, often both. The small proof mass, thus small sense signals, are the primary reason for the characteristically elevated self noise of MEMS accelerometers, though noise continues to drop as designs improve. Descriptions, pictures, and diagrams of typical MEMS accelerometers are given by http://en.wikipedia.org/wiki/MEMS, http://www.wikid.eu/index.php/MEMS-based_accelerometers, http://www.sensorsmag.com/sensors/acceleration-vibration/an-overview-mems-inertial-sensing-technology-970, and numerous other sources.
MEMS sensors comprise very small dies ("chips"), thus orientation within their packages and orientation of those small packages to the circuit board and sensor case are all imprecise to some degree, leading to larger orientation errors than in most Class-A and -B sensors. It is common for Class-C MEMS sensors to be out of alignment by 2°, sometimes more, while the ANSS guidance is closer to the industry norm of 1°. (While this limitation is largely unimportant at reference and free-field strong-motion sites, it may be important if the devices are deployed within structures, where the axes generally should be oriented to the main symmetry axes of the structure.)
The final major limitation of Class-C accelerometers is that their sensitivities commonly are set to an accuracy of about 2% of full scale (%FS) rather than the 1%FS typical of Classes A and B sensors and the corresponding ANSS guidance. The sensors tend to have high natural frequencies (hundreds of hertz to tens of kilohertz) so typically have very flat inherent transfer functions (TFFs) across the seismic passband. However, these TFFs are commonly modified by various means, often to a sincn response. They may be further modified by vendor (OEM, Original Equipment Manufacturers) integration of the MEMS chips into a larger circuit and conversion to a digital, commonly USB, output stream. Recording and processing software may also affect the TFF.
Because these MEMS accelerometers are tiny and have springs of high-purity silicon, they show little or no perceptible spring creep on decadal scales, are robust in use (though easily damaged by static electricity when not part of a larger circuit, as are all modern integrated circuits), and generally should last about as long in use as typical integrated circuits.
Other uses of low-cost MEMS accelerometers include the sense elements for airbag deployment; inertial navigation; angle sensing in laptops, games, and so forth; and putting hard disk drives into a safe mode as laptops are dropped by a user.
The devices we tested were supplied by OEMs rather than by the MEMS chip makers. In addition to the MEMS sensors they include unknown equipment added by the OEM and generally output a digital stream via USB. The Droids use droidShake software provided by Deutsche Telekom to record on the phone's flash card, while the GCDC uses its internal vendor-supplied firmware and records to an internal 2 GB flash chip. The O-Navi and JoyWarrior devices were recorded on laptops via software supplied by QCN; the Phidgets were recorded similarly, using software provided by CSN.
One Figure and four Tables given here provide more detail than is required in the body of the paper and would drive up the length of the paper to excess. They are given here for the reader's convenience.
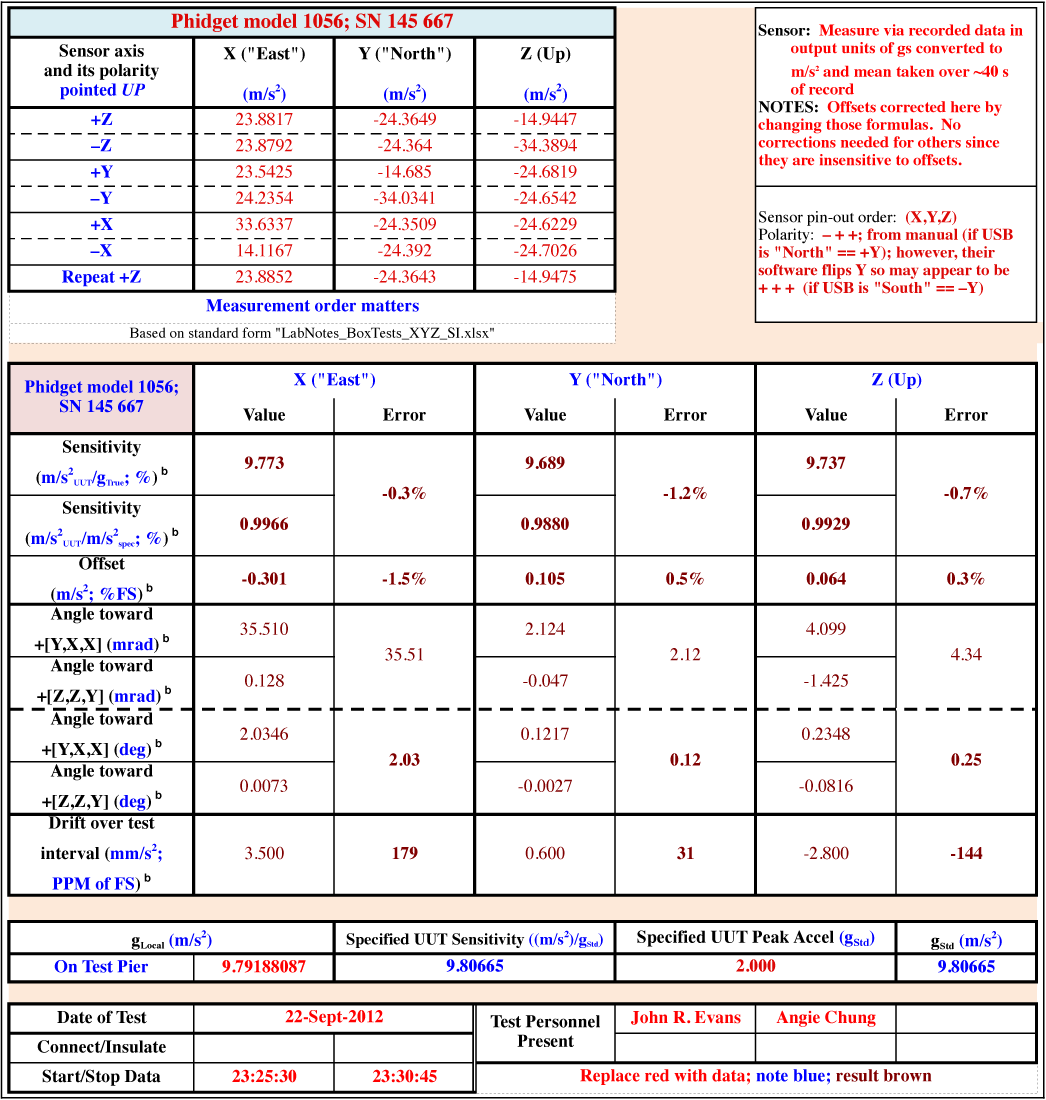
Figure S1. Example of Excel analysis sheet we use to evaluate box-test data (shown as used in Excel, not in SRL table format). Red values in top and bottom panels are filled in by user, and the results are calculated internally and shown in brown ( normal typeface) for various intermediate results and brown (boldface) for principal results. Where two sets of units are shown in the left column, the first applies to the left of each axis' pair of columns (e.g., left half of "X" for "Drift over test" is 3.500 mm/s2 and the right half is 179 parts per million of full scale).
Table S1. Summary of box-flip test results.
Table S2. Summary of sensor noise levels and effective resolution.
Table S3. Summary of sensor performance.
Table S4. A strawman bill of materials for a clean-sheet Class-C recording system.
[ Back ]