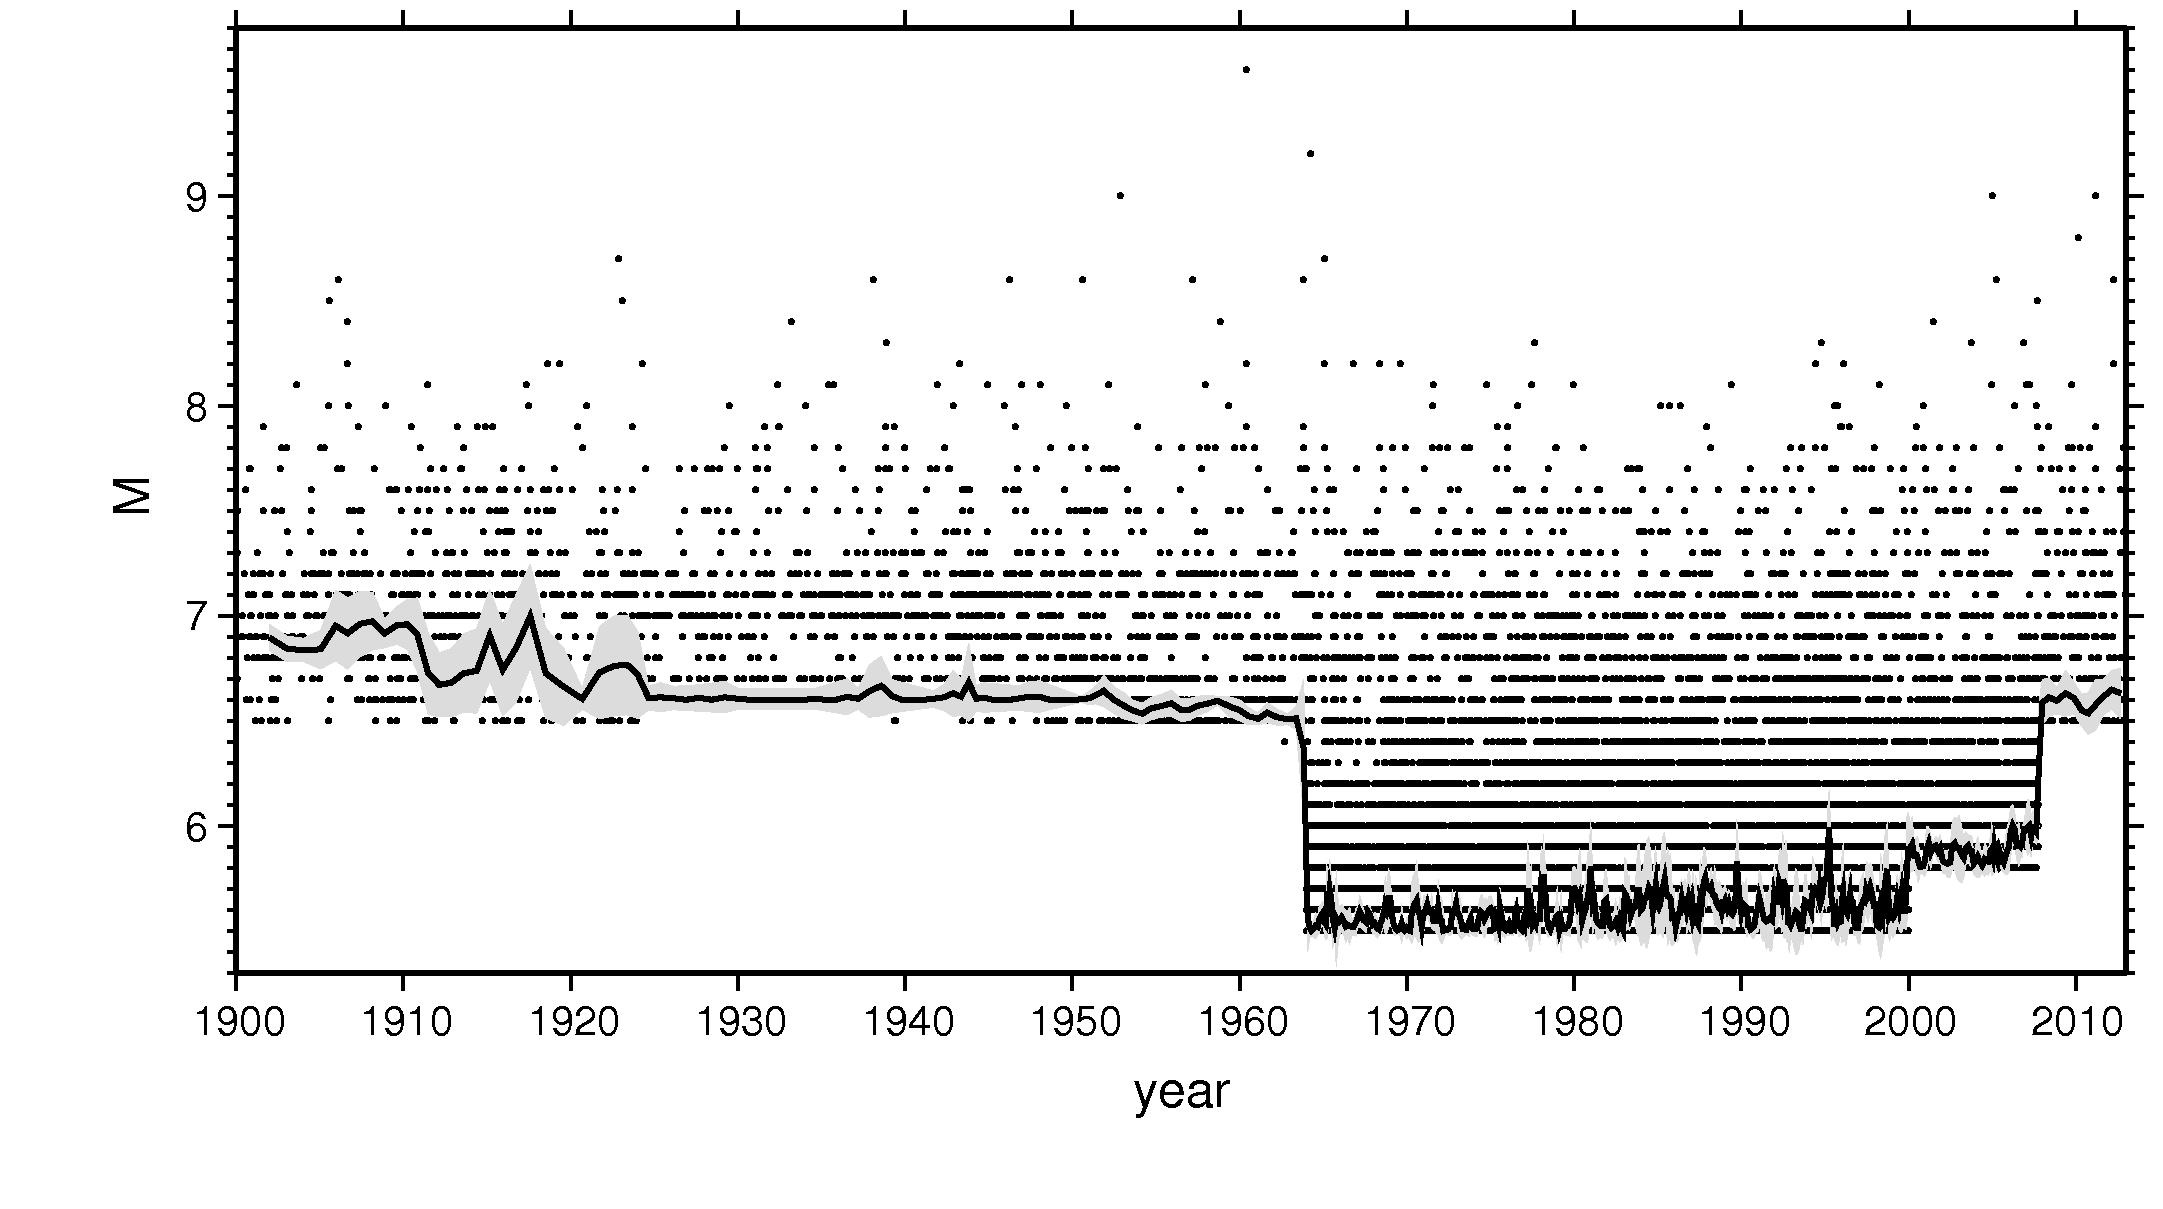
The supplementary materials consist of figures showing the variation through time of the magnitude of completeness Mc for the entire catalog (Fig. S1) and for the northern and the southern hemispheres (Figs. S2 and S3, respectively).
Figure S1. Magnitude–time distribution of earthquakes in the overall catalog (before magnitude selection and declustering). The black line and the gray strip indicate the magnitude of completeness and the corresponding uncertainty estimated according to Woessner and Wiemer (2005) using ZMAP (Wiemer, 2001).
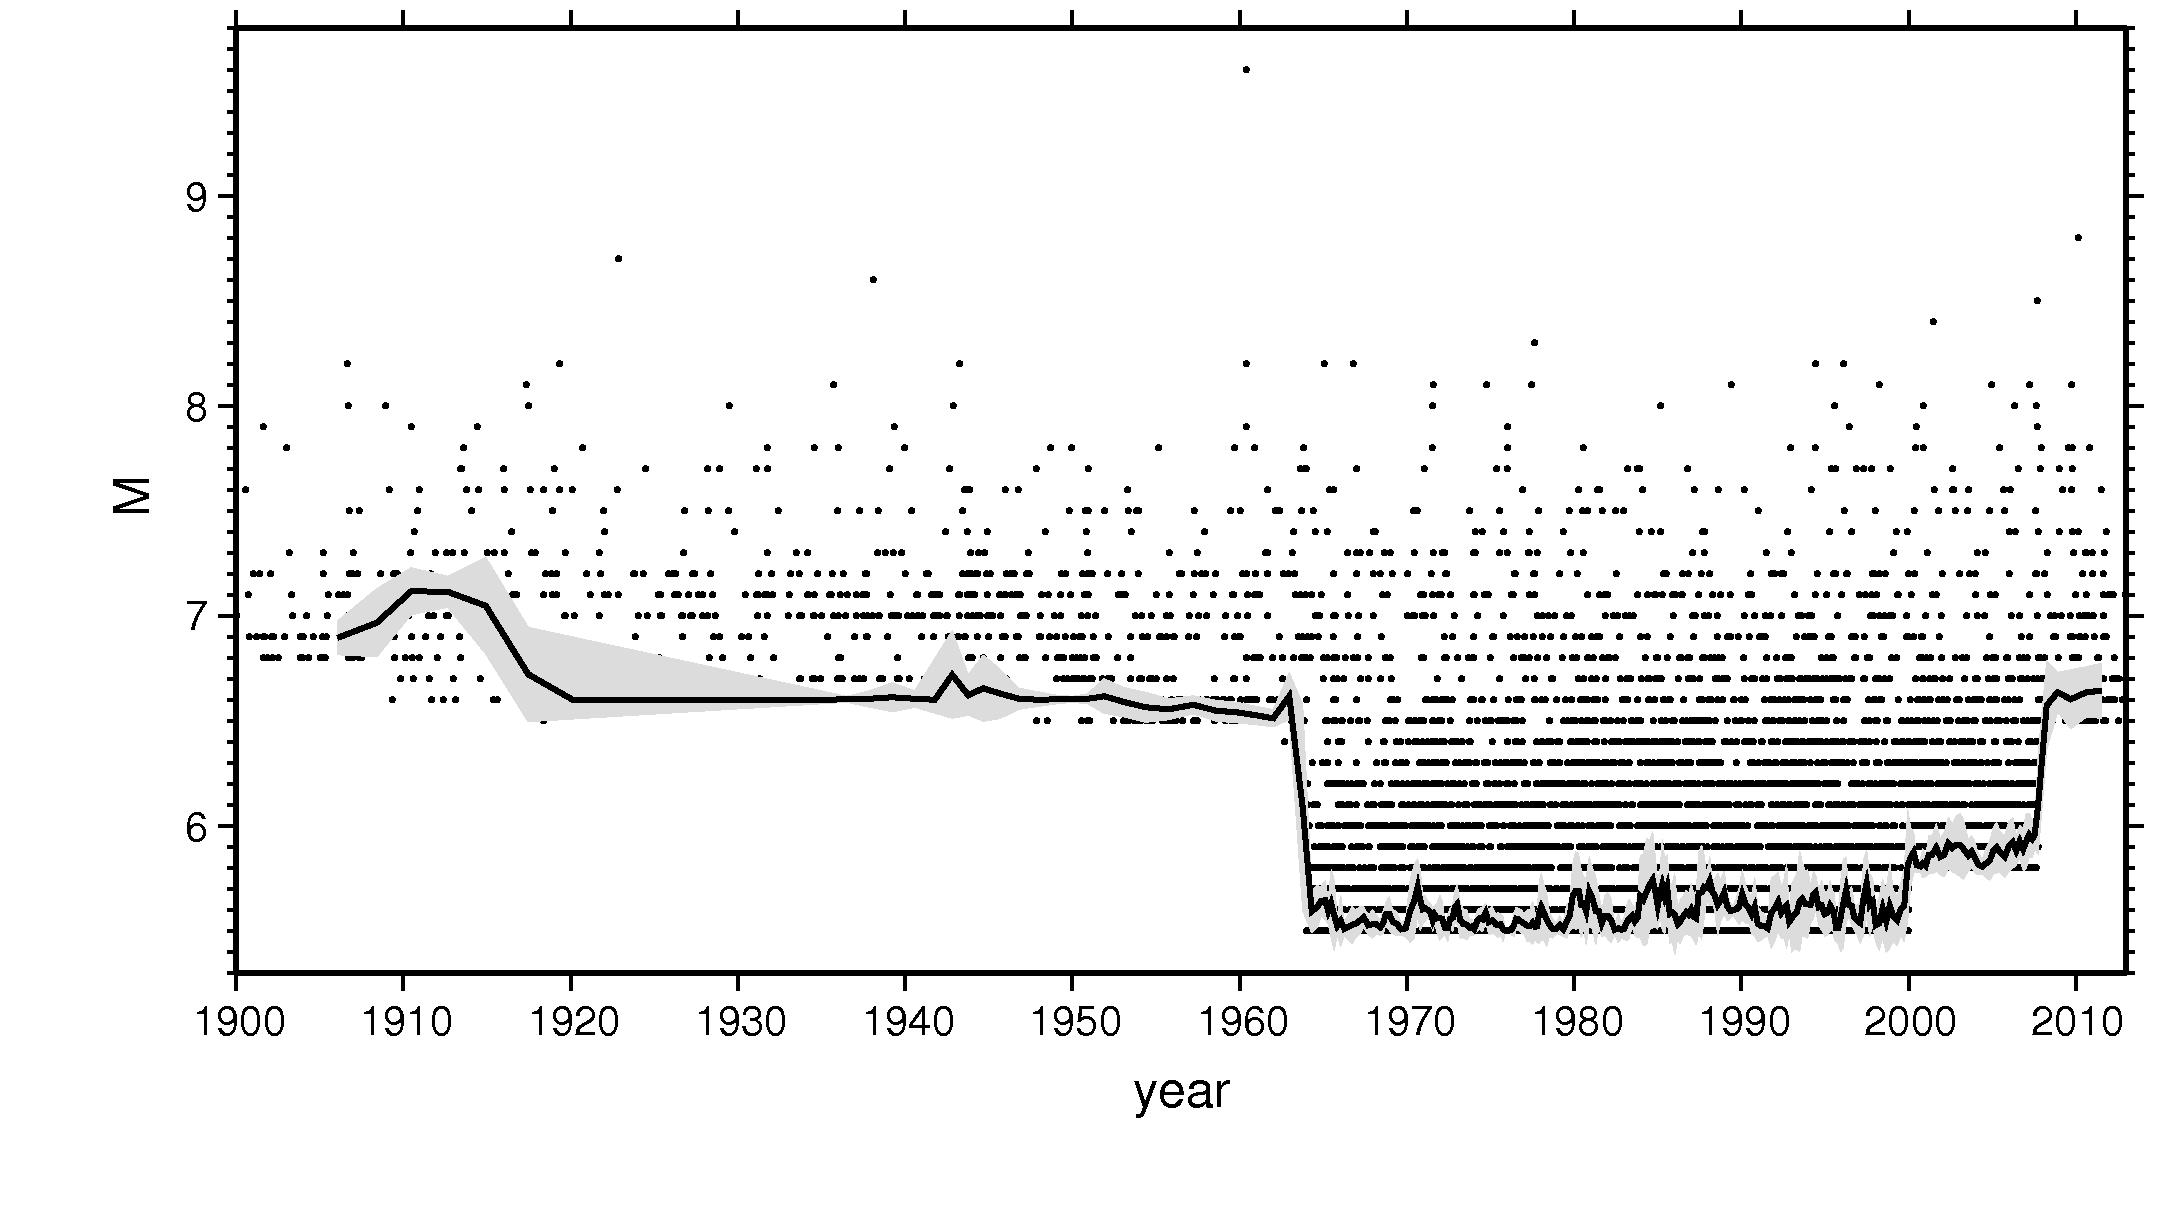
Figure S2. The same as Figure S1 for the northern hemisphere.
Figure S3. The same as Figure S1 for the southern hemisphere.
Wiemer, S. (2001). A Software Package to Analyze Seismicity: ZMAP, Seismol. Res. Lett. 72, 373–382.
Woessner, J., and S. Wiemer (2005). Assessing the Quality of Earthquake Catalogues: Estimating the Magnitude of Completeness and Its Uncertainty, Bull. Seismol. Soc. Am. 95, 684–698.
[ Back ]