The Collalto Seismic Network (Rete Sismica di Collalto, or RSC) is the infrastructure used to monitor the natural and induced seismicity of the natural gas storage concession known as Collalto Stoccaggio, which is located in northeastern Italy. This network was realized and is currently managed by the Istituto Nazionale di Oceanografia e di Geofisica Sperimentale (OGS), a public research institute, on behalf of Edison Stoccaggio S.p.A., the storage concession holder.
In our article, we describe the seismic network and the results obtained in the first two years of monitoring, from 1 January 2012 to 31 December 2013.
This electronic supplement provides some additional material about the following topics: the seismic hazard of the study area; some examples of waveforms recorded by the RSC; the 1D velocity model for localizing events using the basic procedure; an analysis of the P- and S-phase reading uncertainty; a preliminary analysis of the noise level; and the catalog of events recognized in the period 1 January 2012–31 December 2013.
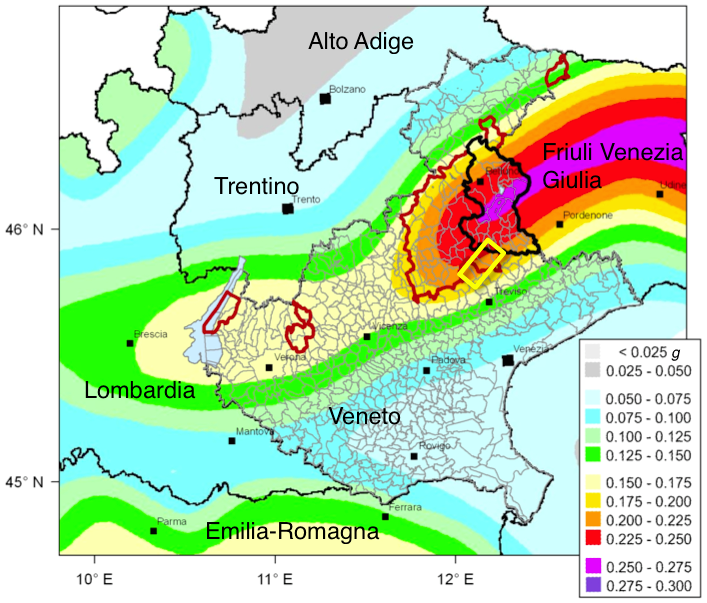
According to the actual national seismic-hazard map (Working Group MPS, 2004), the area that hosts the Collalto gas storage facility is characterized by medium-high seismic hazard, with conventional values (i.e., horizontal peak ground acceleration on rock site, at 90% probability of nonexceedance in 50 years) of 0.225–0.25 g (Fig. S1). The four municipalities affected by the gas storage activity have been included in seismic zone 2 (zone 1 being the most dangerous one) since 1982.
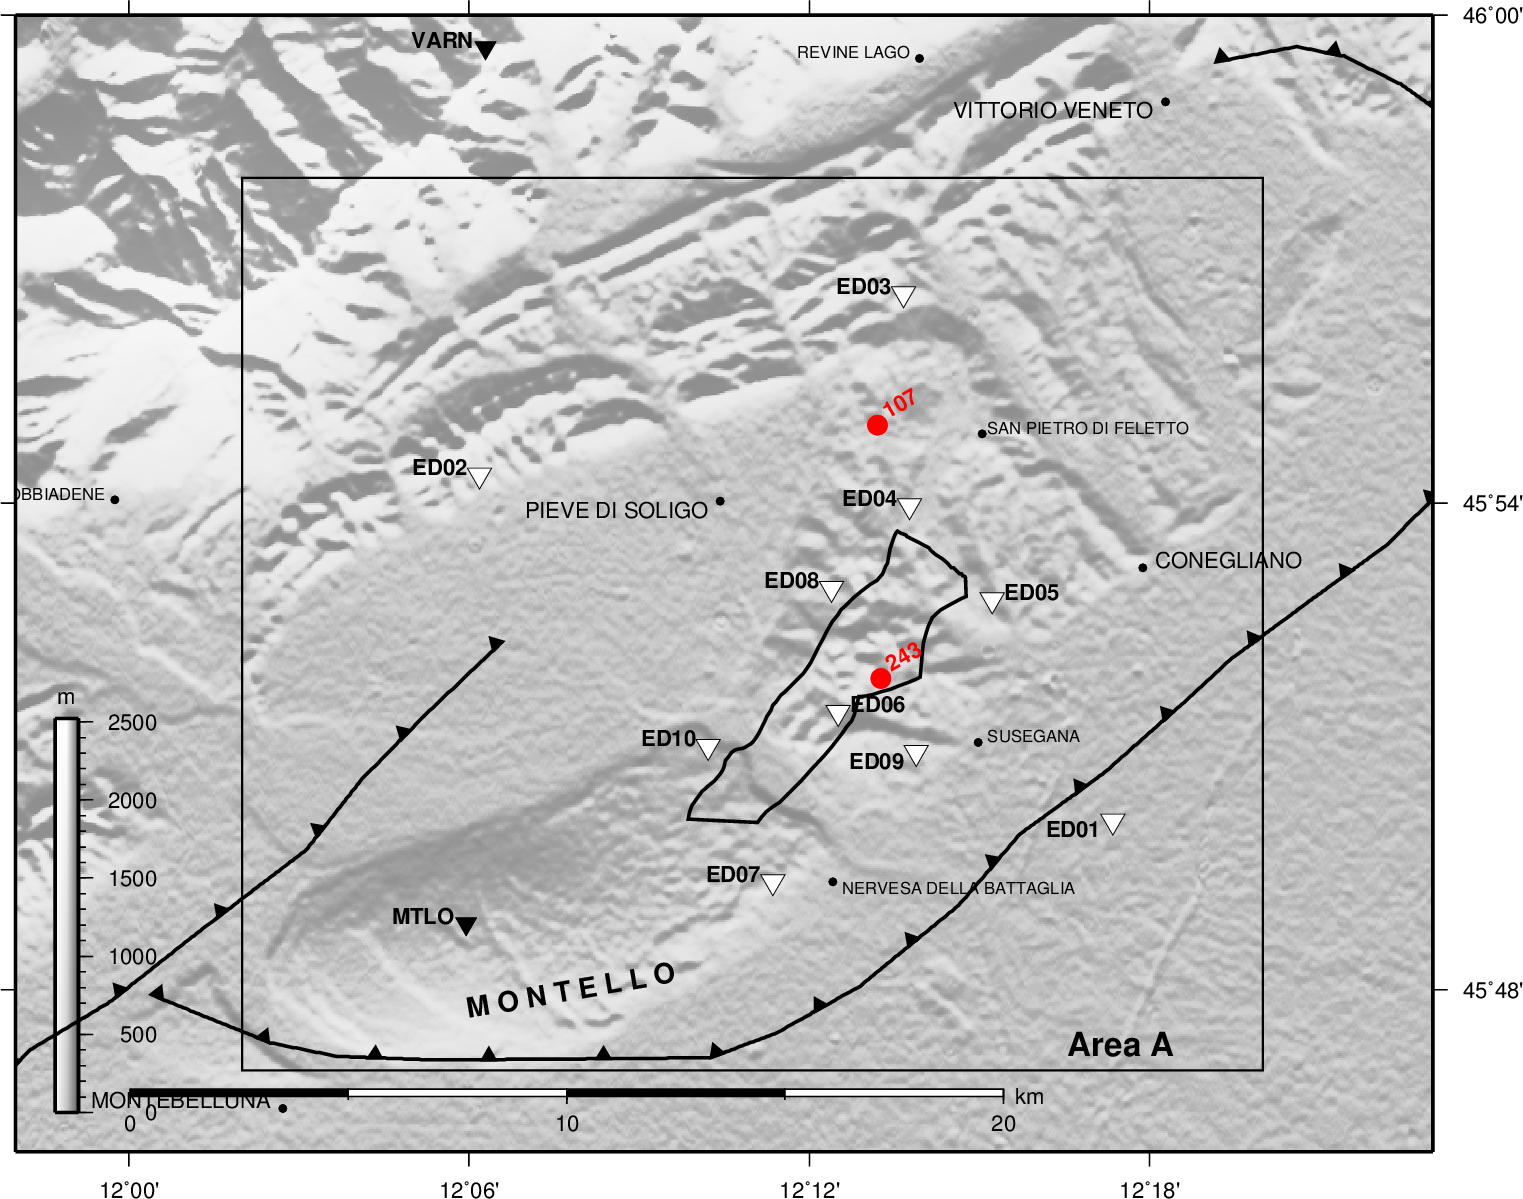
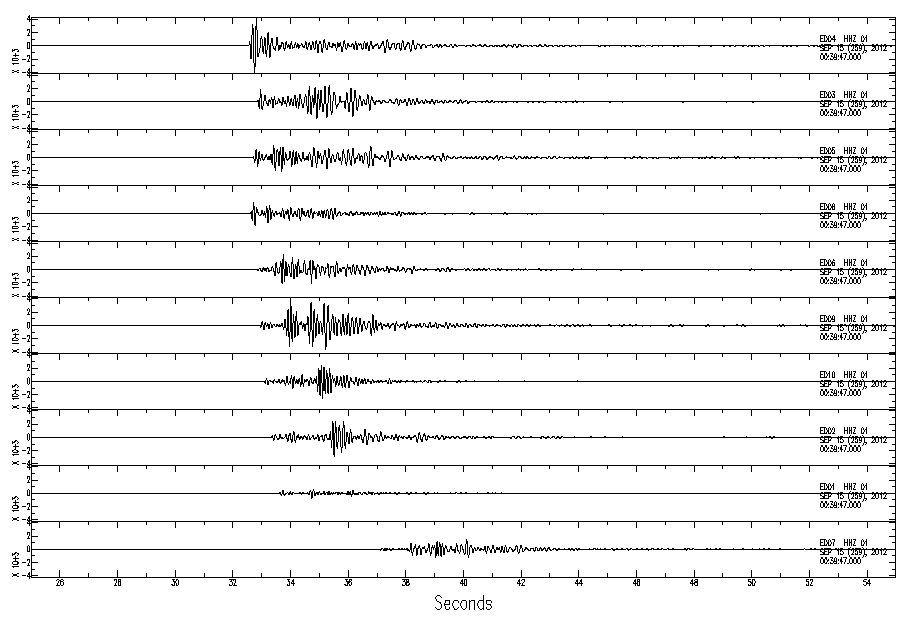
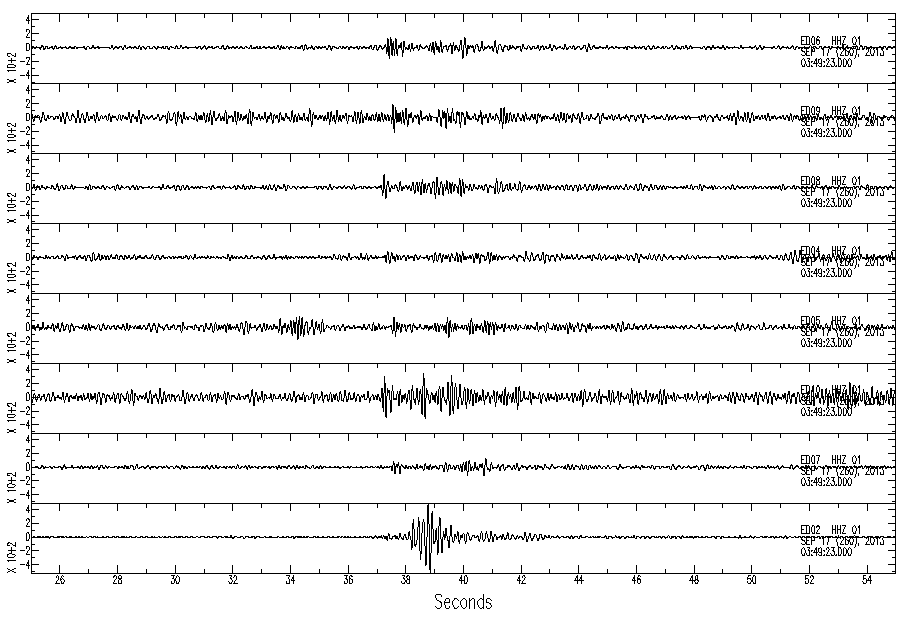
In this section, we show three examples of the waveforms recorded by the RSC stations. The first two examples refer to the two local events labeled as 107 and 243, which can be classified as weak and very weak, respectively. The parameters of these events are reported in Table S1, while their location is shown in Figure S2. The waveforms of the two events are displayed in Figures S3 and S4, respectively.
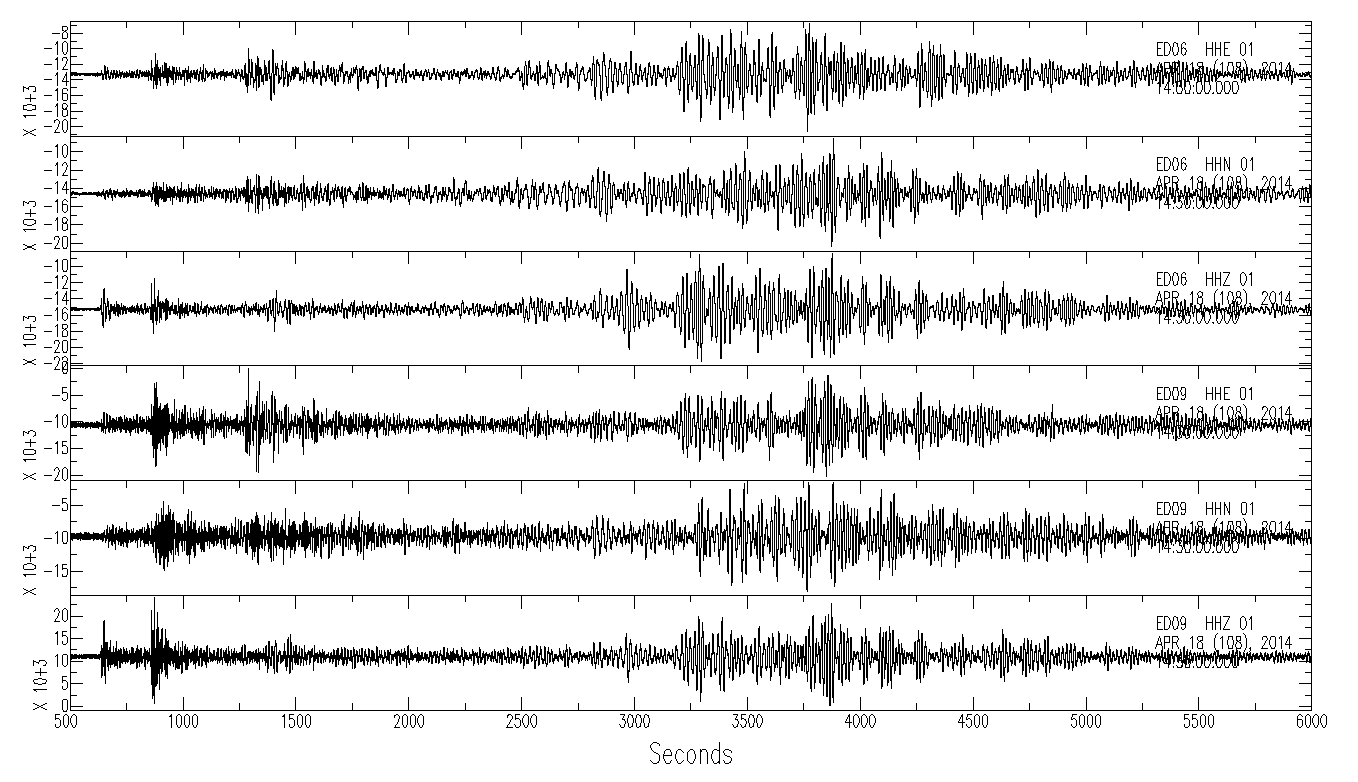
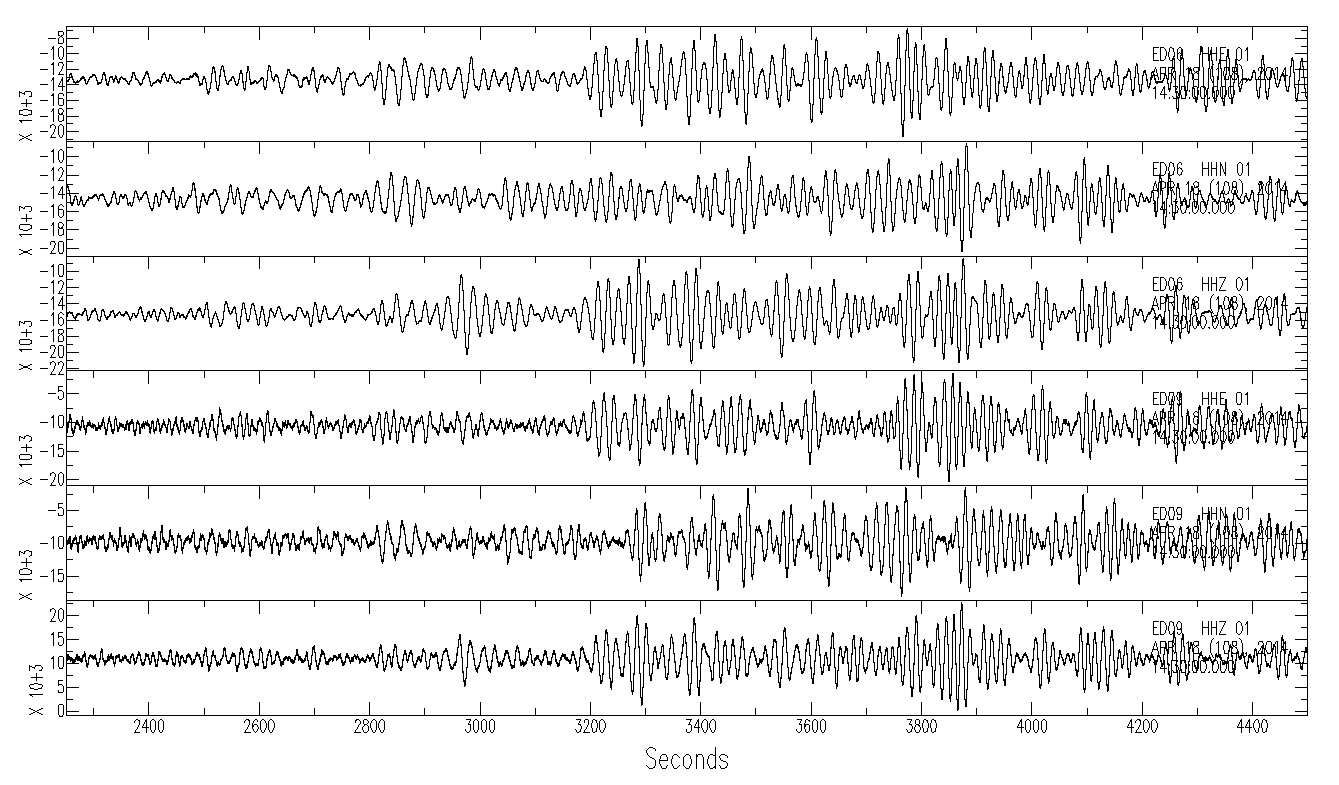
The third example refers to a teleseismic event, the Mw 7.2 earthquake that occurred near the Coast of Guerrero, Mexico, on 19 April 2014 at origin time 14:27:36 UTC (see also http://www.iris.edu/spud/momenttensor/6703379; last accessed September 2014), at a distance of about 10,400 km from the RSC. Figures S5 and S6, show the three-component seismograms recorded by stations ED06 and ED09, which are equipped with a very broadband sensor with proper period T = 120 s and a compact borehole sensor with proper period extended to T = 10 s, respectively. Thus, the two figures are useful to illustrate both the similar performance of the two sensors (Fig. S5) and the excellent performance of the compact sensor, even for the very long periods of a teleseismic event (Fig. S6).
The 1D velocity model adopted by the RSC for the so-called zero-level data processing is the same as the regional velocity model adopted by the Northeastern Italy Integrated Seismic Network (NEI), managed by the OGS (Priolo et al., 2005; Bragato et al., 2011). This model is listed in Table S2.
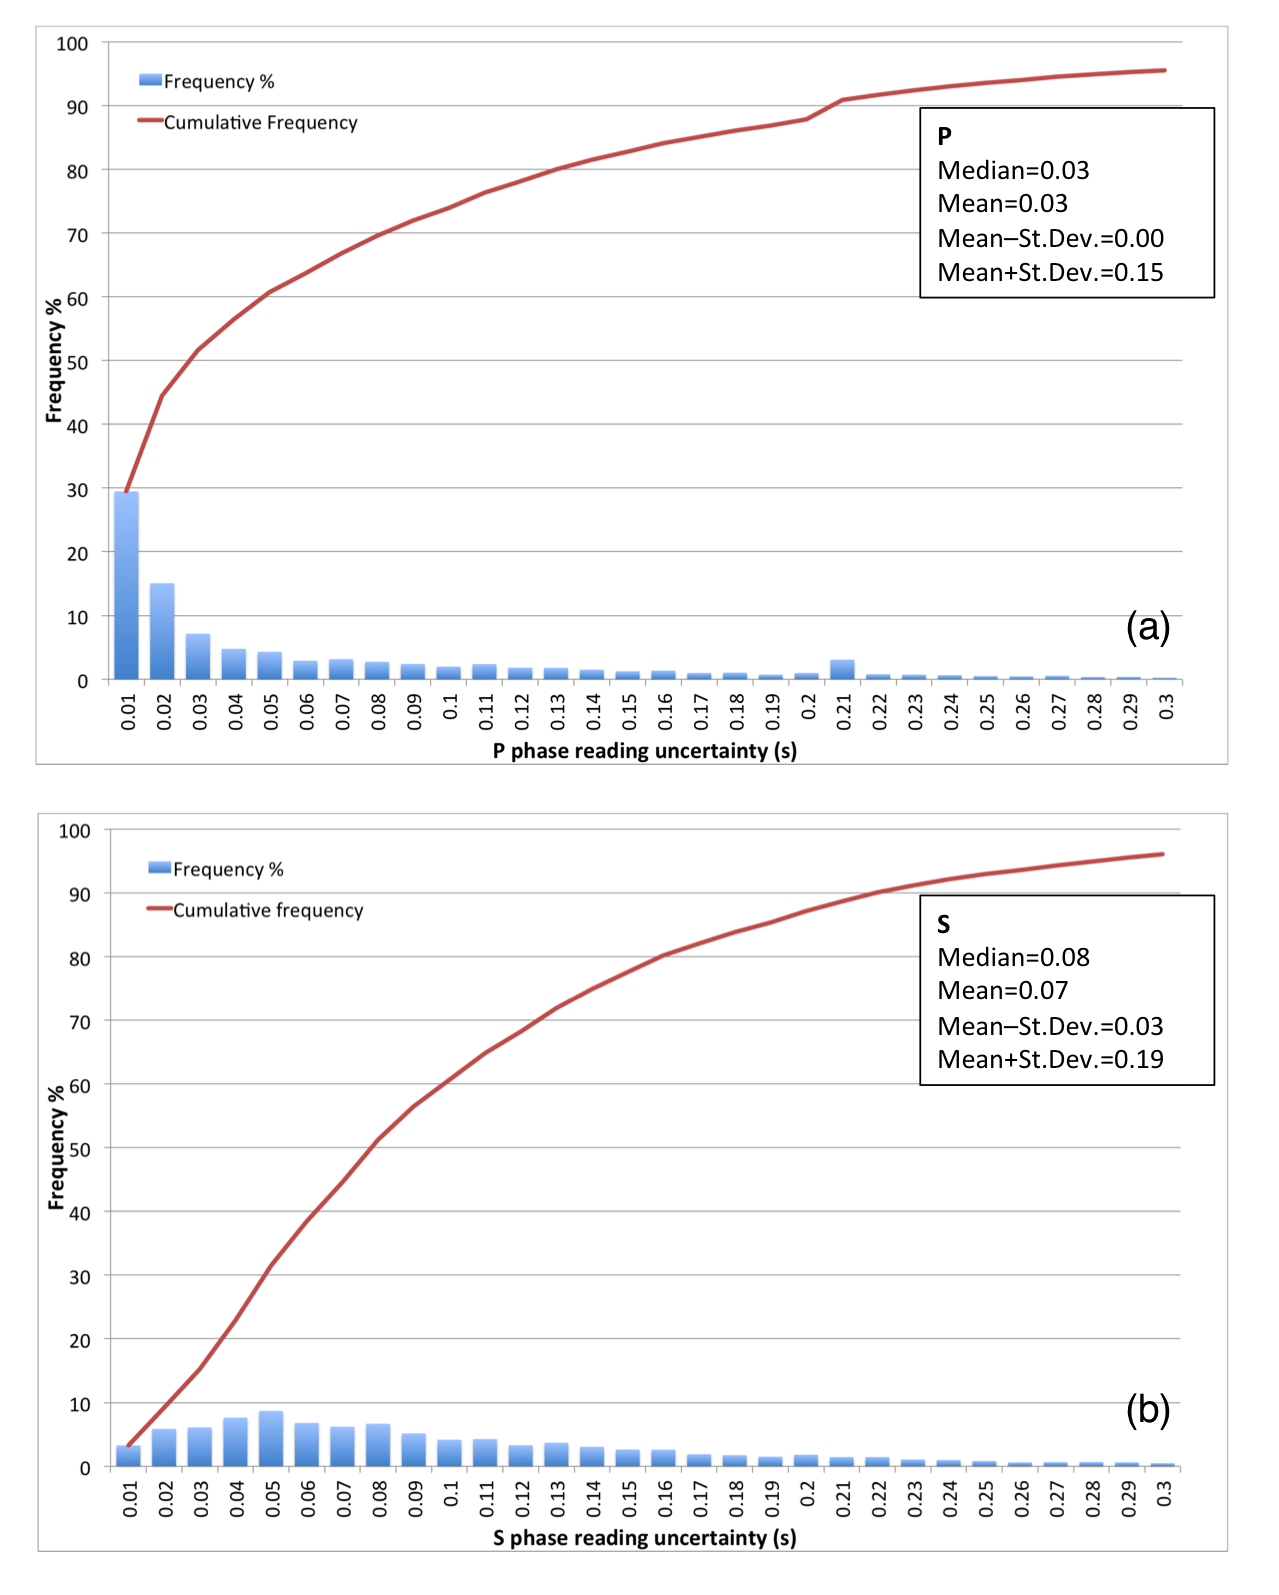
Figure S7 shows the distribution of the picking uncertainty values for the 2012–2013 dataset for the P and S waves, respectively. The mean/median values for the P- and S-phase reading uncertainty are about 0.03/0.03 and 0.08/0.07 s, respectively. Note also that the 68% percentile of the uncertainty, which corresponds to the mean plus one standard deviation, has values of 0.15 s and 0.19 s for the P and S phases, respectively.
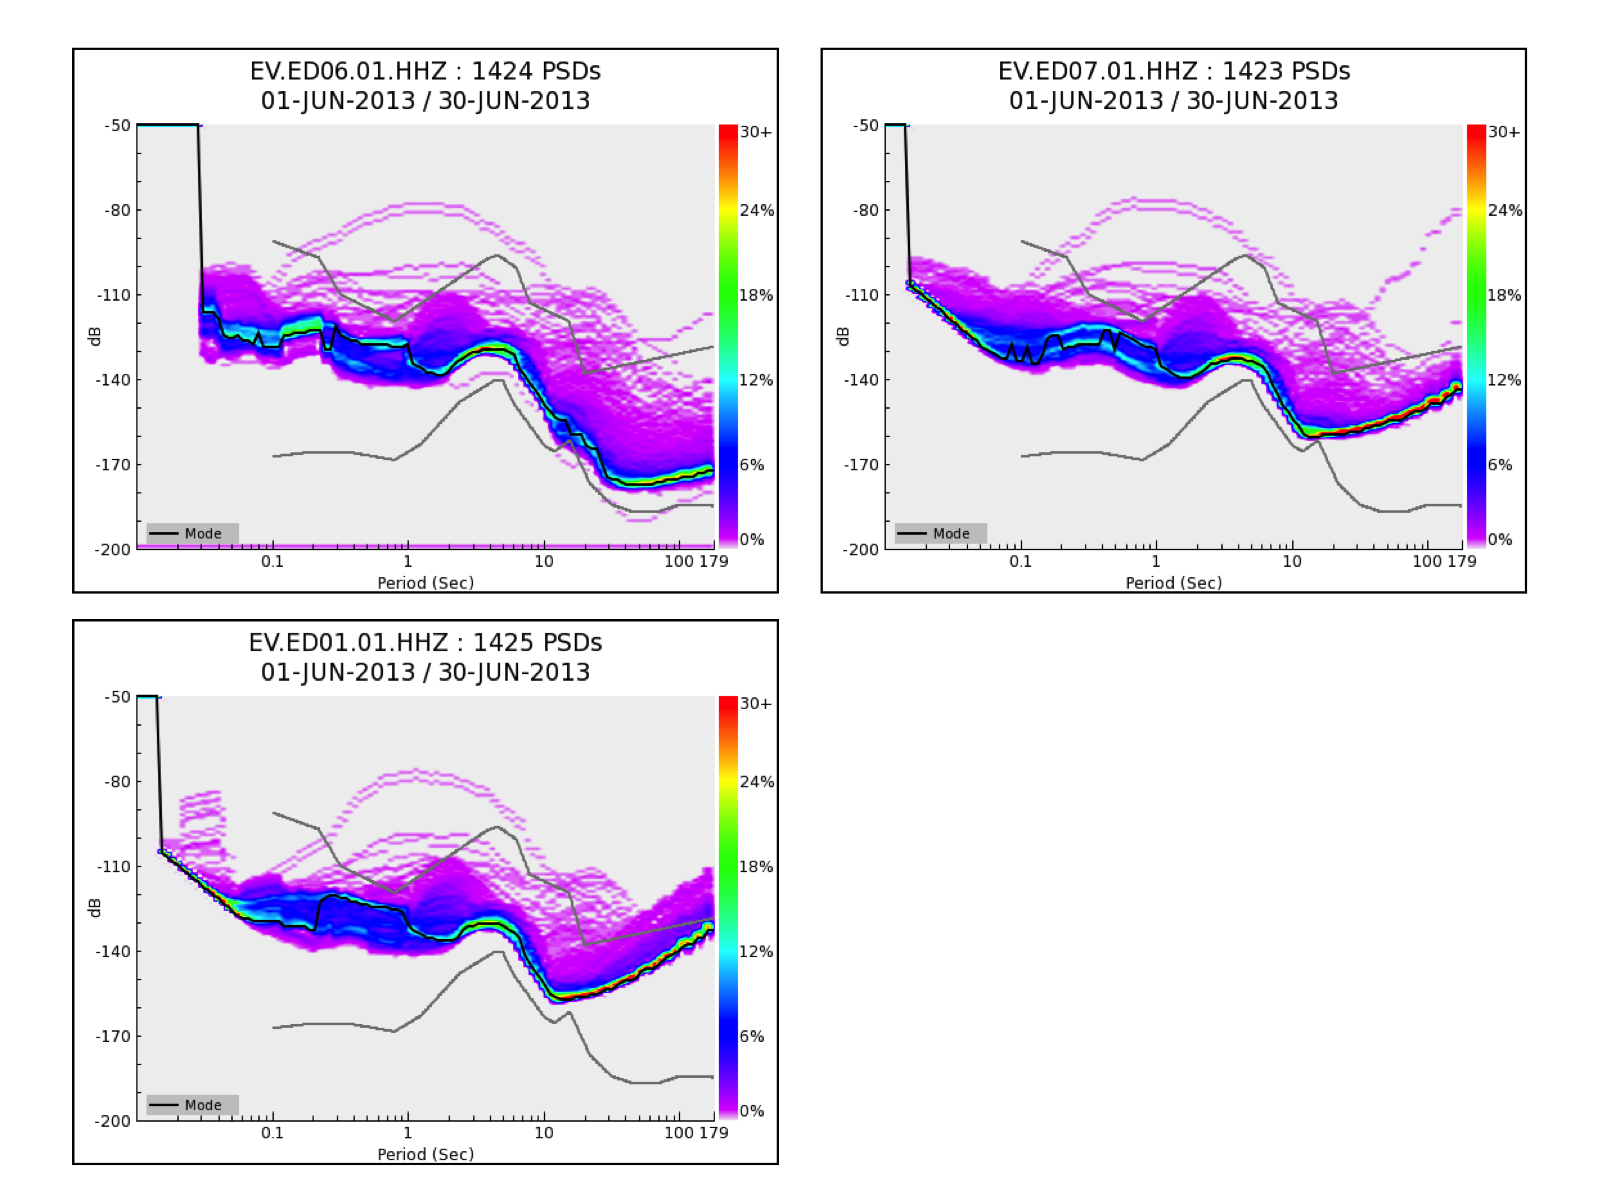
We present here a preliminary analysis of the noise level for some of the RSC stations. Figure S8 shows the probability density diagrams computed by PQLX software (http://ds.iris.edu/ds/nodes/dmc/software/downloads/pqlx/; last accessed September 2014) for three stations: ED06, ED07, and ED01 (see also Table 1 and the map in Fig. 1 in the main text). Station ED06 (Collalto Campo 6) is equipped with a broadband seismometer (Güralp CMG-3T, T = 120 s), which is located at a depth of about 5 m within one of the Edison Stoccaggio fields. ED07 (Nervesa della Battaglia) and ED01 (Susegana S. Lucia) are both equipped with an extended-band compact borehole seismometer (Güralp CMG-SP1, T = 10 s); sensors are located at depths of 14.5 m and 155 m, respectively. Unlike all the other stations, ED01 is located within the weakly consolidated alluvial sediments of the Venetian Plain; the well has been set deep in order to overcome this problem.
All the stations show a very good quality level in the period band T ≥ 2 s, which is very close to the new low-noise model (NLNM) (Fig. S8). In particular, for the broadband station ED06, the high-quality band extends to the natural period of the sensor (i.e., 120 s). For the other two stations, the signal quality decays progressively at periods longer than the sensor’s natural frequency (10 s); however, it still remains below the new high-noise model (NHNM) curve in a large band. In periods from about 0.1 to 2 s, the low noise level stays in the −130 dB and −140 dB range for all the displayed stations. Two facts are notable for this band: (1) a considerable presence of noise can be recognized (see several different higher density curves), and (2) the 150 m deep well of station ED01 is really effective in reducing the noise to a level comparable to the one featured by the other stations, which are located at a shallow depth on highly consolidated soil or rock.
The same analysis performed on the whole observation period reveals a larger signal dispersion due to several factors, such as local anthropogenic noise, seasonal/weather effects, and temporary malfunctioning of instruments and sensors. A more careful case-by-case analysis is needed in order to interpret data correctly.
Table S3 contains the catalog of the events recorded during the period 1 January 2012–31 December 2013.
Figure S1. Seismic hazard map of northeastern Italy (Working Group MPS, 2004). The yellow rectangle indicates the location of the Collalto gas storage license. Large and small labels indicate names of the administrative regions or autonomous provinces and major cities, respectively. For the Veneto region, the municipal administrative borders are shown. Thick-bordered areas in the Veneto show the municipalities entered into seismic zoning in the late 1930s (black color) and early 1980s (red color), respectively.
Figure S2. Locations of the local events 107 and 243, respectively, as reported in the full event list contained in Table S3.
Figure S3. Waveforms (Z component) recorded by the RSC station for the local event 107 with magnitude ML 1.0. Waveforms have been band-pass filtered in the 5–12 Hz frequency band.
Figure S4. Same as Figure S3, but for local event 243 with magnitude ML −0.3.
Figure S5. Three-component waveforms recorded by stations ED06 and ED09 for the teleseismic event Mw 7.2, which occurred off the Coast of Guerrero, Mexico, on 19 April 2014 at 14:27:36 UTC.
Figure S6. Same as Figure S5 except for the time window 2250–4500 s (total length of 1250 s), corresponding to the arrival of the first surface waves.
Figure S7. (a) P- and (b) S-phase reading distribution. The bar plots indicate the distribution of the values, and the red curves show the cumulative distribution. The insets show the values of the median, mean, and mean plus/minus the first standard deviation. The latter ones are estimated by assuming that data obey a semi-log distribution.
Figure S8. Example of background seismic noise levels estimated by PQLX software for three stations of the RSC network (ED06, ED07, and ED01). Each panel represents one month of data (vertical component) corresponding to the 1 June 2013–30 June 2013 period. The two solid curves represent the new low- and new high-noise models (NLNM and NHNM), respectively (Peterson, 1993).
Table S1. Parameters of the two local events shown in Figure S2 (waveforms in Figs. S3 and S4). Parameters are as follows: id, sequential identification number; area, area label; date, event date (yyyy/mm/dd); time, event origin time (hh:mm:ss.ss UTC); lat, event latitude (°); lon, event longitude (°); depth, event depth; Ml, event local magnitude (ML); Q, localization quality; GAP, gap of localization; No, number of observations (i.e., phases) used for localizing; Ns, number of stations used for localizing; errh, horizontal error; errv, vertical error; rms, root mean residual; and Location, epicenter municipality.
Table S2. One-dimensional regional model adopted by the RSC for localizing events.
Table S3 [Plain Text; 32 KB]. Catalog of the events recorded during the period 1 January 2012–31 December 2013. Column heads are as listed for Table S1.
Bragato, P. L., P. Di Bartolomeo, D. Pesaresi, M. P. Plasencia Linares, and A. Saraò (2011). Acquiring, archiving, analyzing and exchanging seismic data in real time at the Seismological Research Center of the OGS in Italy, Annals of Geophysics 54, no. 1, 67–75, doi: 10.4401/ag-4958
Peterson, J. (1993). Observation and modeling of seismic background noise, U.S. Geol. Surv. Tech. Rept. 93-322, 1–95.
Priolo E., C. Barnaba, P. Bernardi, G. Bernardis, P. L. Bragato, G. Bressan, M. Candido, E. Cazzador, P. Di Bartolomeo, G. Durì, S. Gentili, A. Govoni, P. Klinc, S. Kravanja, G. Laurenzano, L. Lovisa, P. Marotta, F. Ponton, A. Restivo, M. Romanelli, A. Snidarcig, S. Urban, A. Vuan, and D. Zuliani (2005). Seismic monitoring in northeastern Italy: A ten-year experience, Seismol. Res. Lett. 76, no. 4, 446–454.
Working Group MPS (2004). Redazione della mappa di pericolosità sismica prevista dall’Ordinanza PCM 3274 del 30 marzo 2003, Rapporto conclusivo per il Dipartimento di Protezione Civile, Istituto Nazionale di Geofisica e Vulcanologia (INGV), Milano–Roma, aprile 2004, 65 pp.+5 appendici (in Italian), http://zonesismiche .mi.ingv.it/documenti/rapporto_conclusivo.pdf (last accessed September 2014).
[ Back ]