This electronic supplement consists of a table detailing parameters for the stations used in this study and four figures highlighting interesting tangents to the main points of the paper.
Table S1 [Plain Text CSV; 4 KB]. Station parameters (name, location, sample rate, and emplacement type) for each seismic station used in this study of Antarctica’s seismic noise environment.
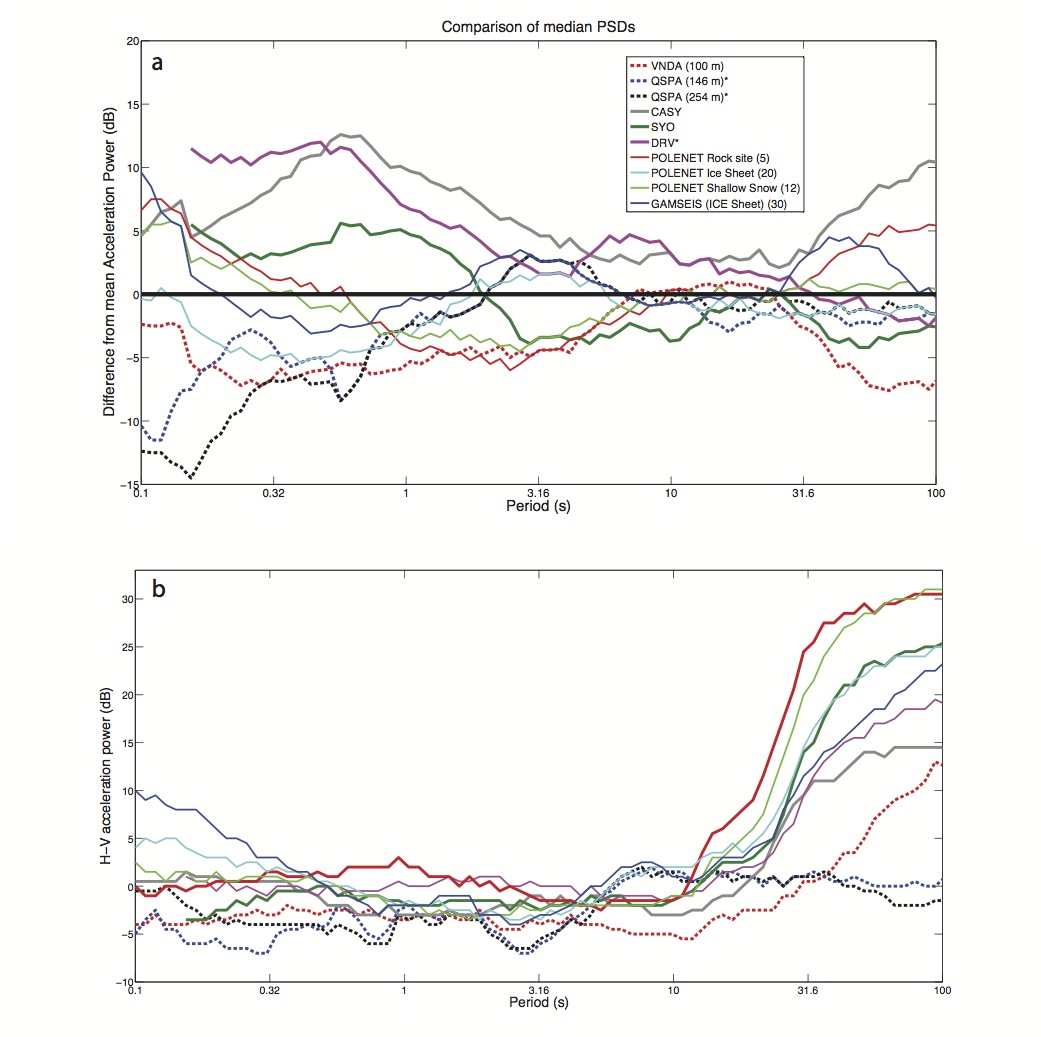
Figure S1. (a) Median power spectral density (PSD) differences (as in Figure 3b in the main article) for different emplacement types between 2008 and 2012. Borehole sensors are indicated by dashed lines, and the numbers in the legend represent the number of stations included in the median PSD estimate. Due to instrumentation issues, we only used data from February 2011 to December 2012 for the 146 m borehole and didn’t include 2012 data for the 254 m borehole. Also, due to data availability in the Incorporated Research Institutions for Seismology (IRIS) Data Management System, station DRV data is only through 2010. (b) Subtracting the median horizontal power from vertical power for the different emplacement types is a proxy for sensor tilt.
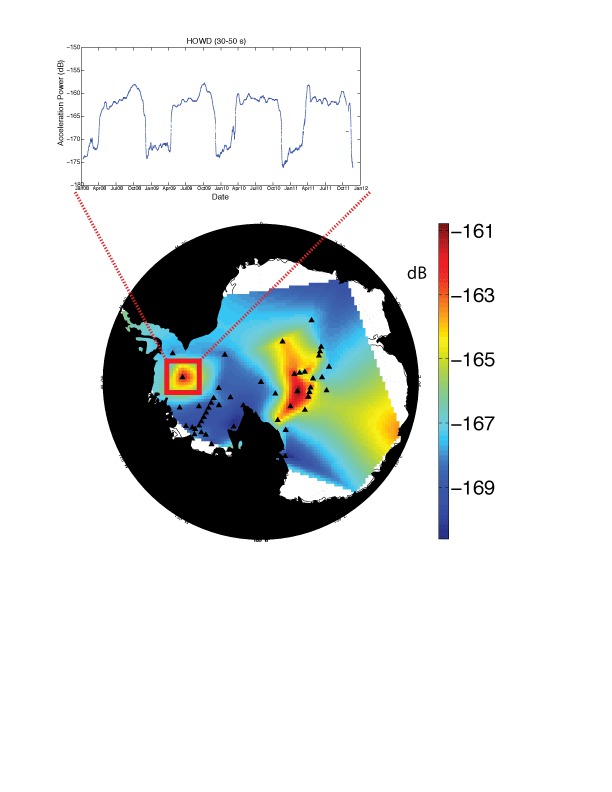
Figure S2. Interpolated noise map of Antarctica for the intermediate period band (20–50 s) median vertical component power for all stations. Station HOWD and several instruments from AGAP were omitted from our final noise map in this band (Figure 5 in main article) because their anomalously high noise levels and unique seasonality are caused by the development of long-period convection cells forming on the vertical components during the colder months (Anthony et al., 2011; T. Parker [IRIS-Program for the Array Seismic Studies of the Continental Lithosphere], personal comm.). The two-week moving average of HOWD shows that this phenomenon causes noise in this band to increase by over 10 dB.
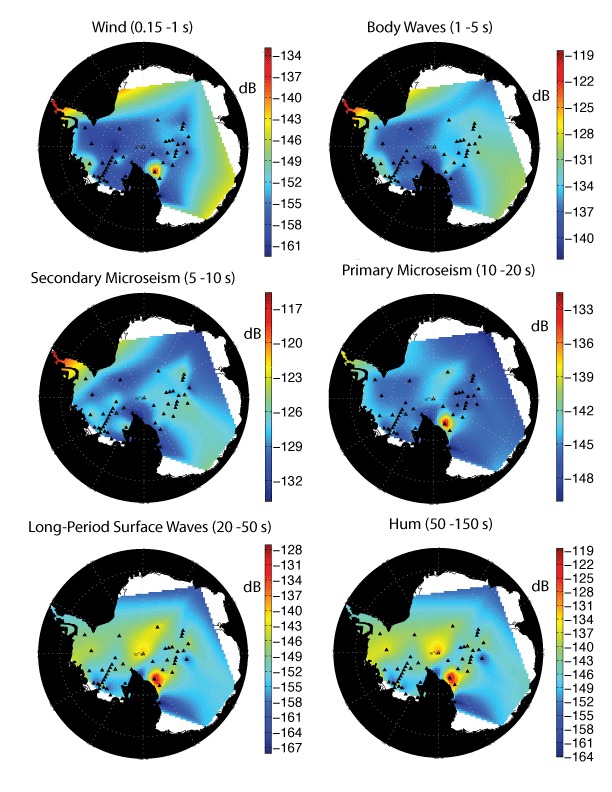
Figure S3. Interpolated noise maps of Antarctica for the six period bands using the median BHN (north–south) component power in each, for a total of 59 seismic stations (QSPA surface station used) located across the continent (triangles).
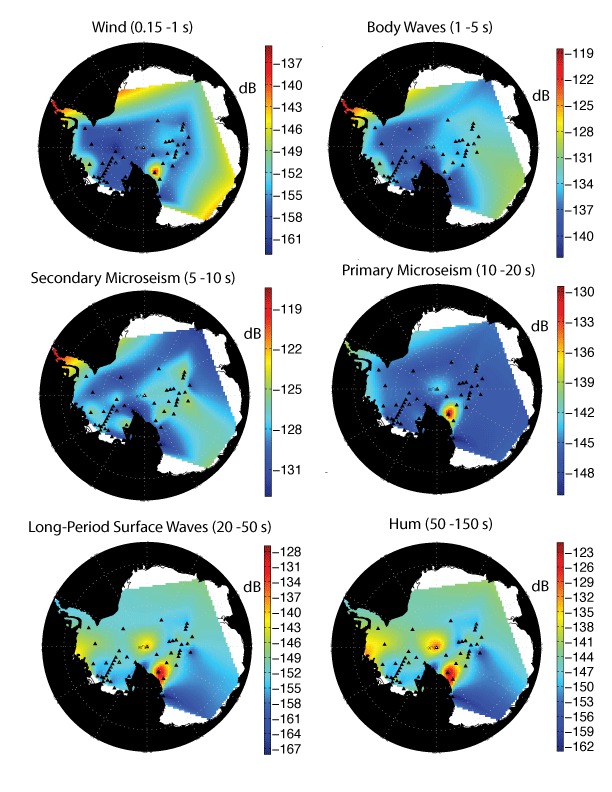
Figure S4. Interpolated noise map of Antarctica for the six period bands using the median BHE (east–west) component power in each, for a total of 59 seismic stations (QSPA surface station used) located across the continent (triangles).
Anthony, R. E., R. C. Aster, D. A. Wiens, A. Nyblade, and C. A. Rowe (2011). Seismic noise levels across Antarctica, American Geophysical Union Fall Meeting Abstracts, San Francisco, California, 5–9 December 2011, Abstract Number 2204.
[ Back ]