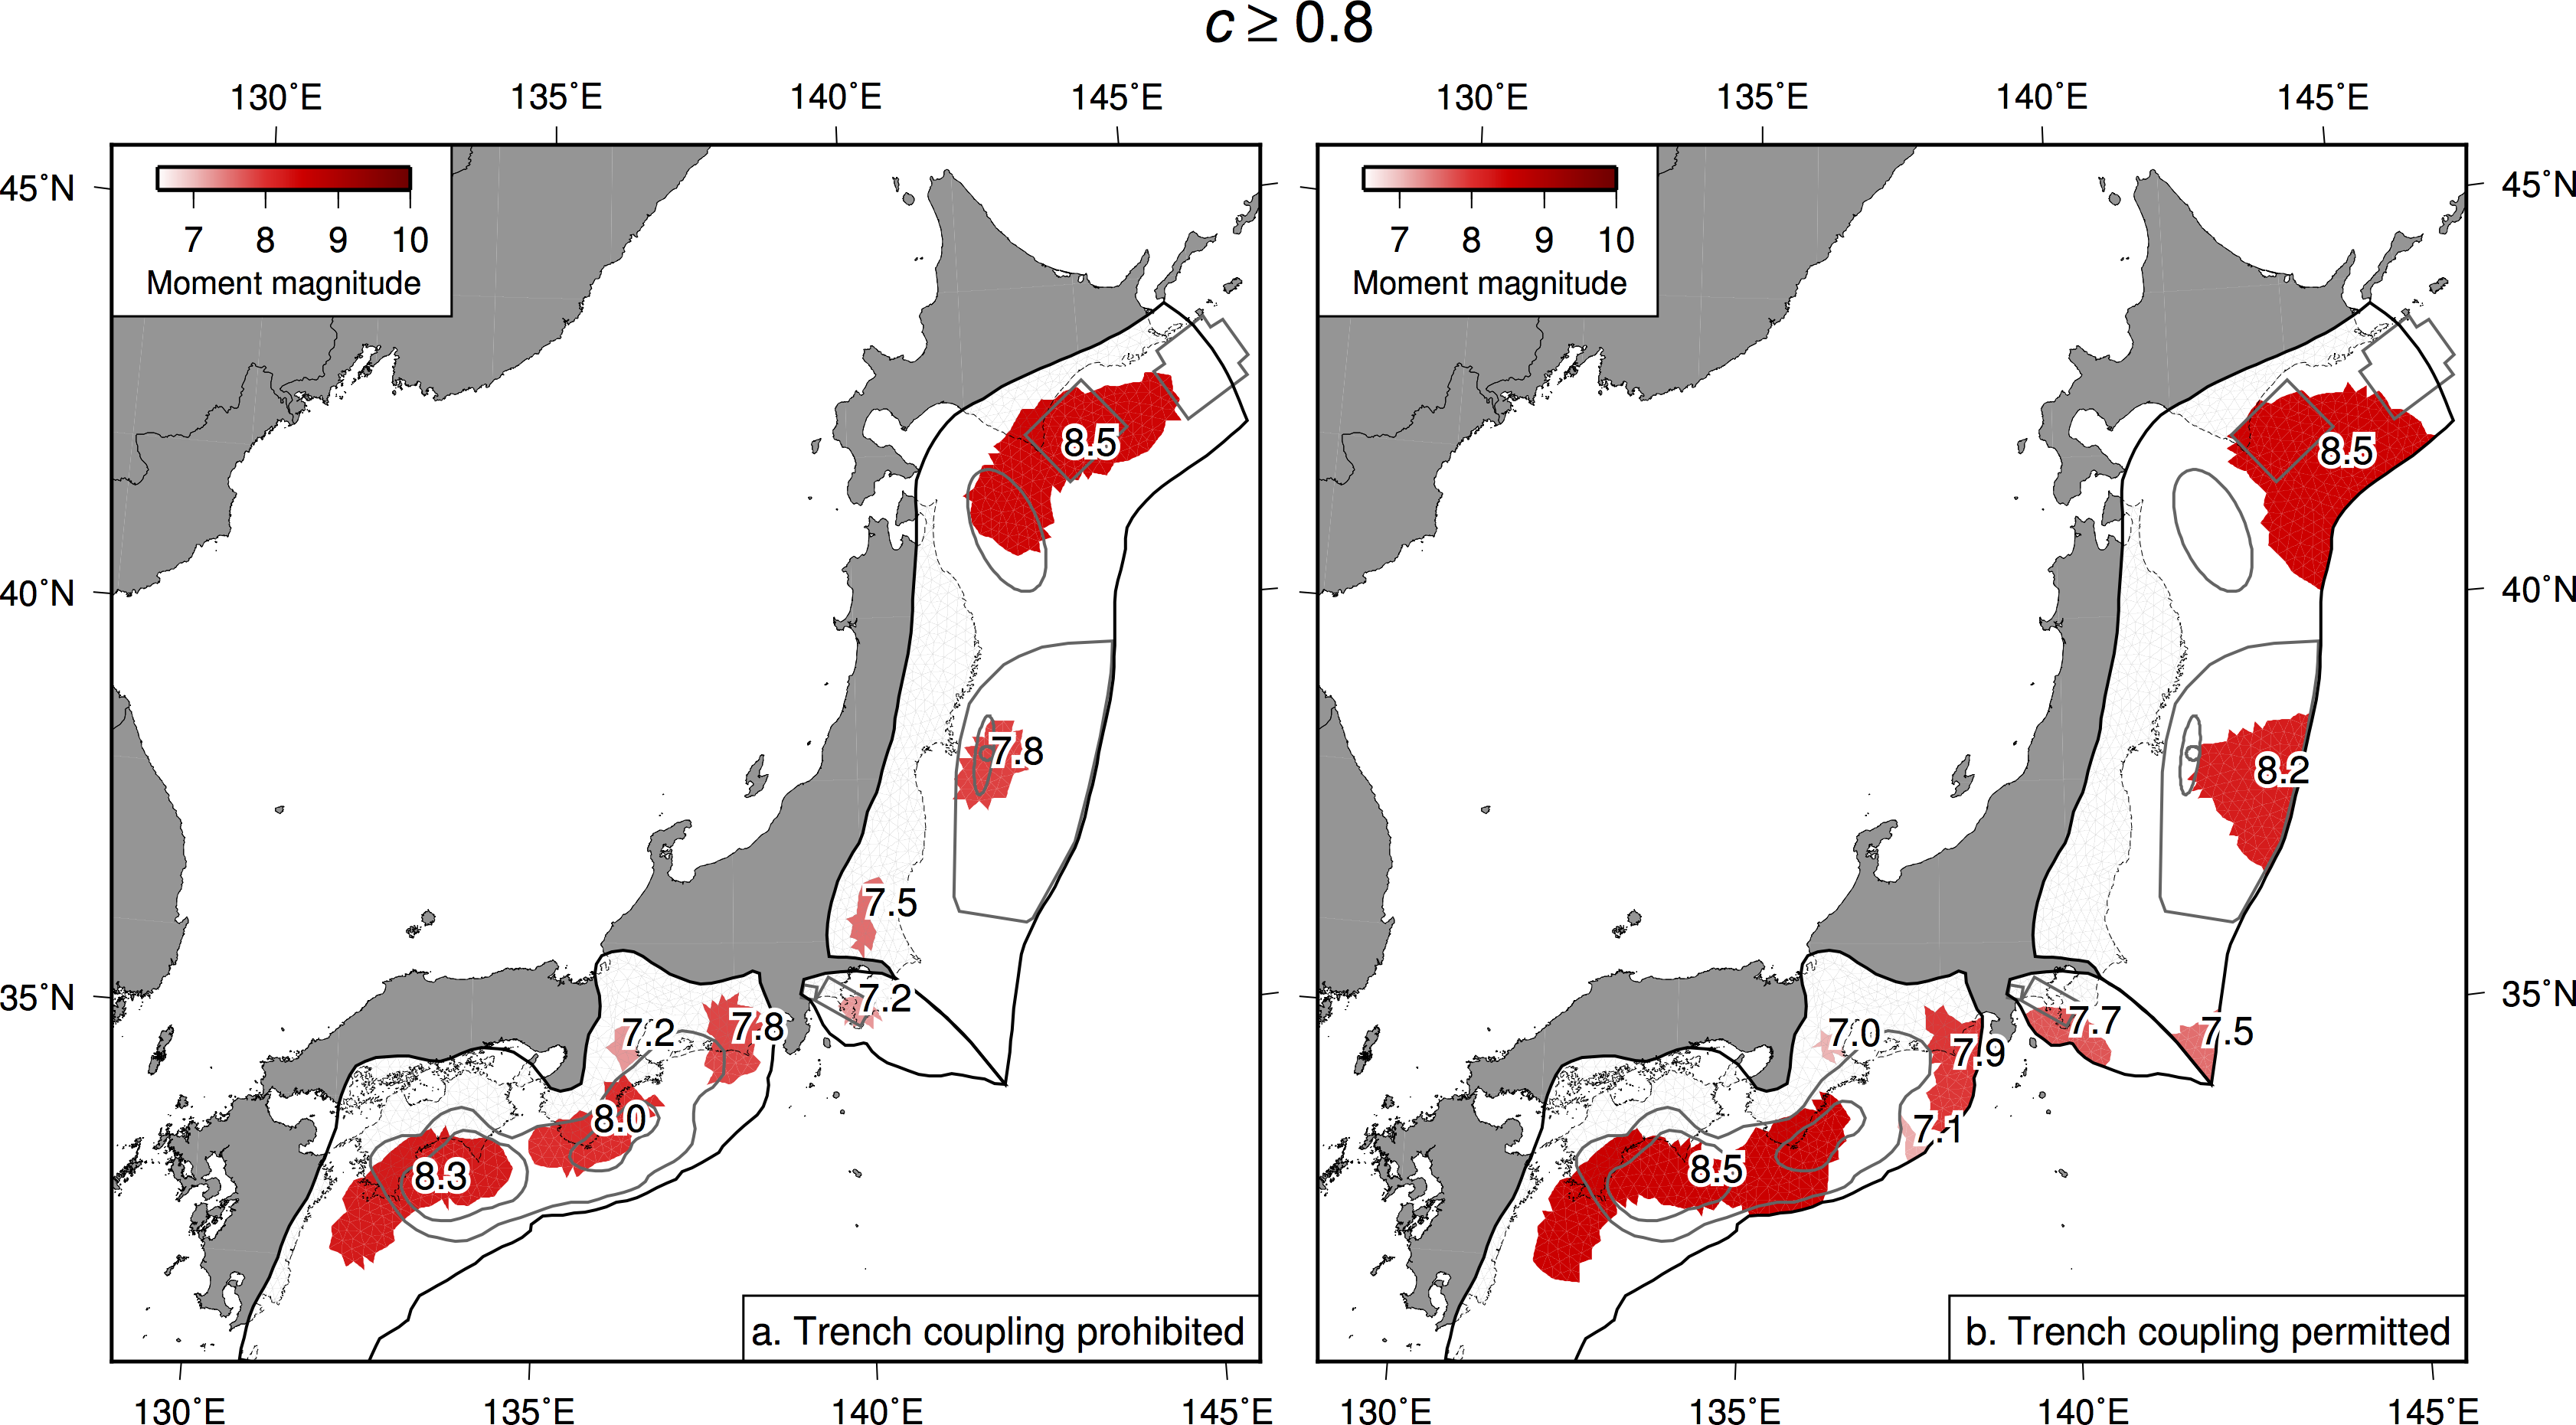
Figures S1–S10 each show estimated rupture scenarios using a specified coupling fraction (c) to define coupled areas. Coupling values of c ≥ 0.3 and c ≥ 0.8 are shown in Figure 3 of the main text. The supplementary figures show similar results but for different values of c, considering two sets of boundary conditions regarding the coupling of the near-trench portion of the subduction interface.
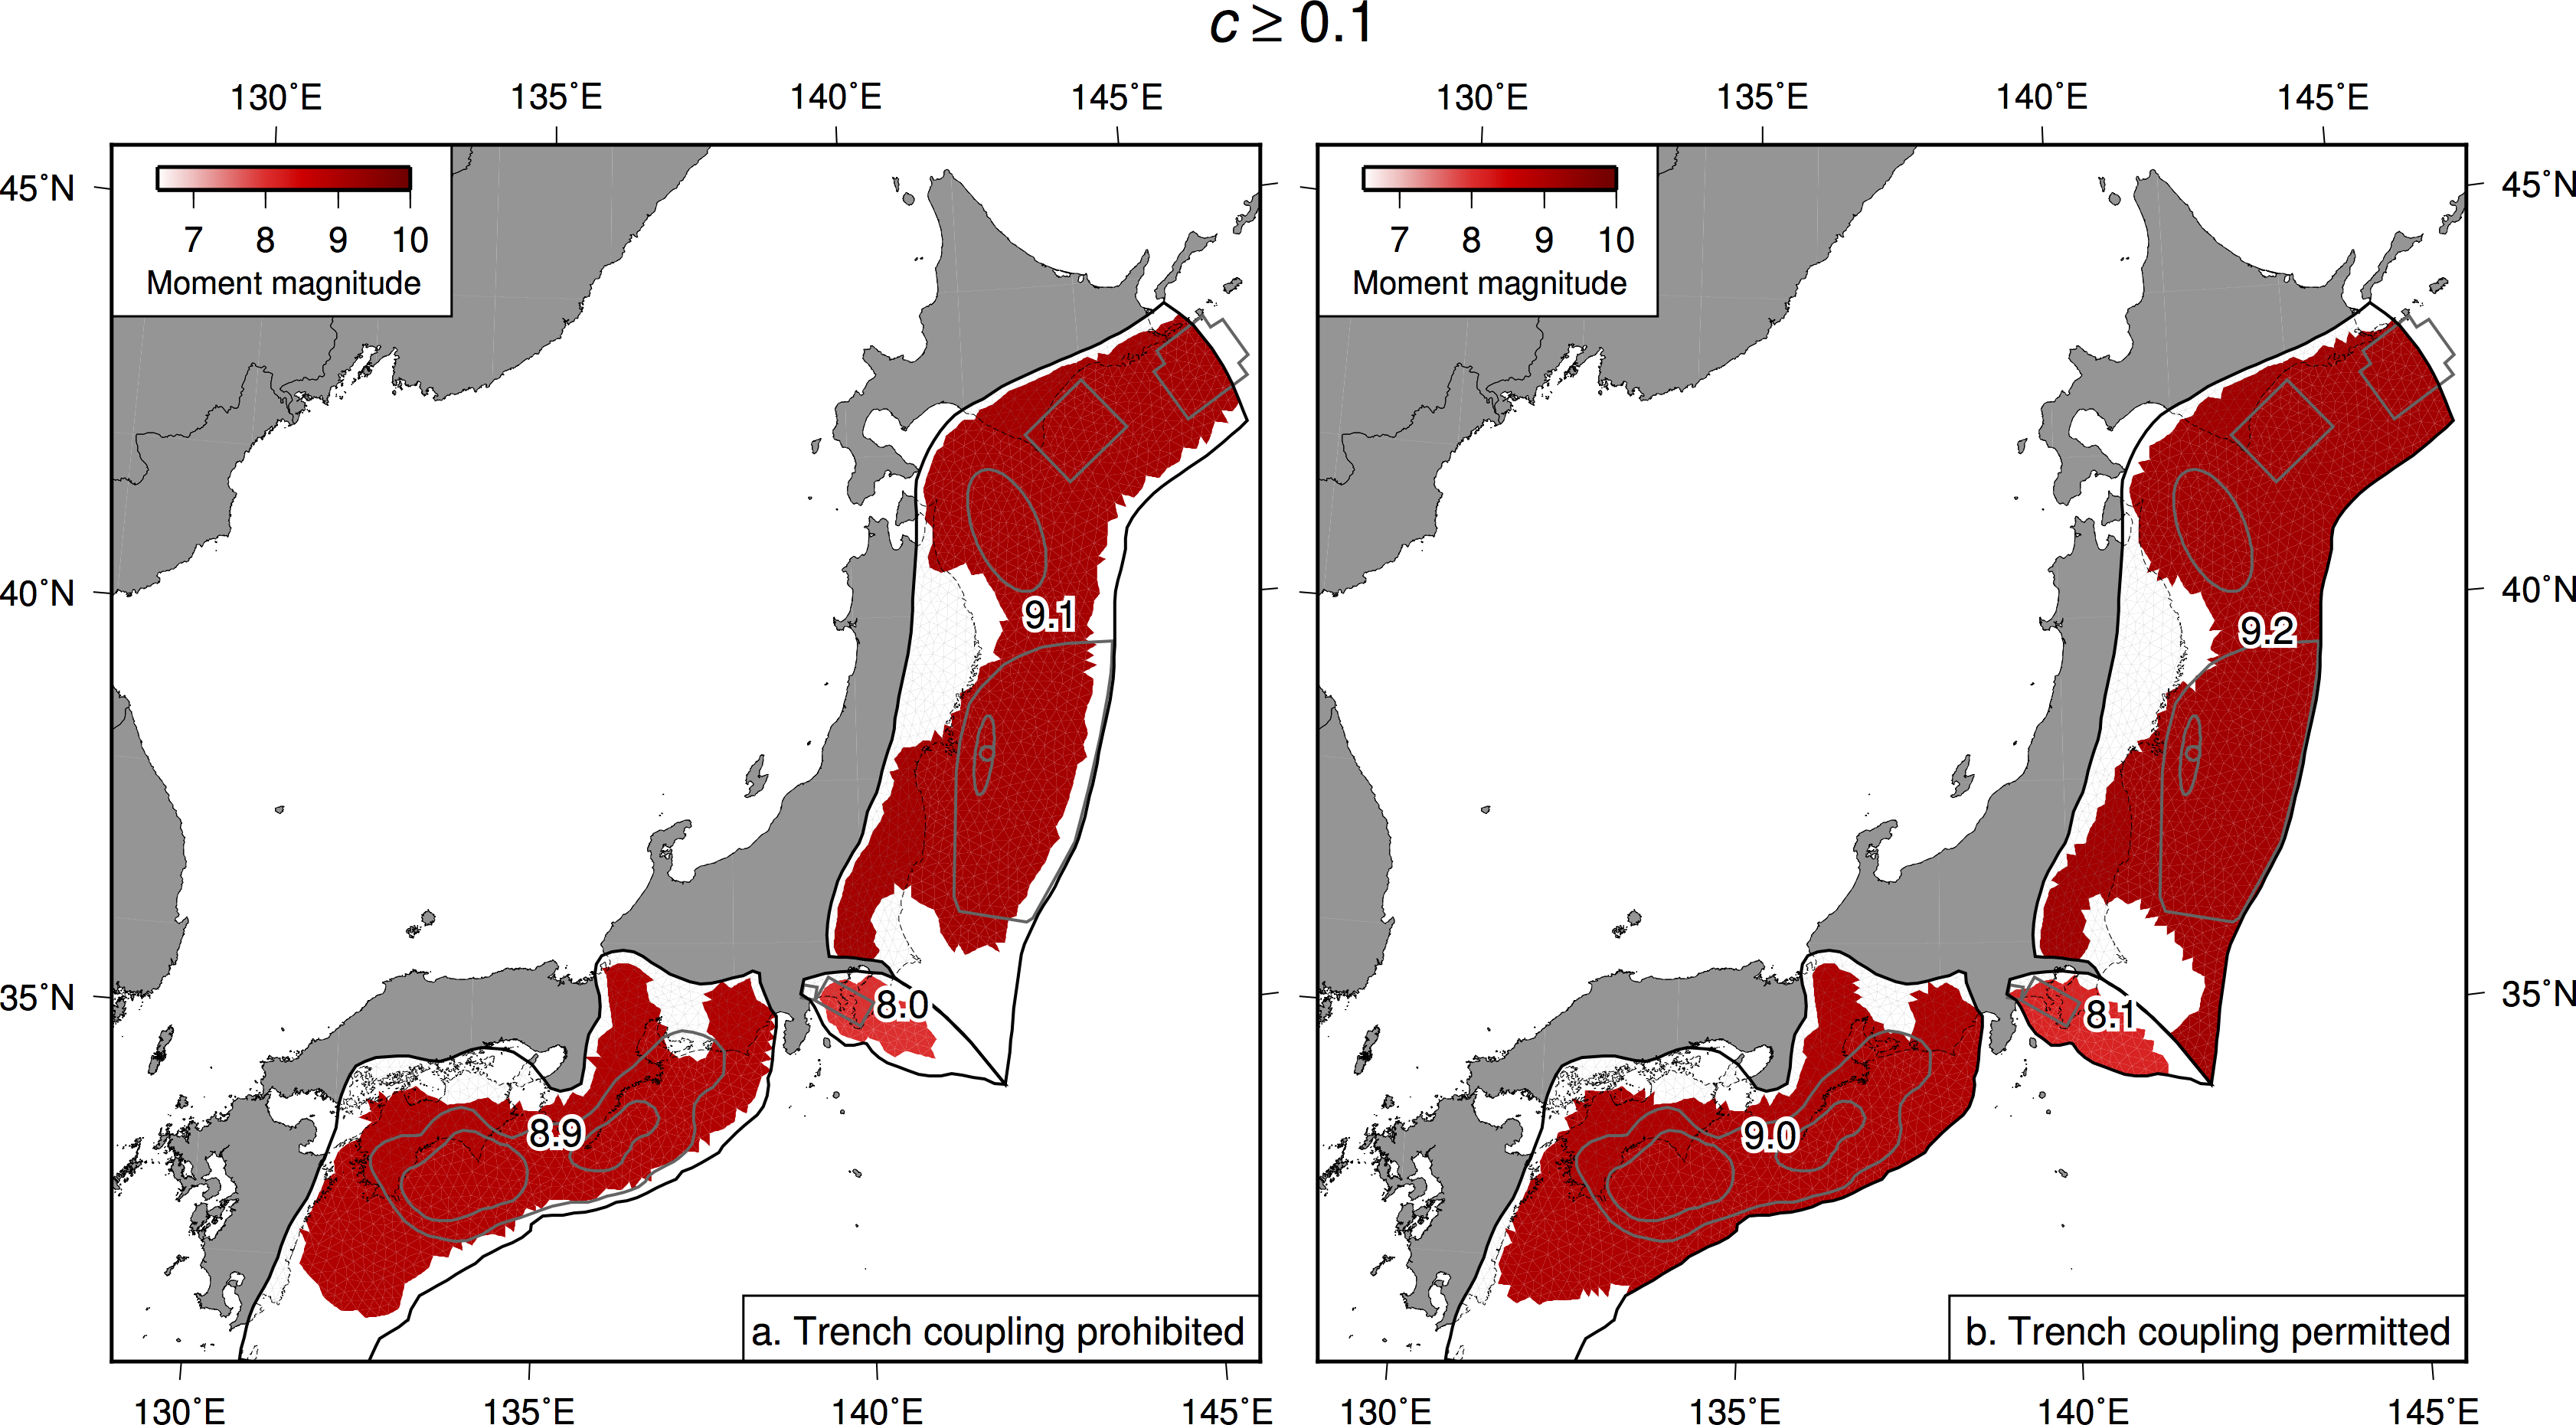
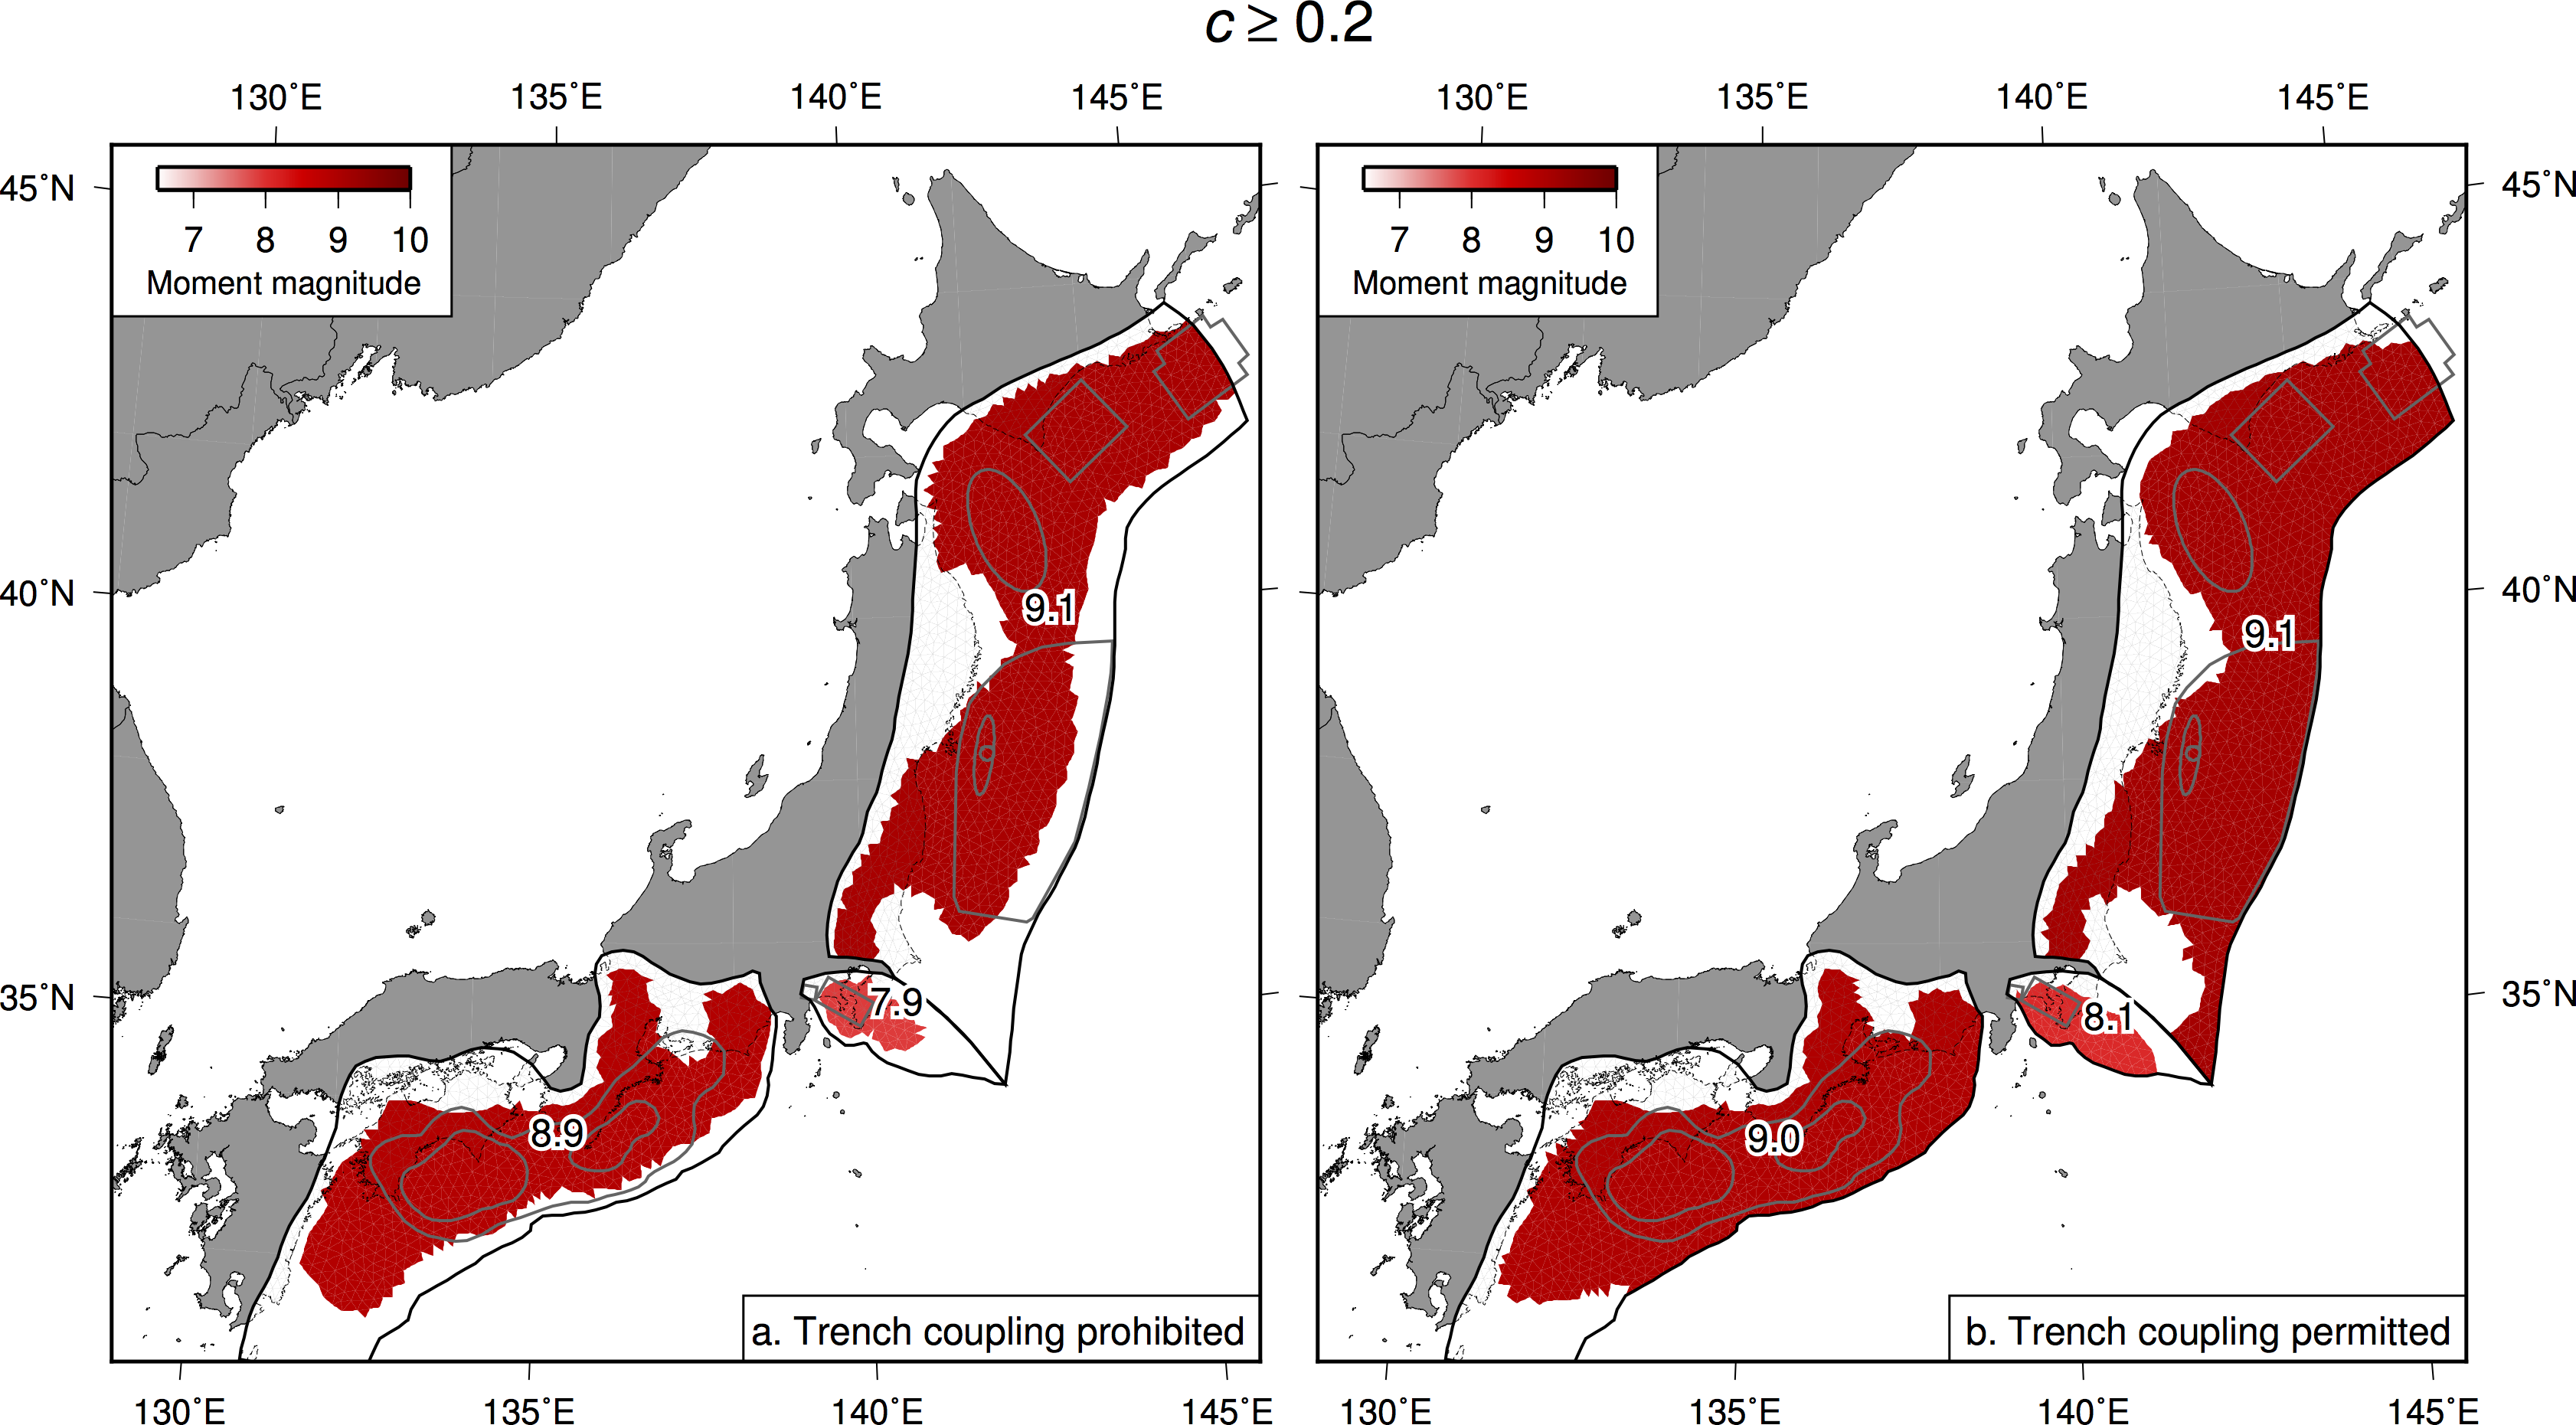
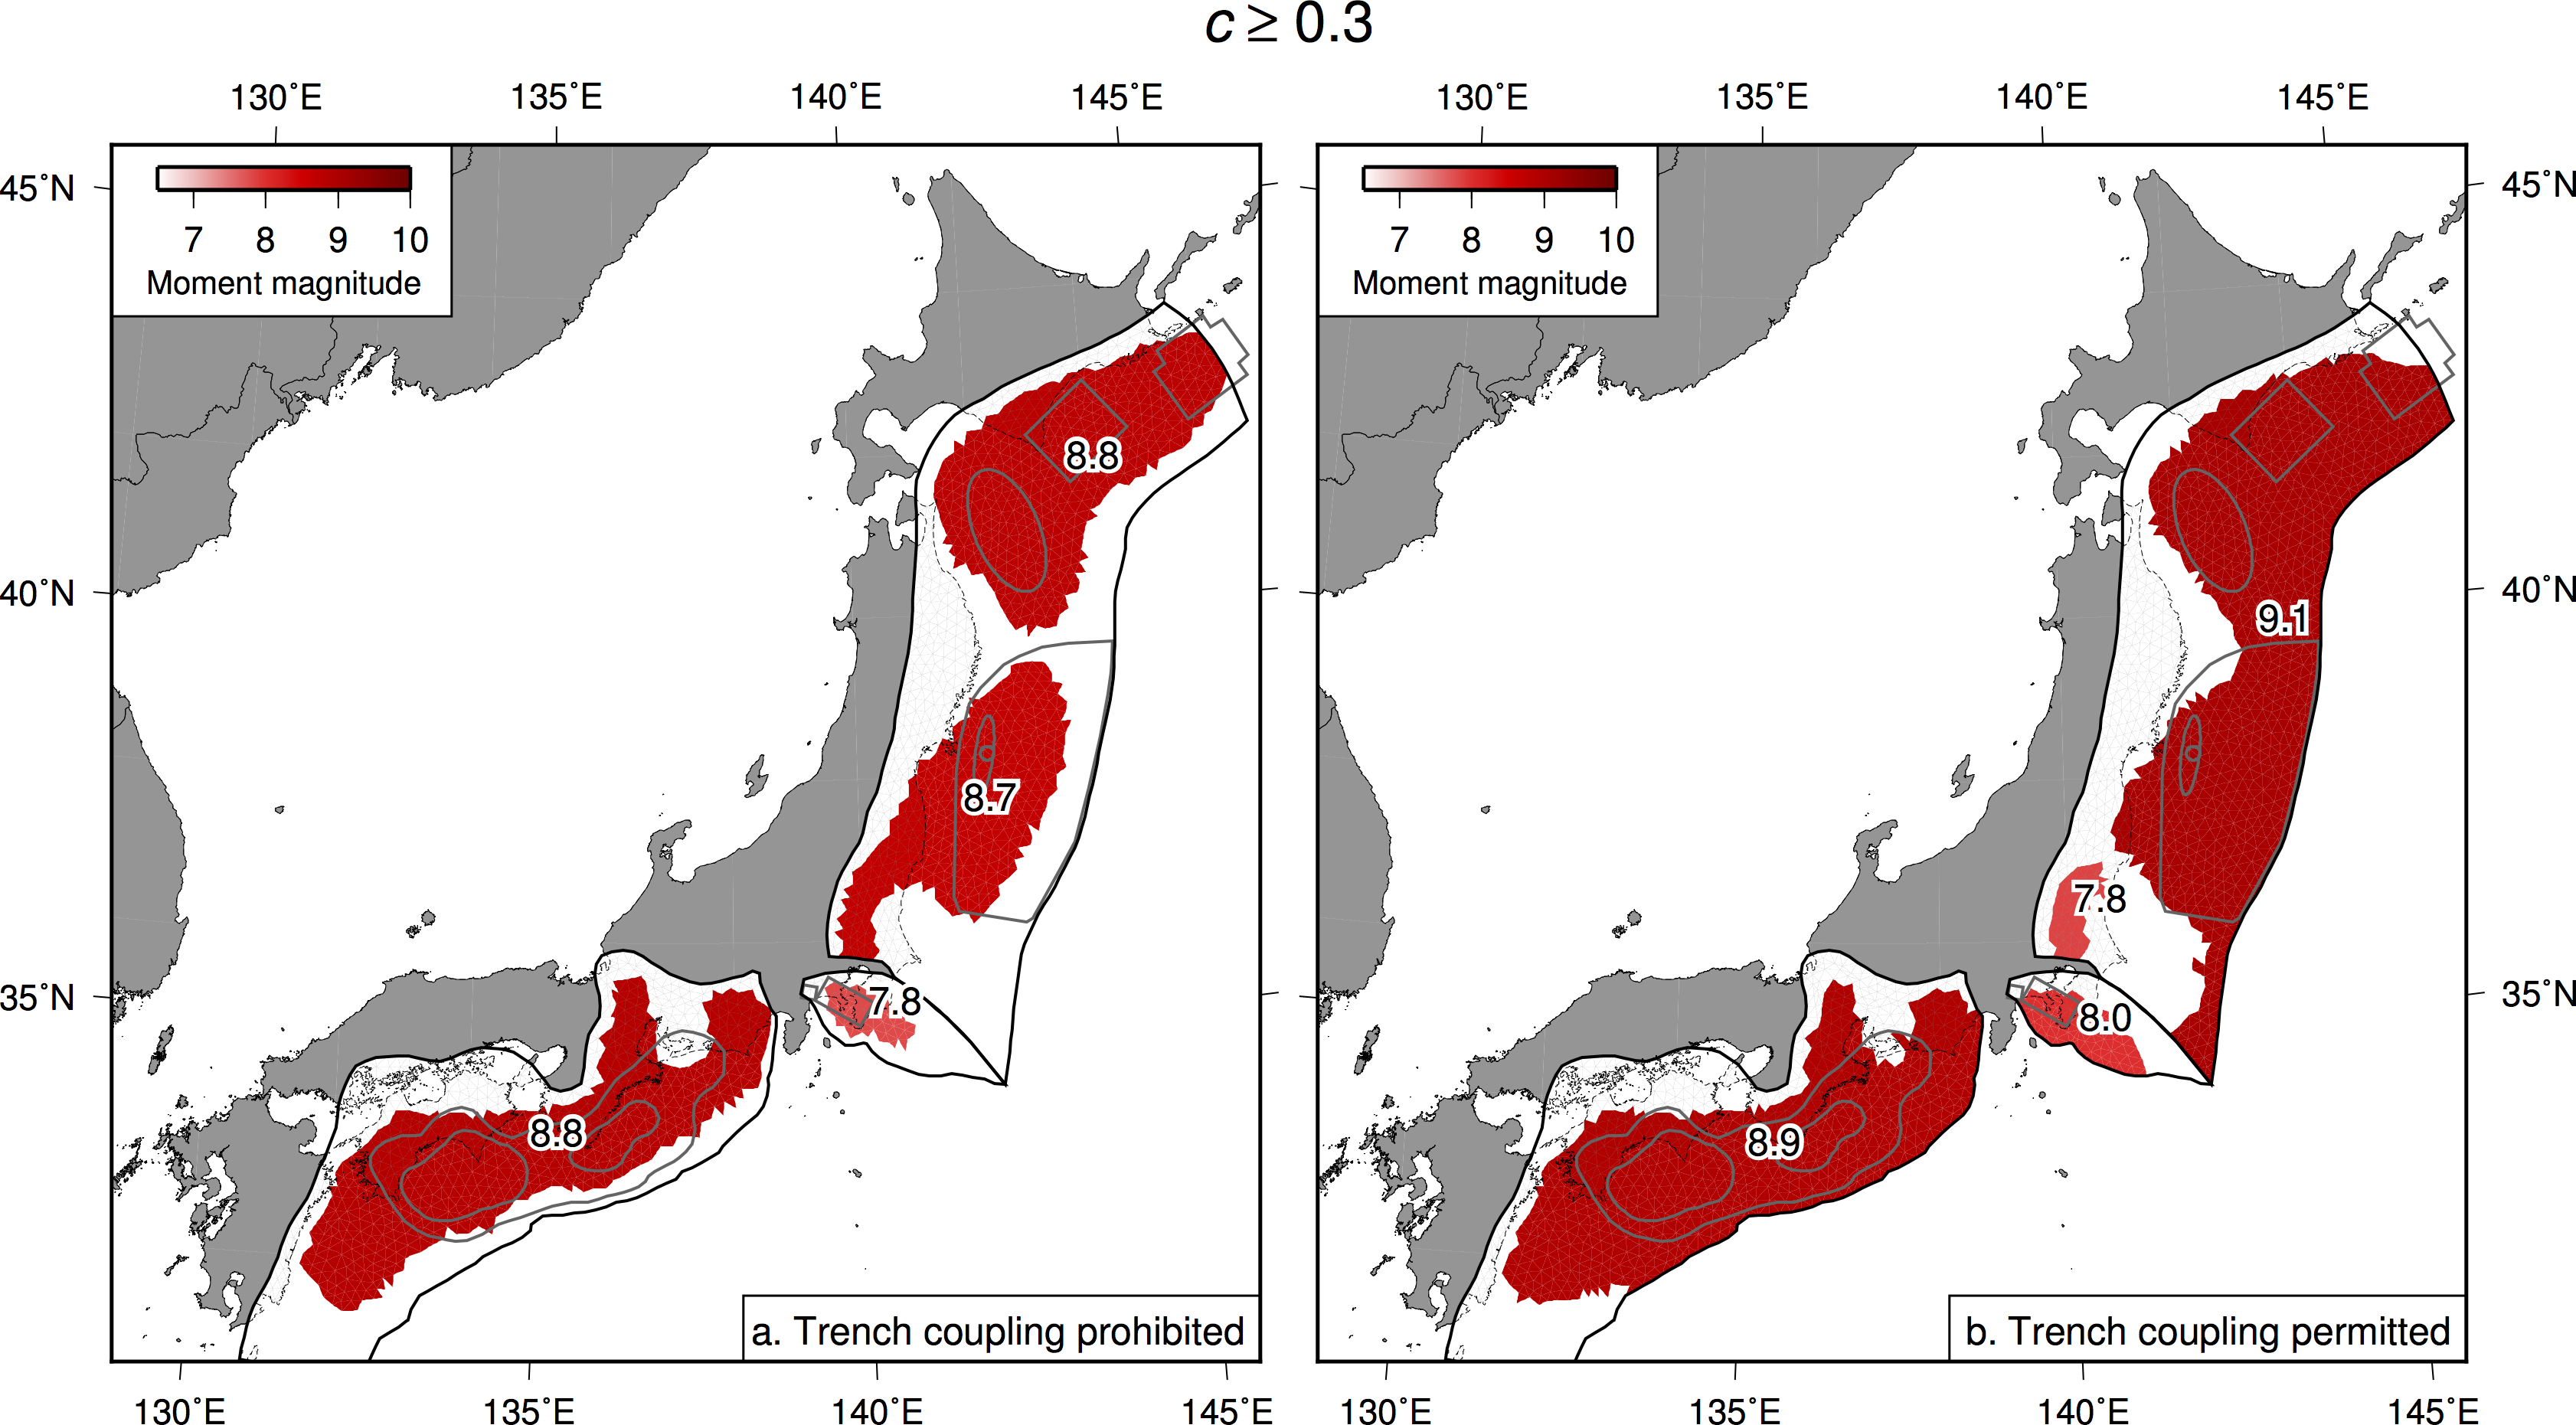
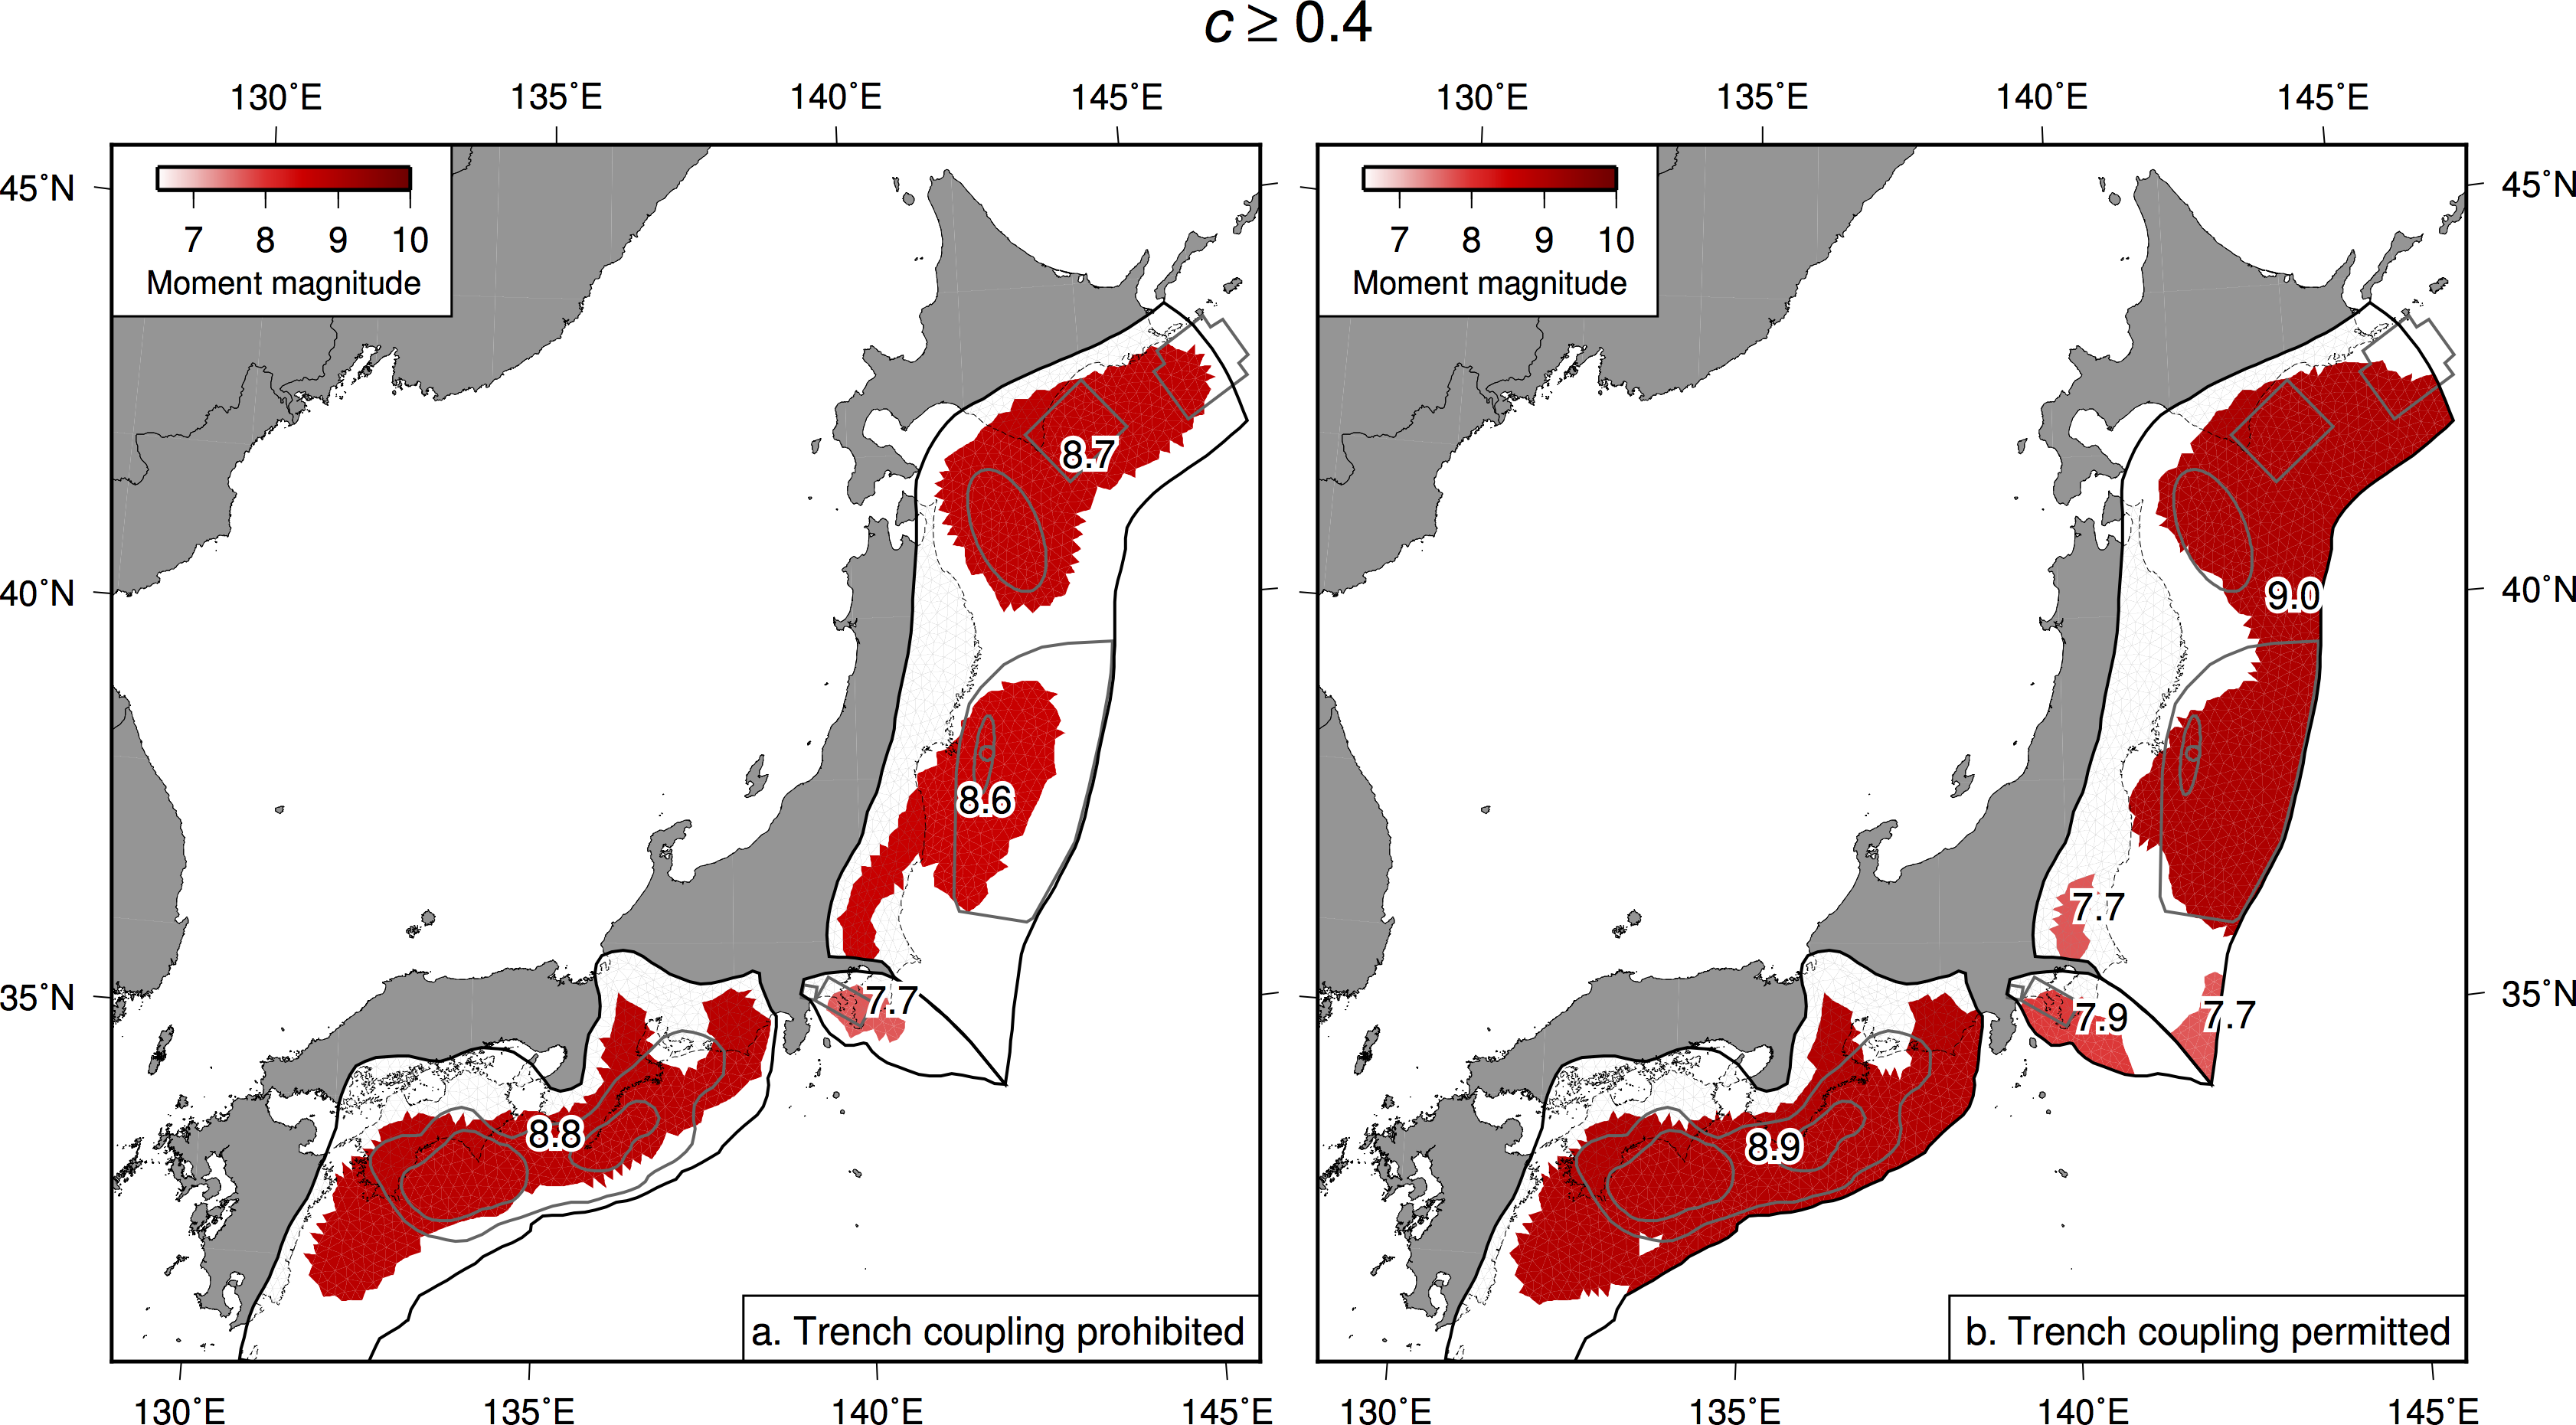
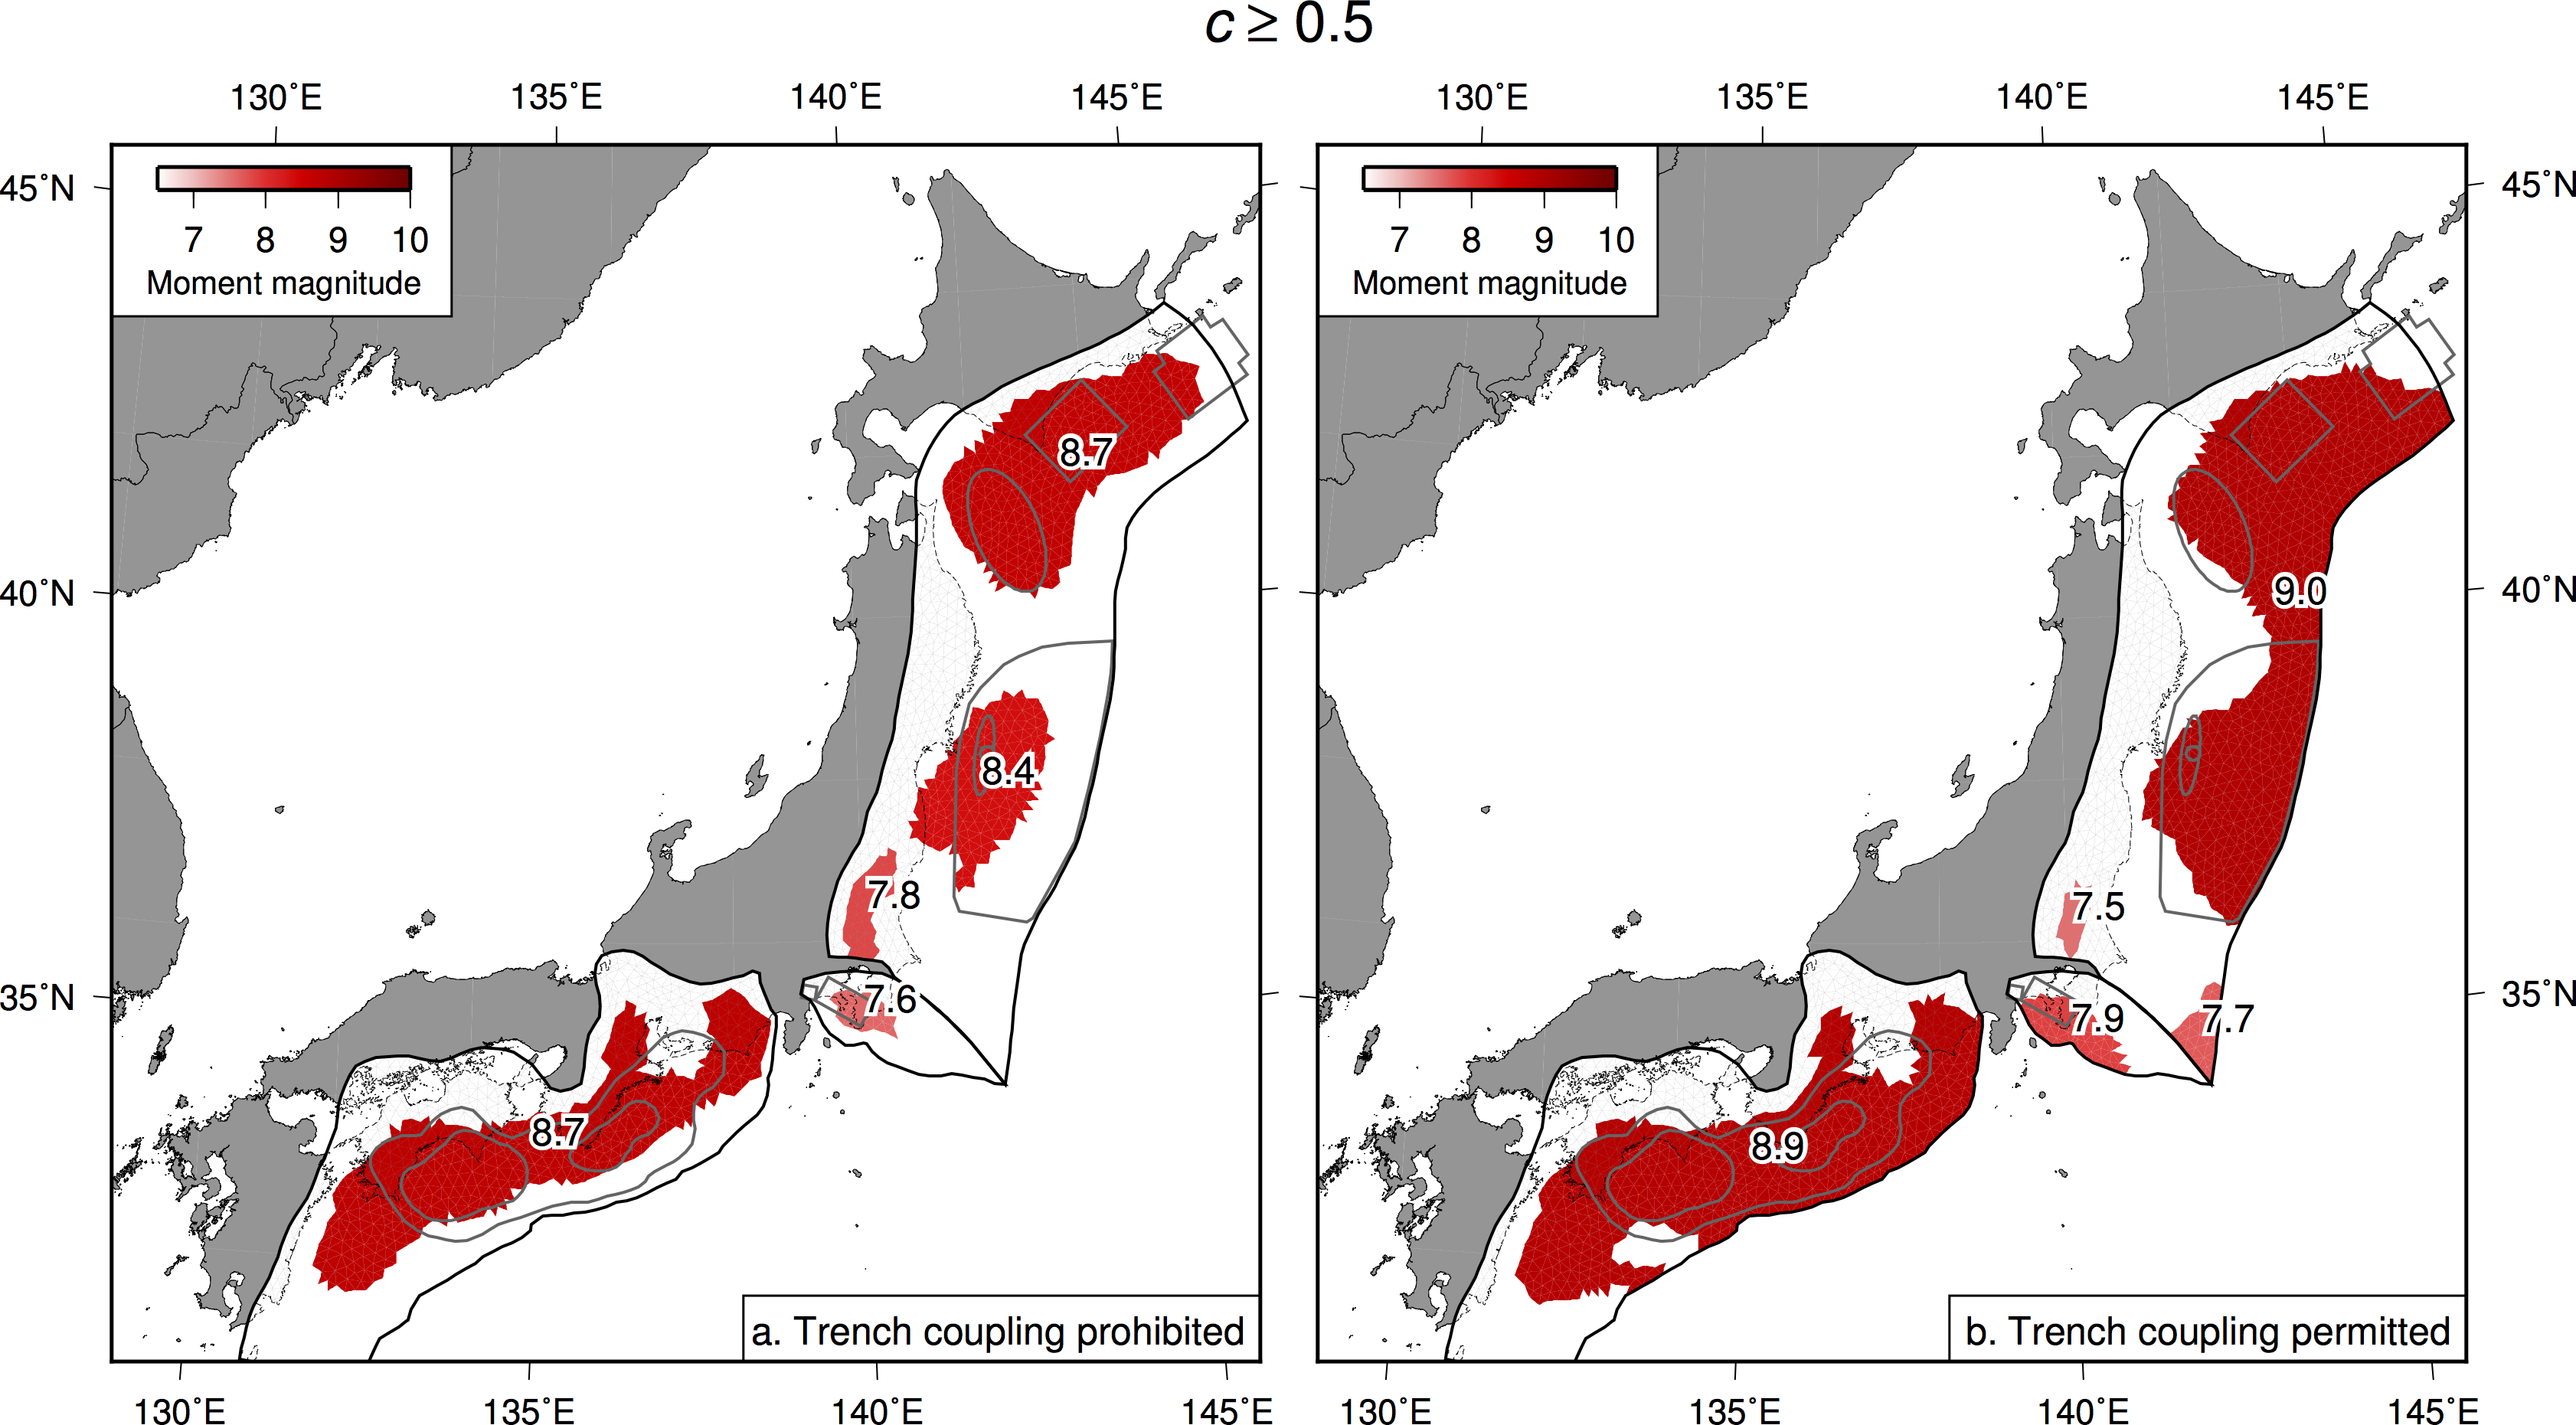
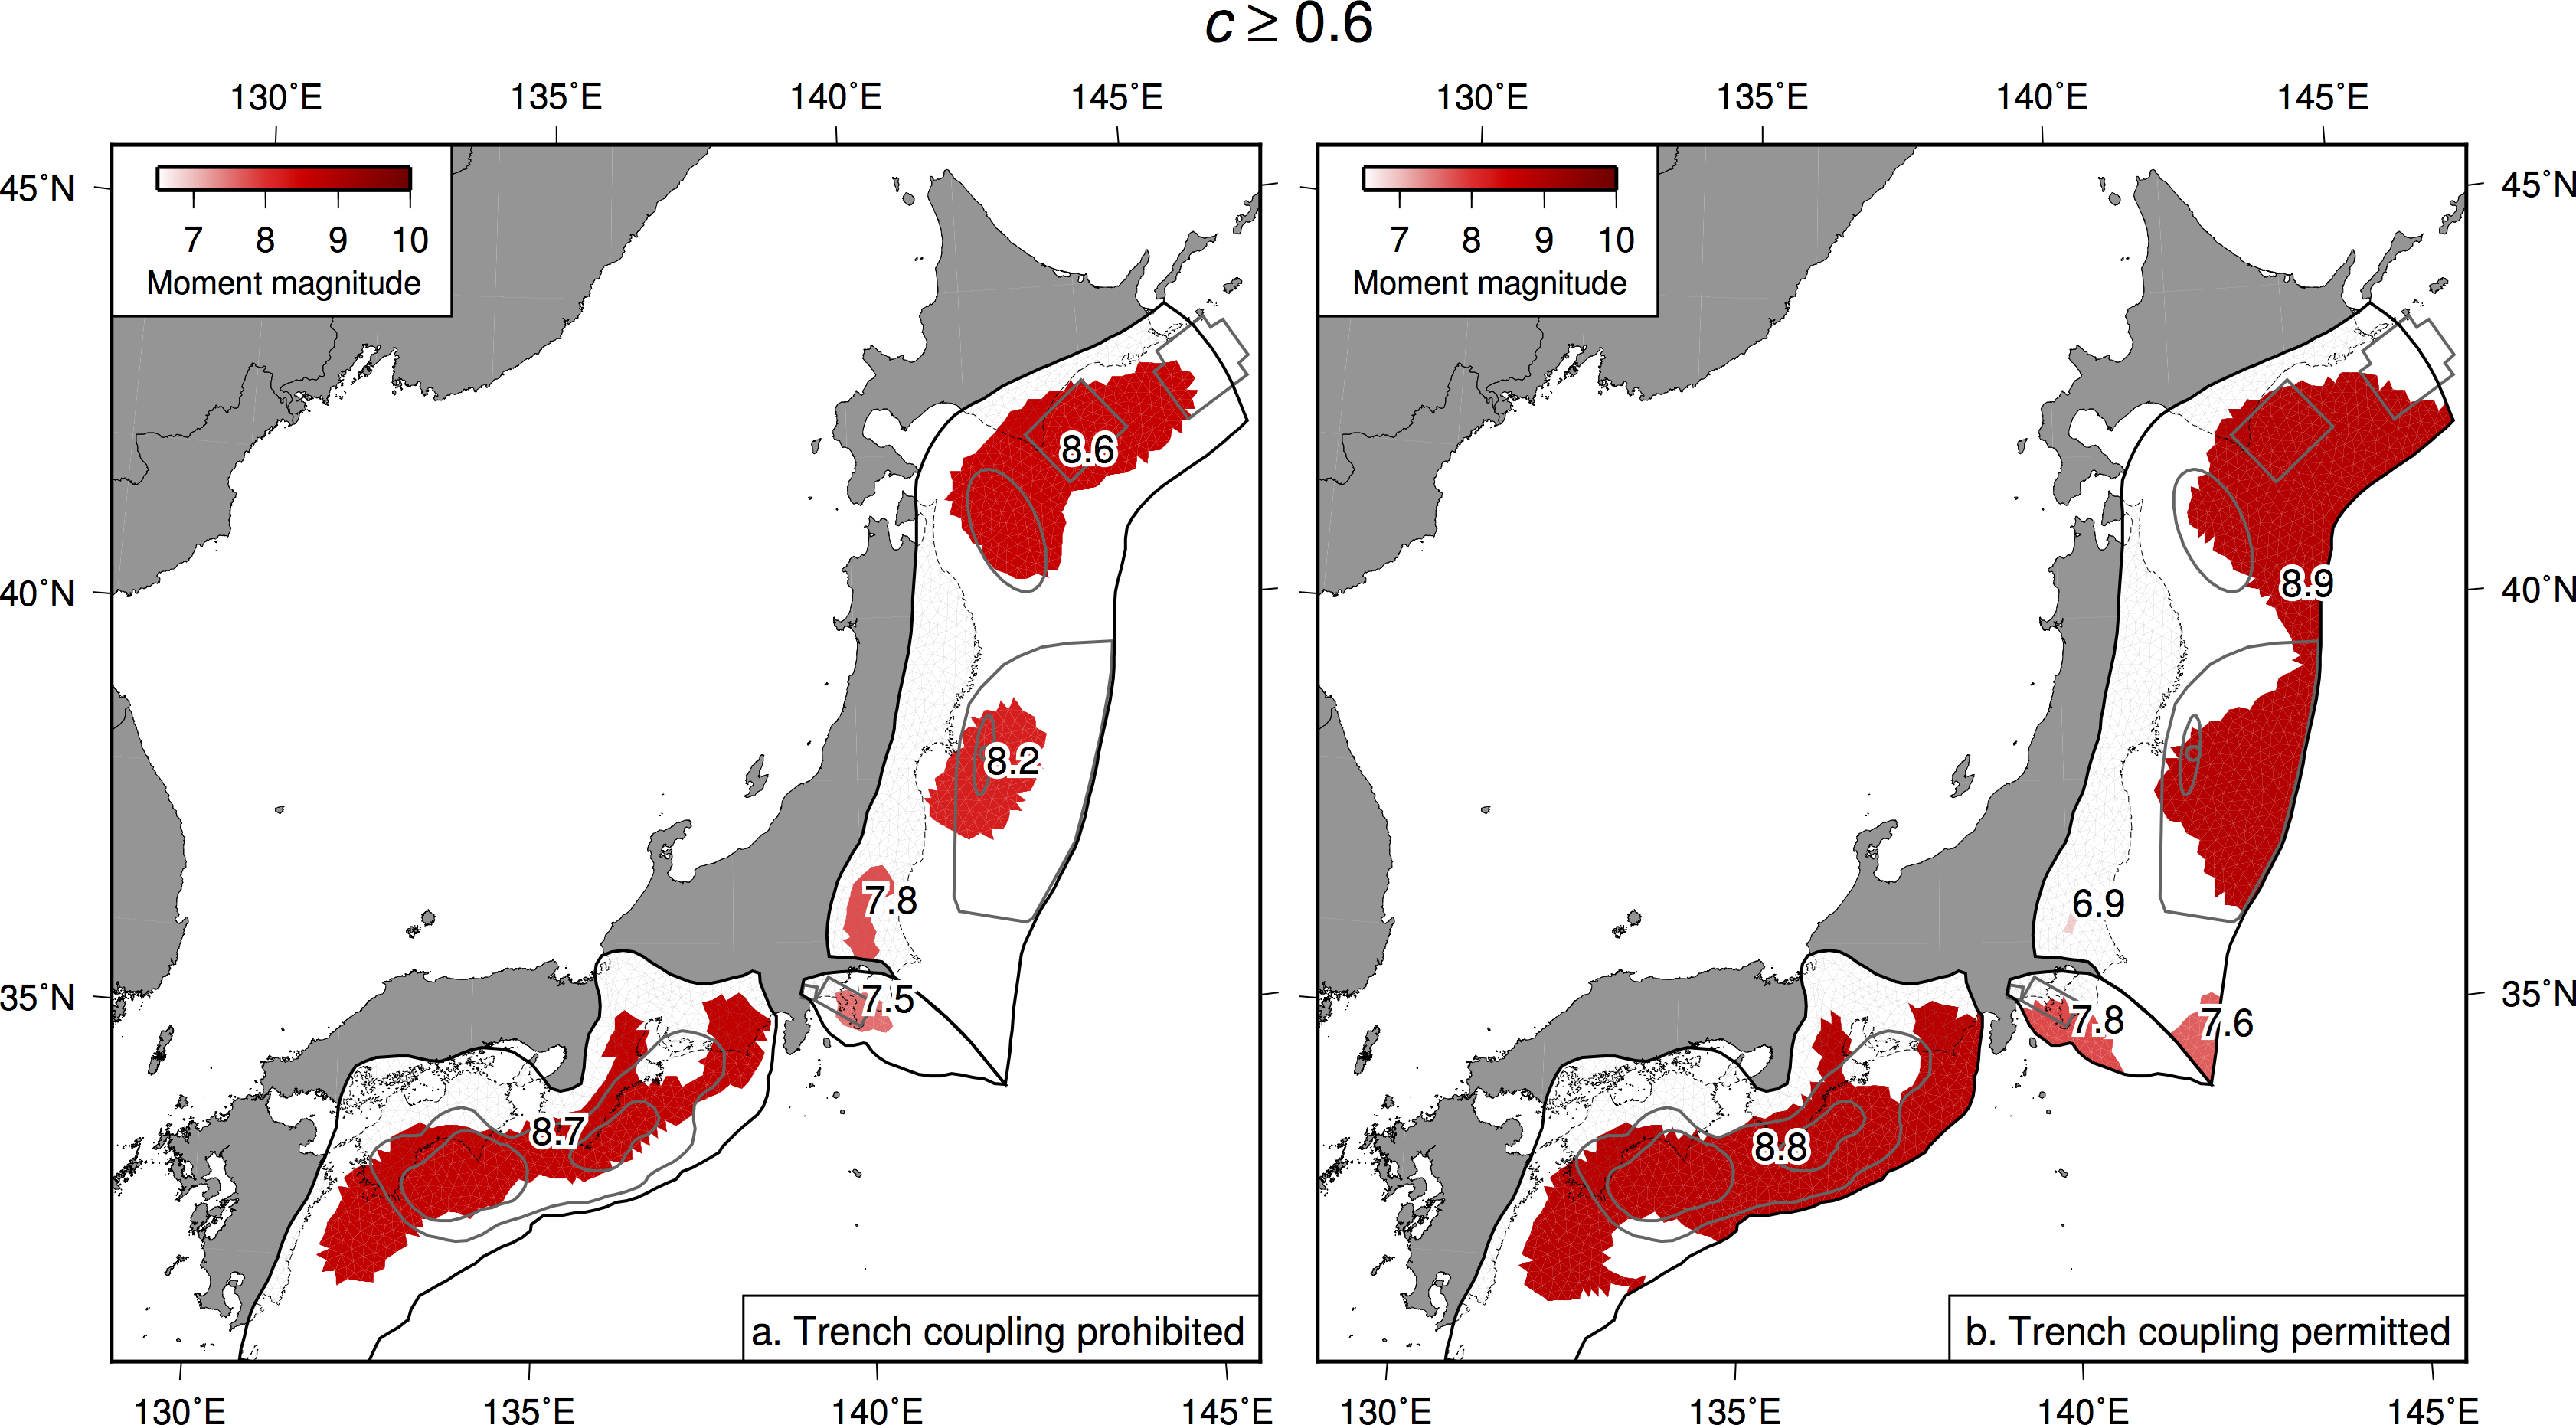
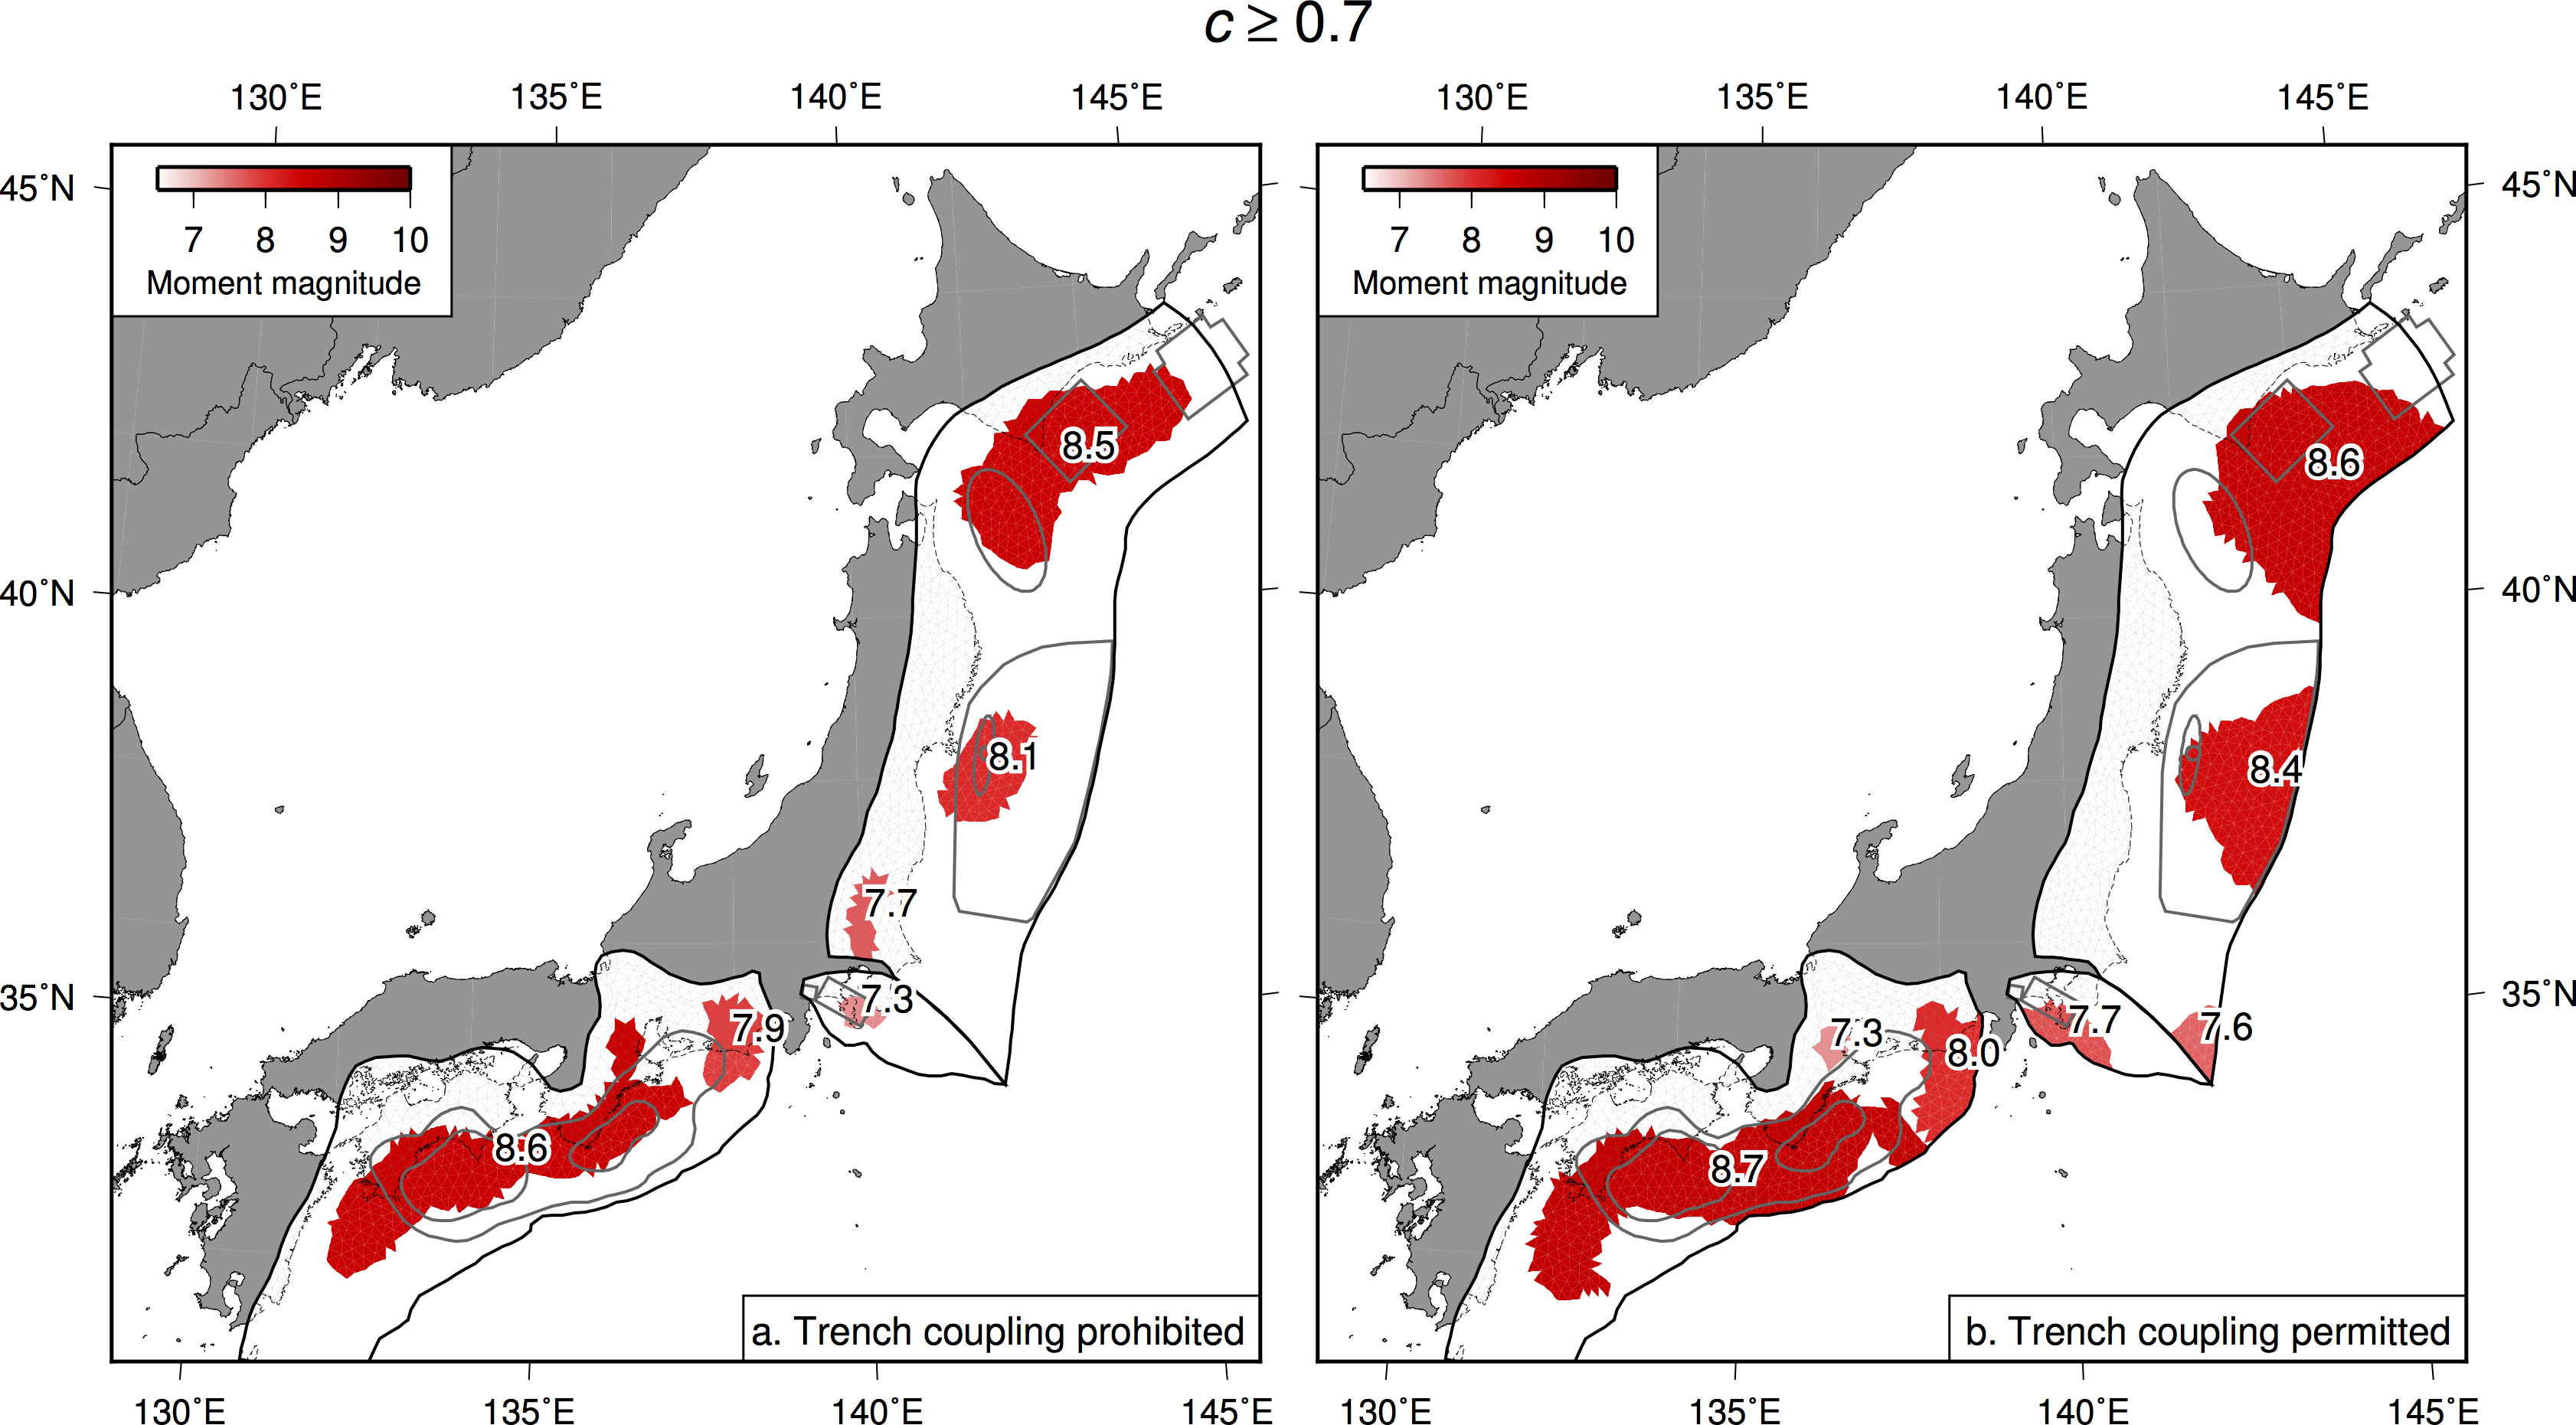
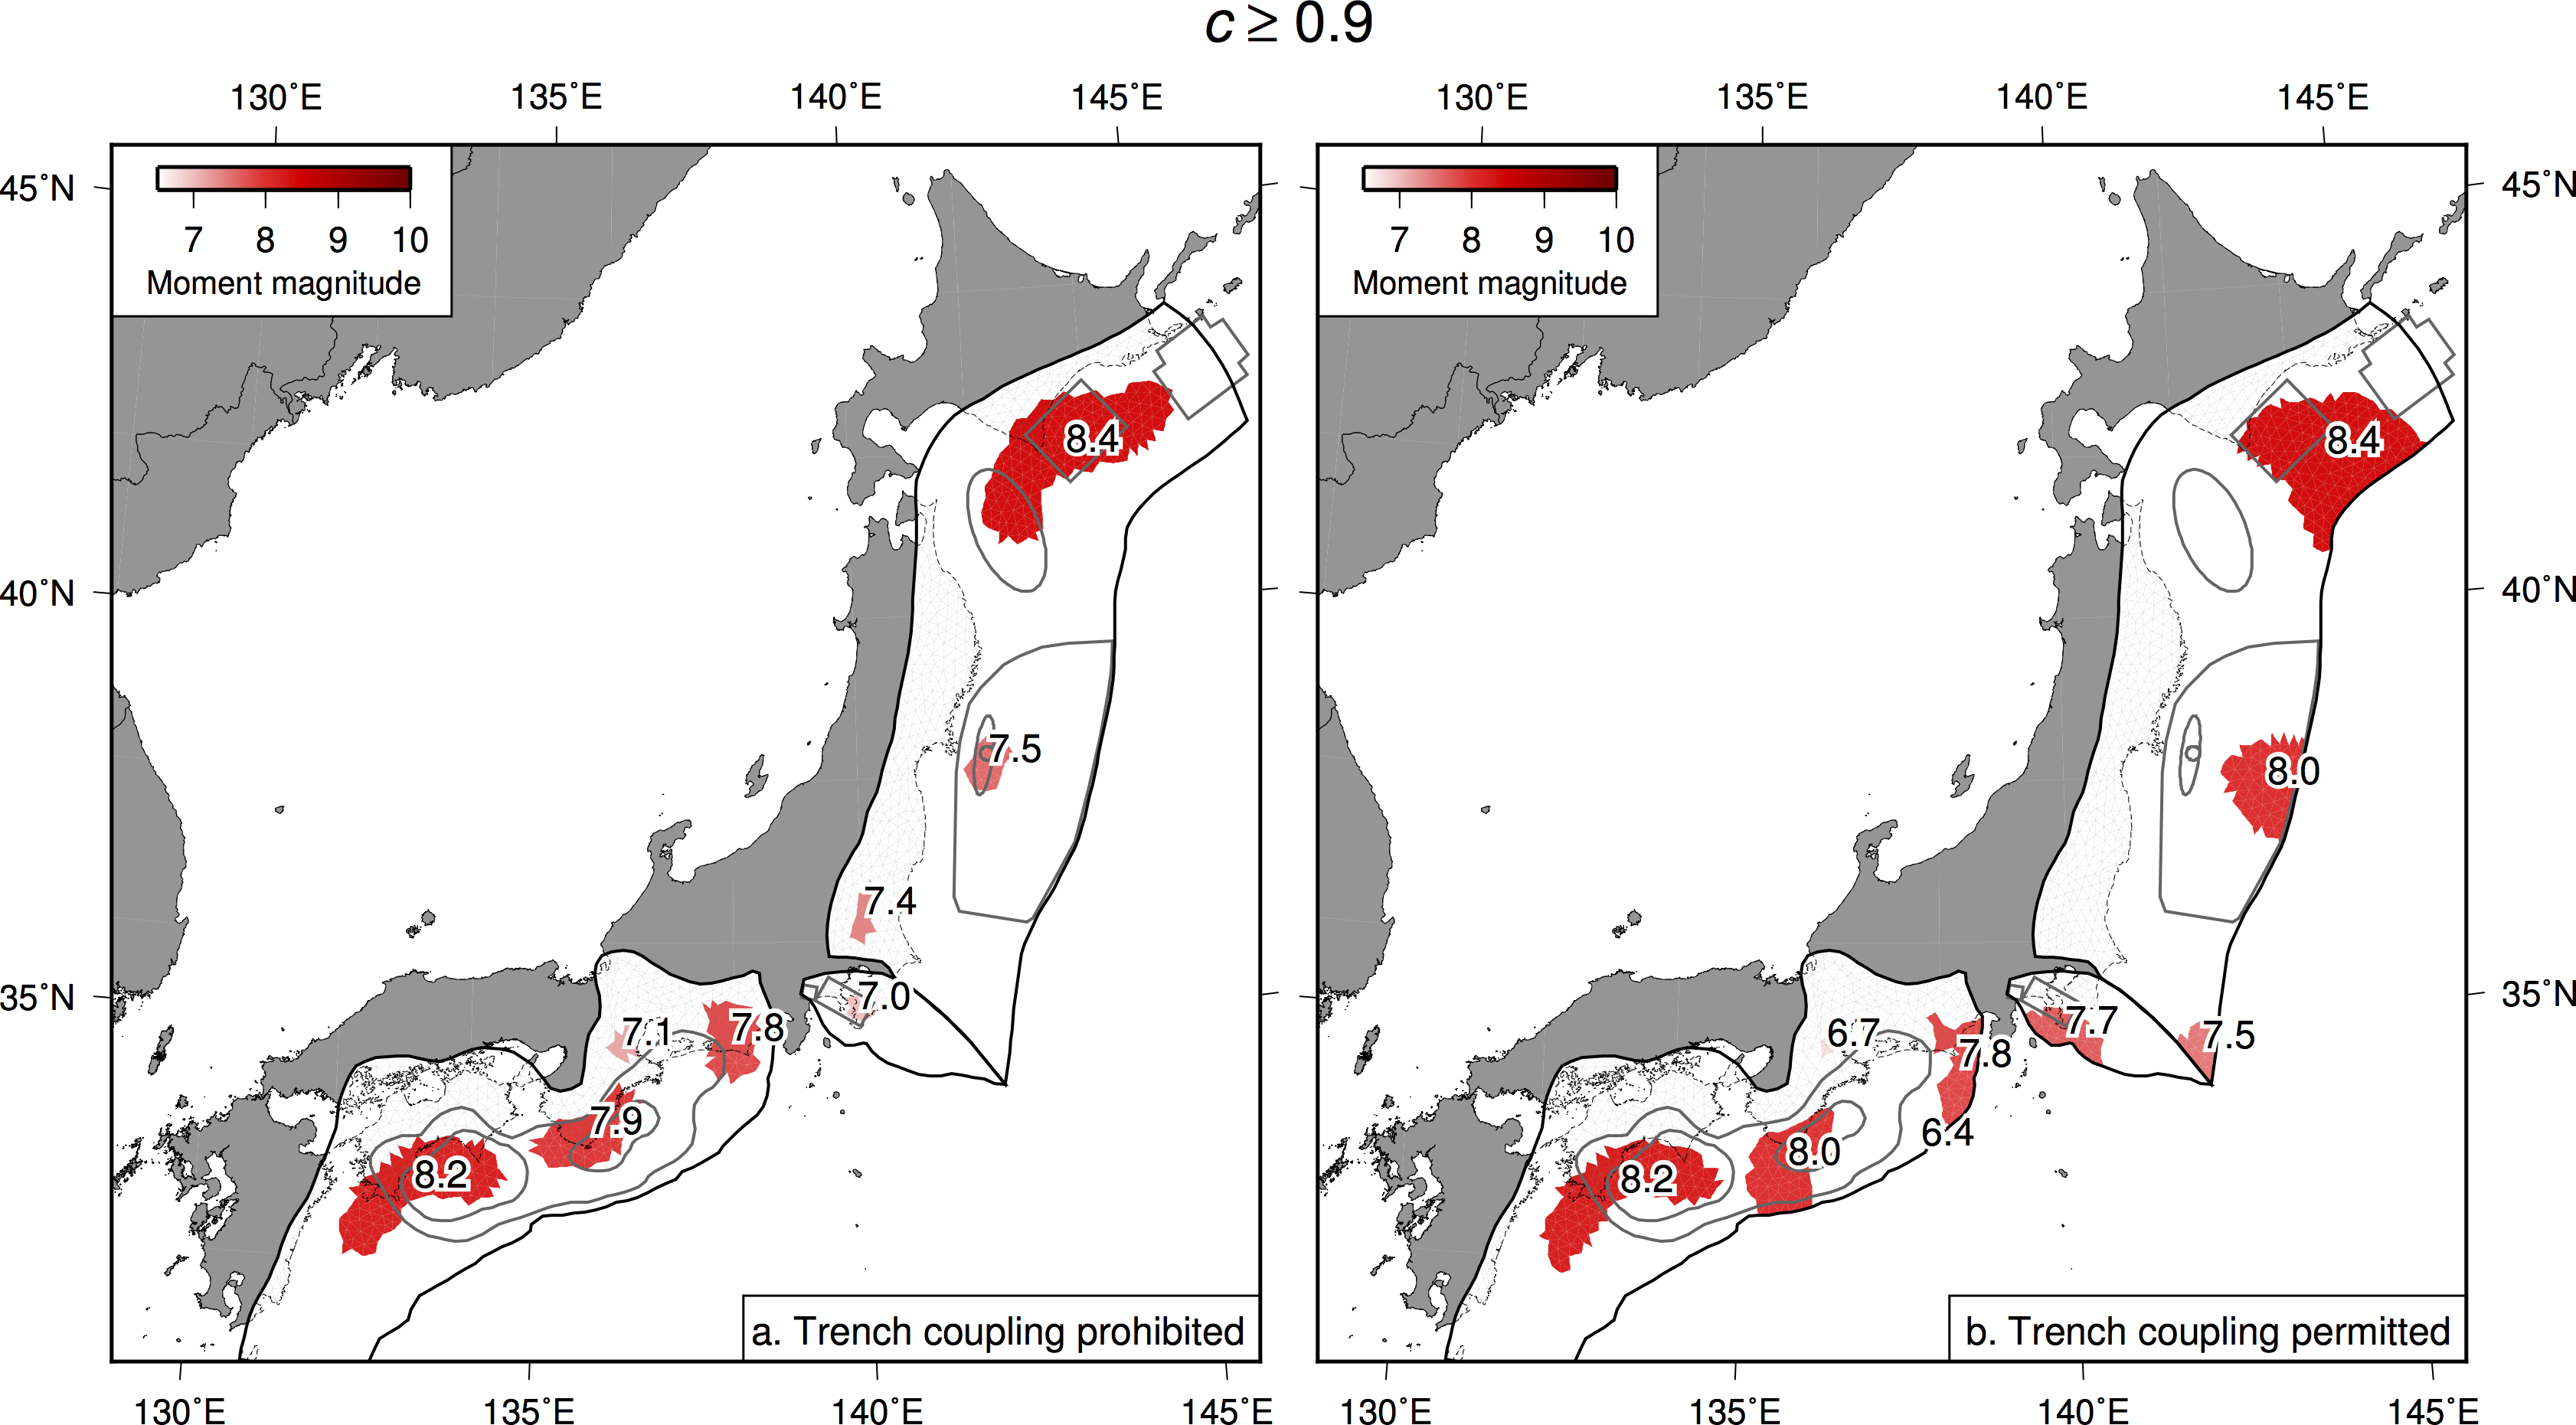
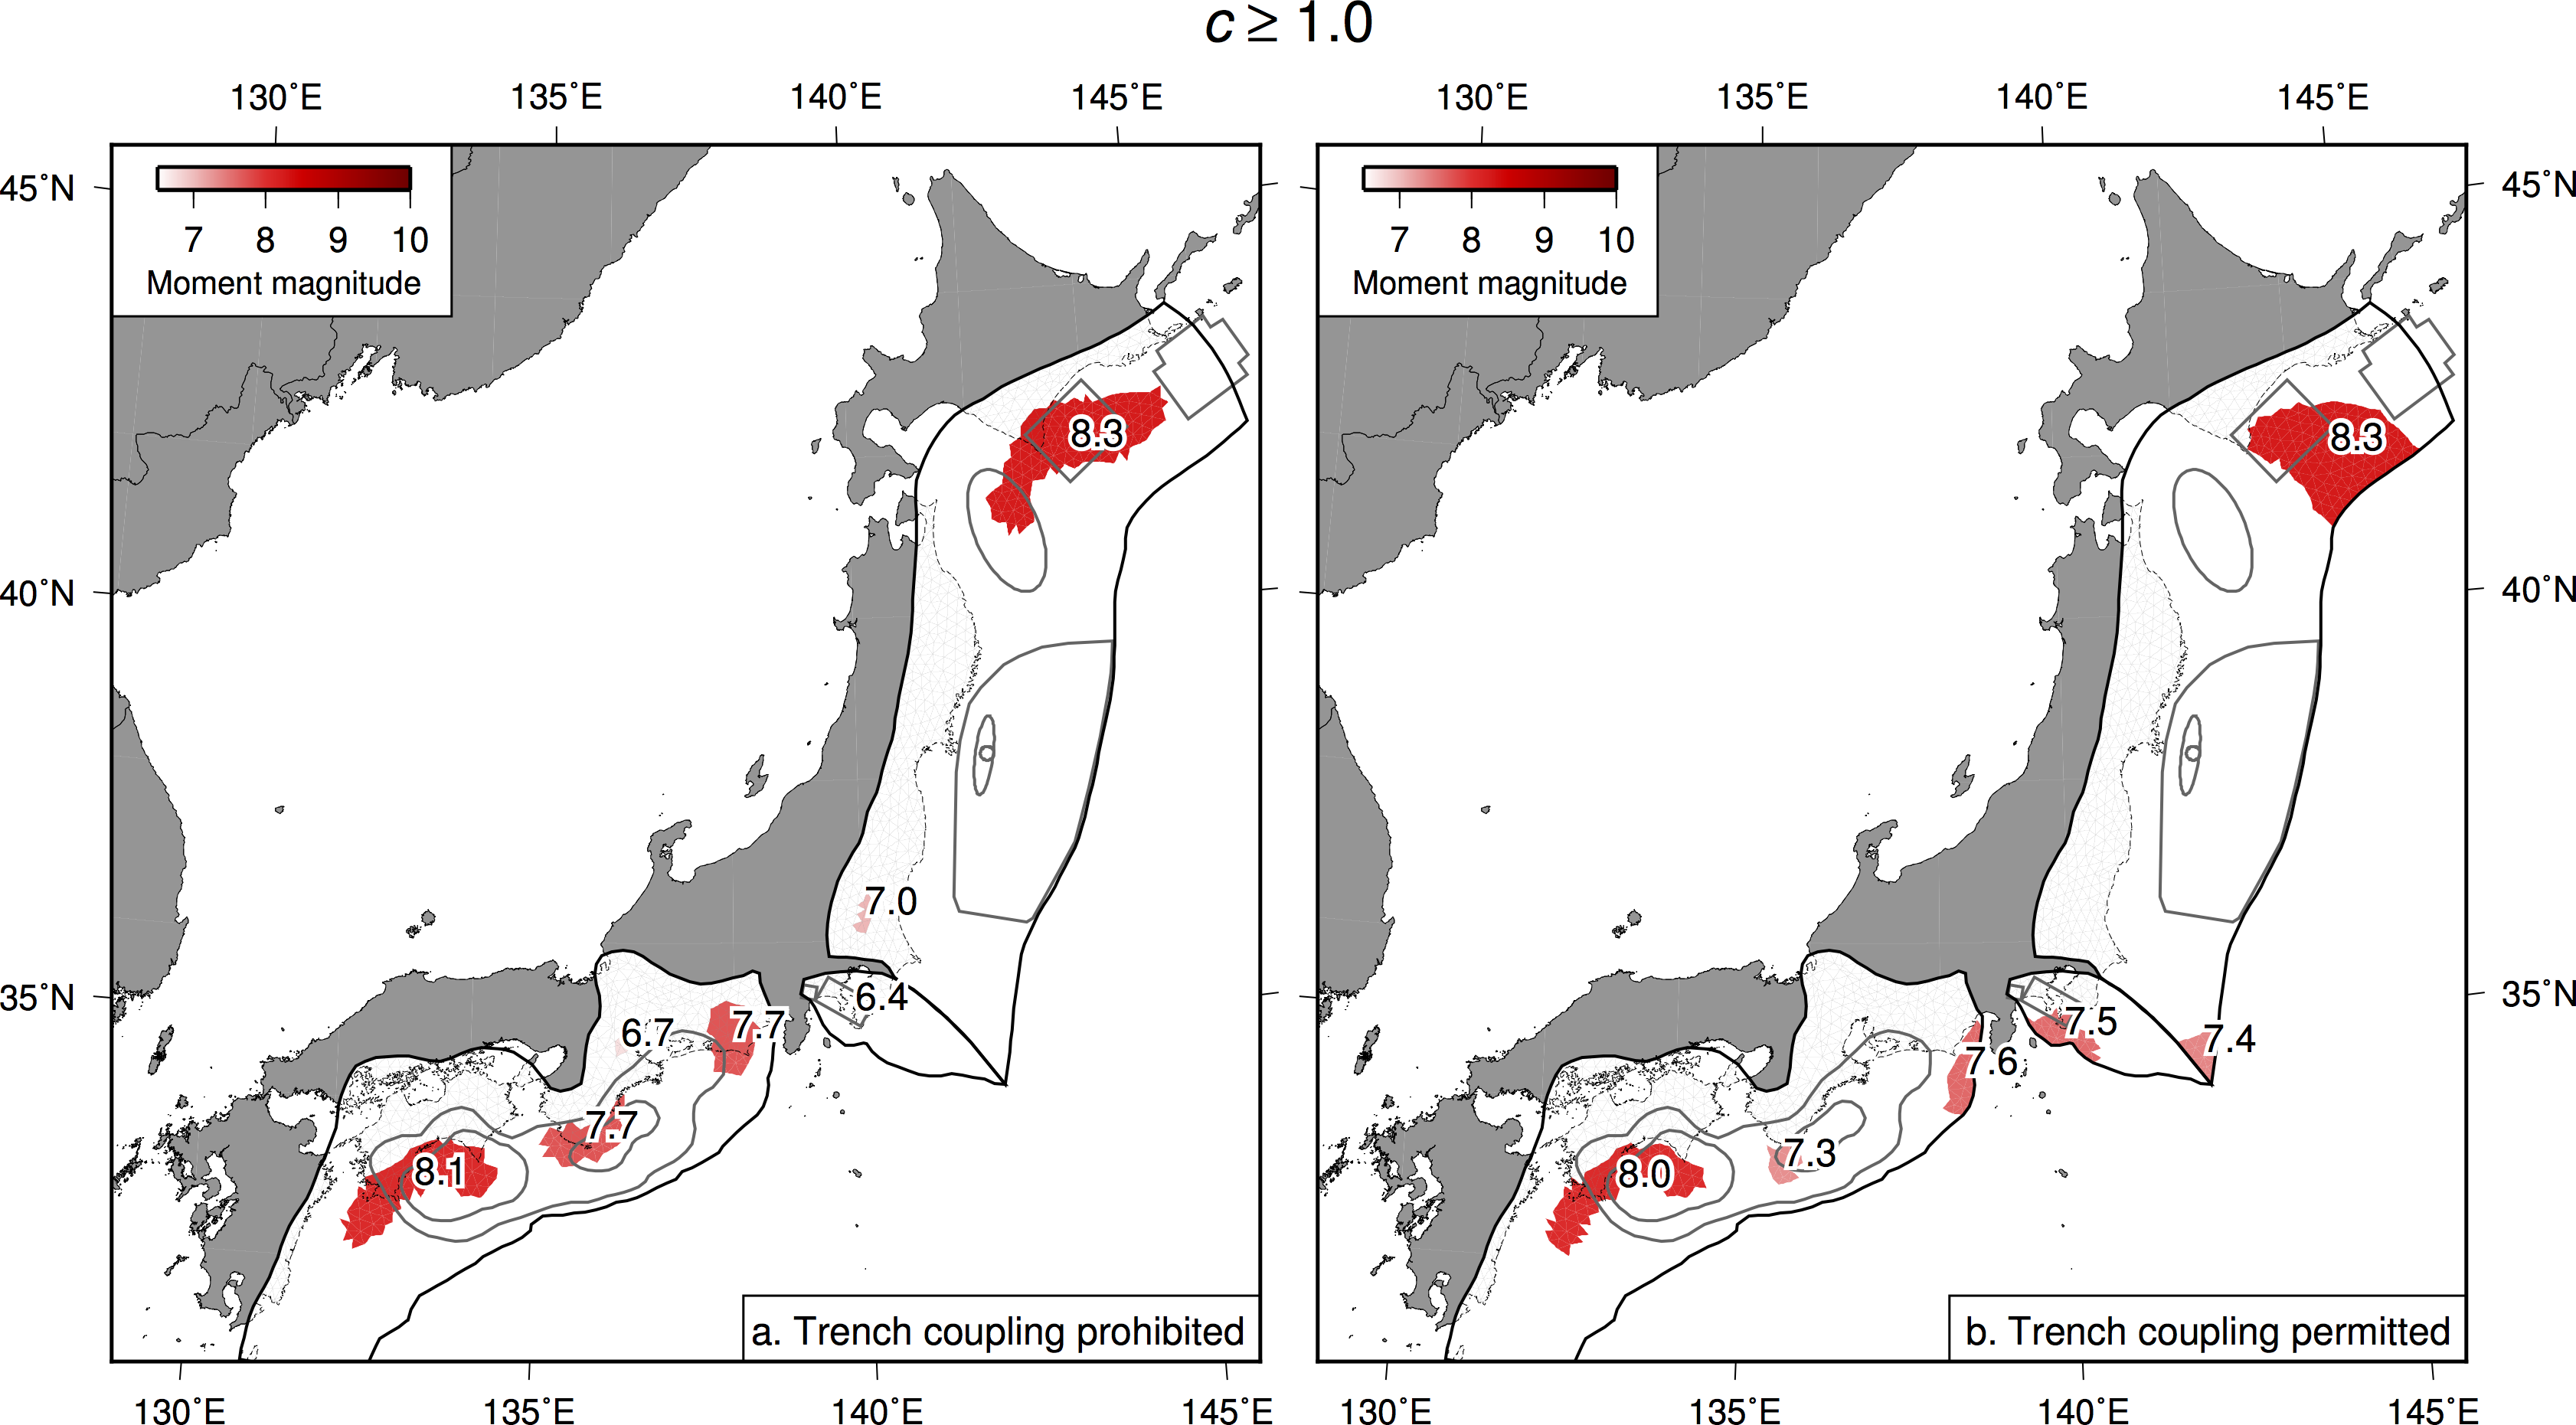
Figure S1. Potential areas and magnitudes of earthquakes rupturing partially coupled regions of the subduction zones. Represented are the areas estimated to be coupled at 10% of the plate convergence rate or greater (i.e., c ≥ 0.1) in the cases of (a) enforced trench creep and (b) permitted trench coupling, which correspond to panels (a) and (b) of Figure 2 of the main text. Rupture extents of historic to recent earthquakes are shown with gray lines, as defined in Figure 2.
Figure S2. Same as Figure S1, but showing c ≥ 0.2 areas.
Figure S3. Same as Figure S1, but showing c ≥ 0.3 areas.
Figure S4. Same as Figure S1, but showing c ≥ 0.4 areas.
Figure S5. Same as Figure S1, but showing c ≥ 0.5 areas.
Figure S6. Same as Figure S1, but showing c ≥ 0.6 areas.
Figure S7. Same as Figure S1, but showing c ≥ 0.7 areas.
Figure S8. Same as Figure S1, but showing c ≥ 0.8 areas.
Figure S9. Same as Figure S1, but showing c ≥ 0.9 areas.
Figure S10. Same as Figure S1, but showing c ≥ 1.0 areas.
[ Back ]