This electronic supplement contains figures of Interferometric Synthetic Aperture Radar (InSAR) data, model parameter tradeoffs, and observed and modeled displacements and tables of moment tensor elements, SAR image pairs, and coseismic displacement gradients.
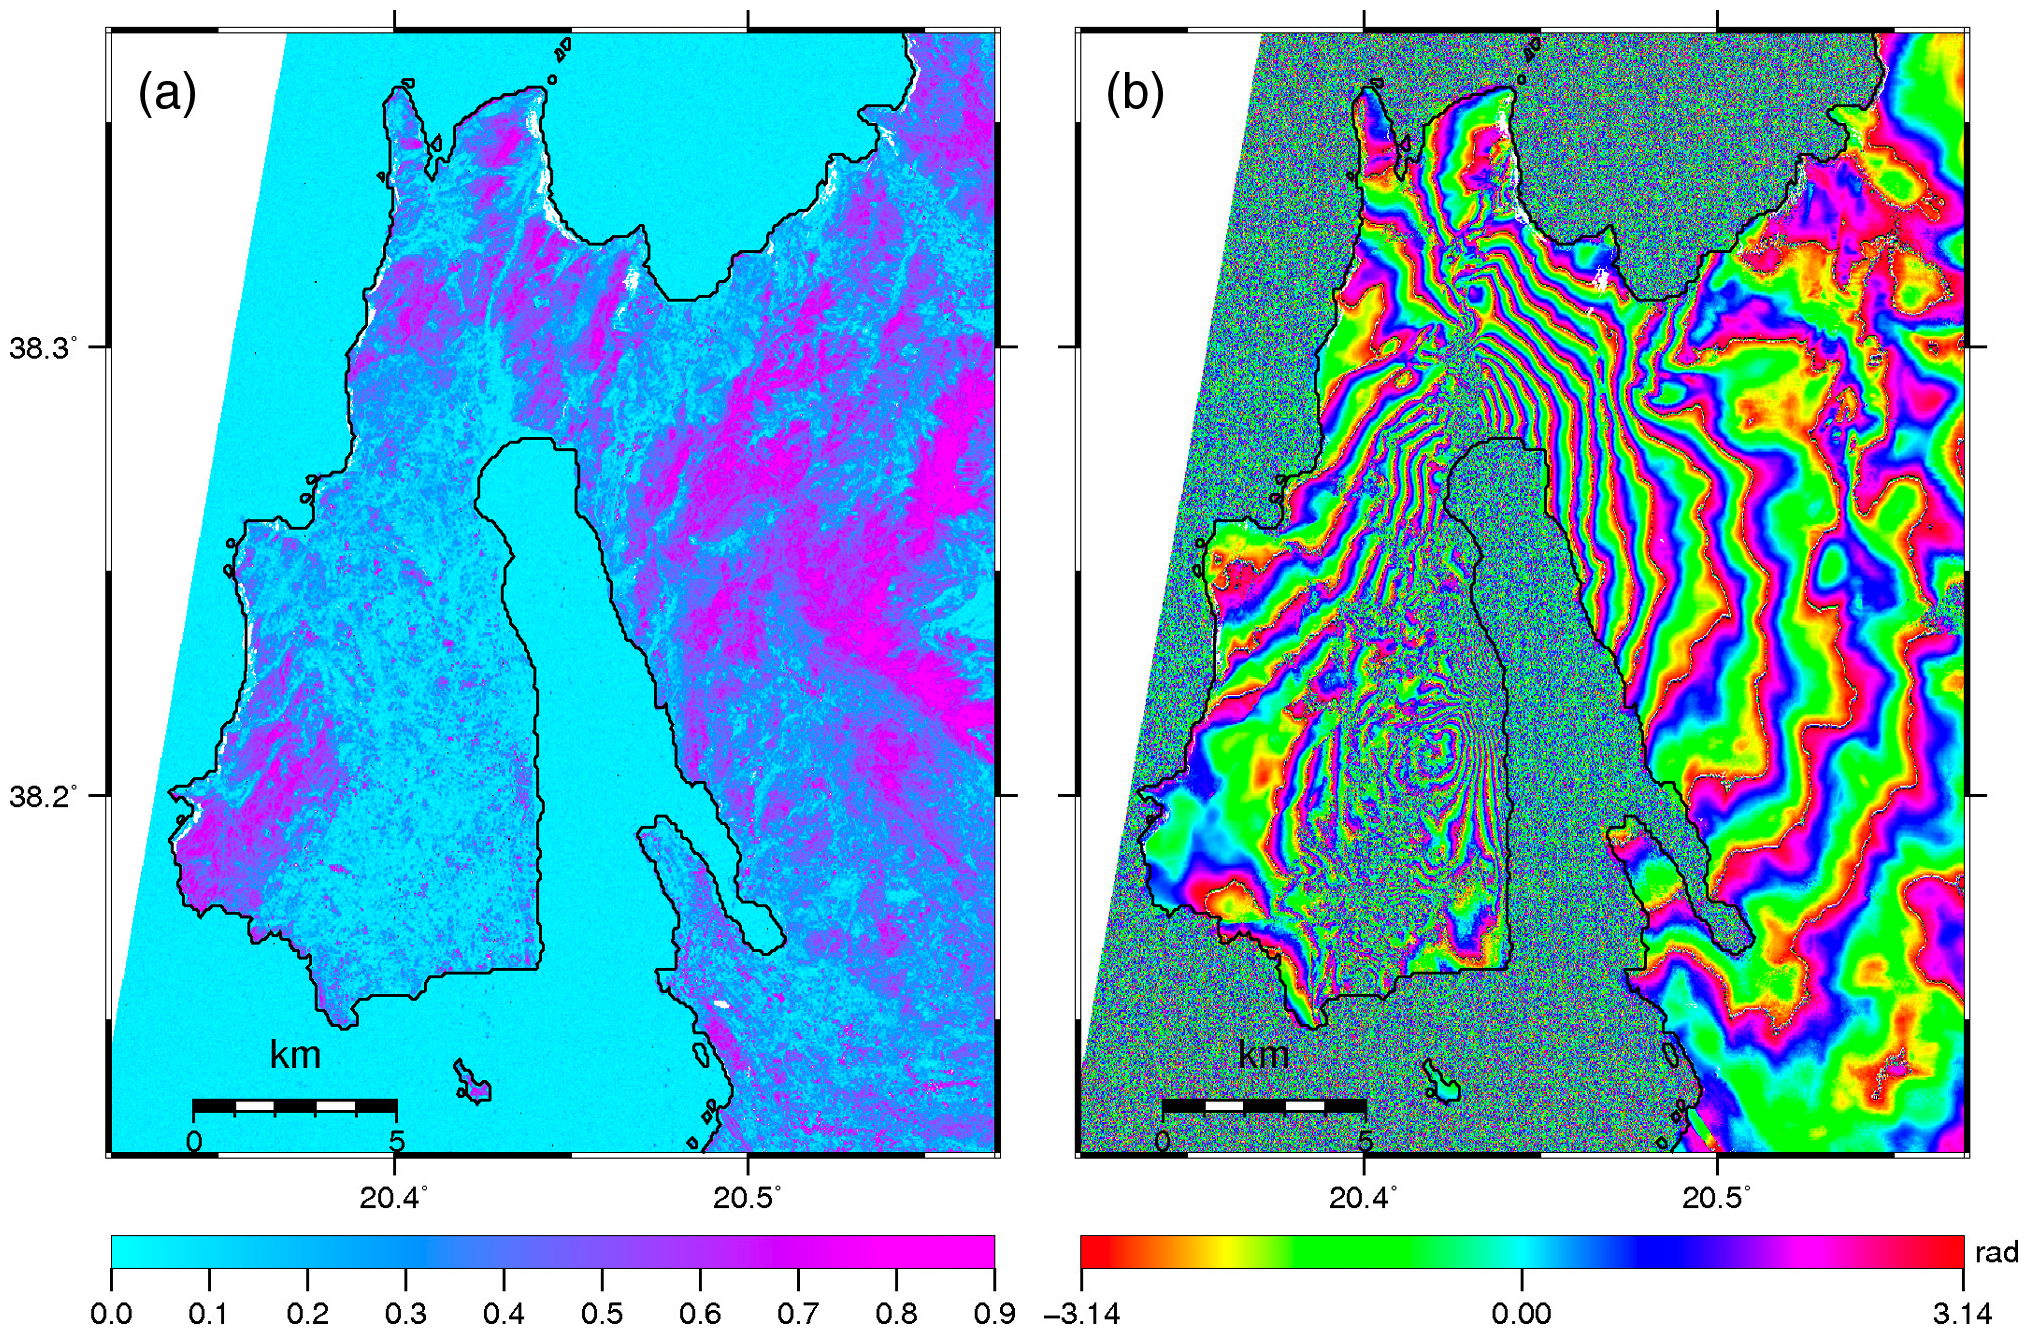
Figure S1. (a) InSAR phase coherence magnitude and (b) wrapped phase for I1 (COSMO–SkyMed pair) in Table S2.
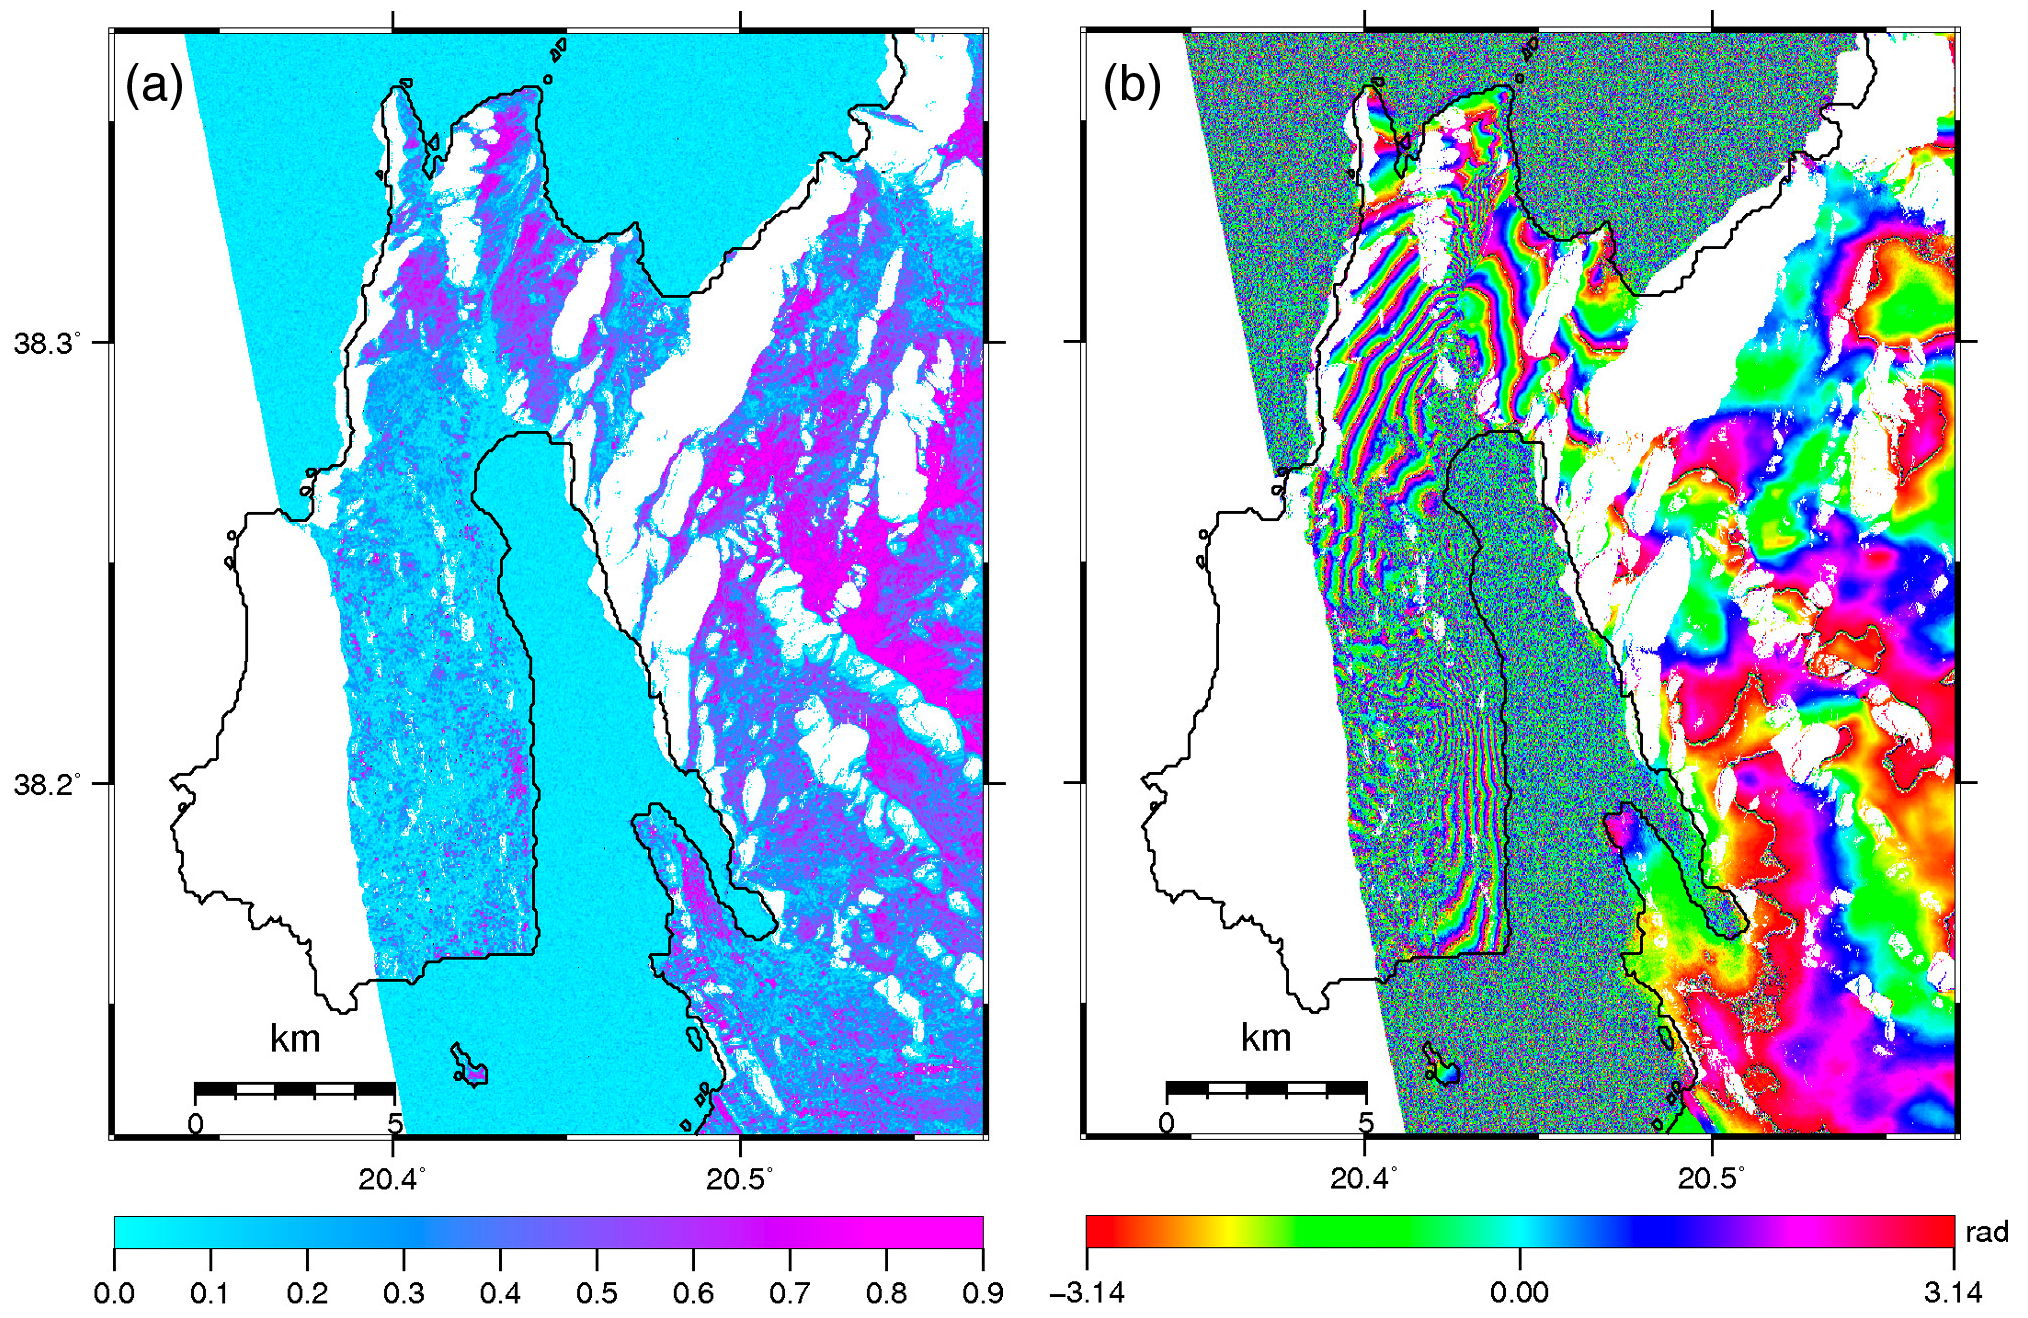
Figure S2. (a) InSAR phase coherence magnitude and (b) wrapped phase for I2 (TanDEM–X pair) in Table S2.
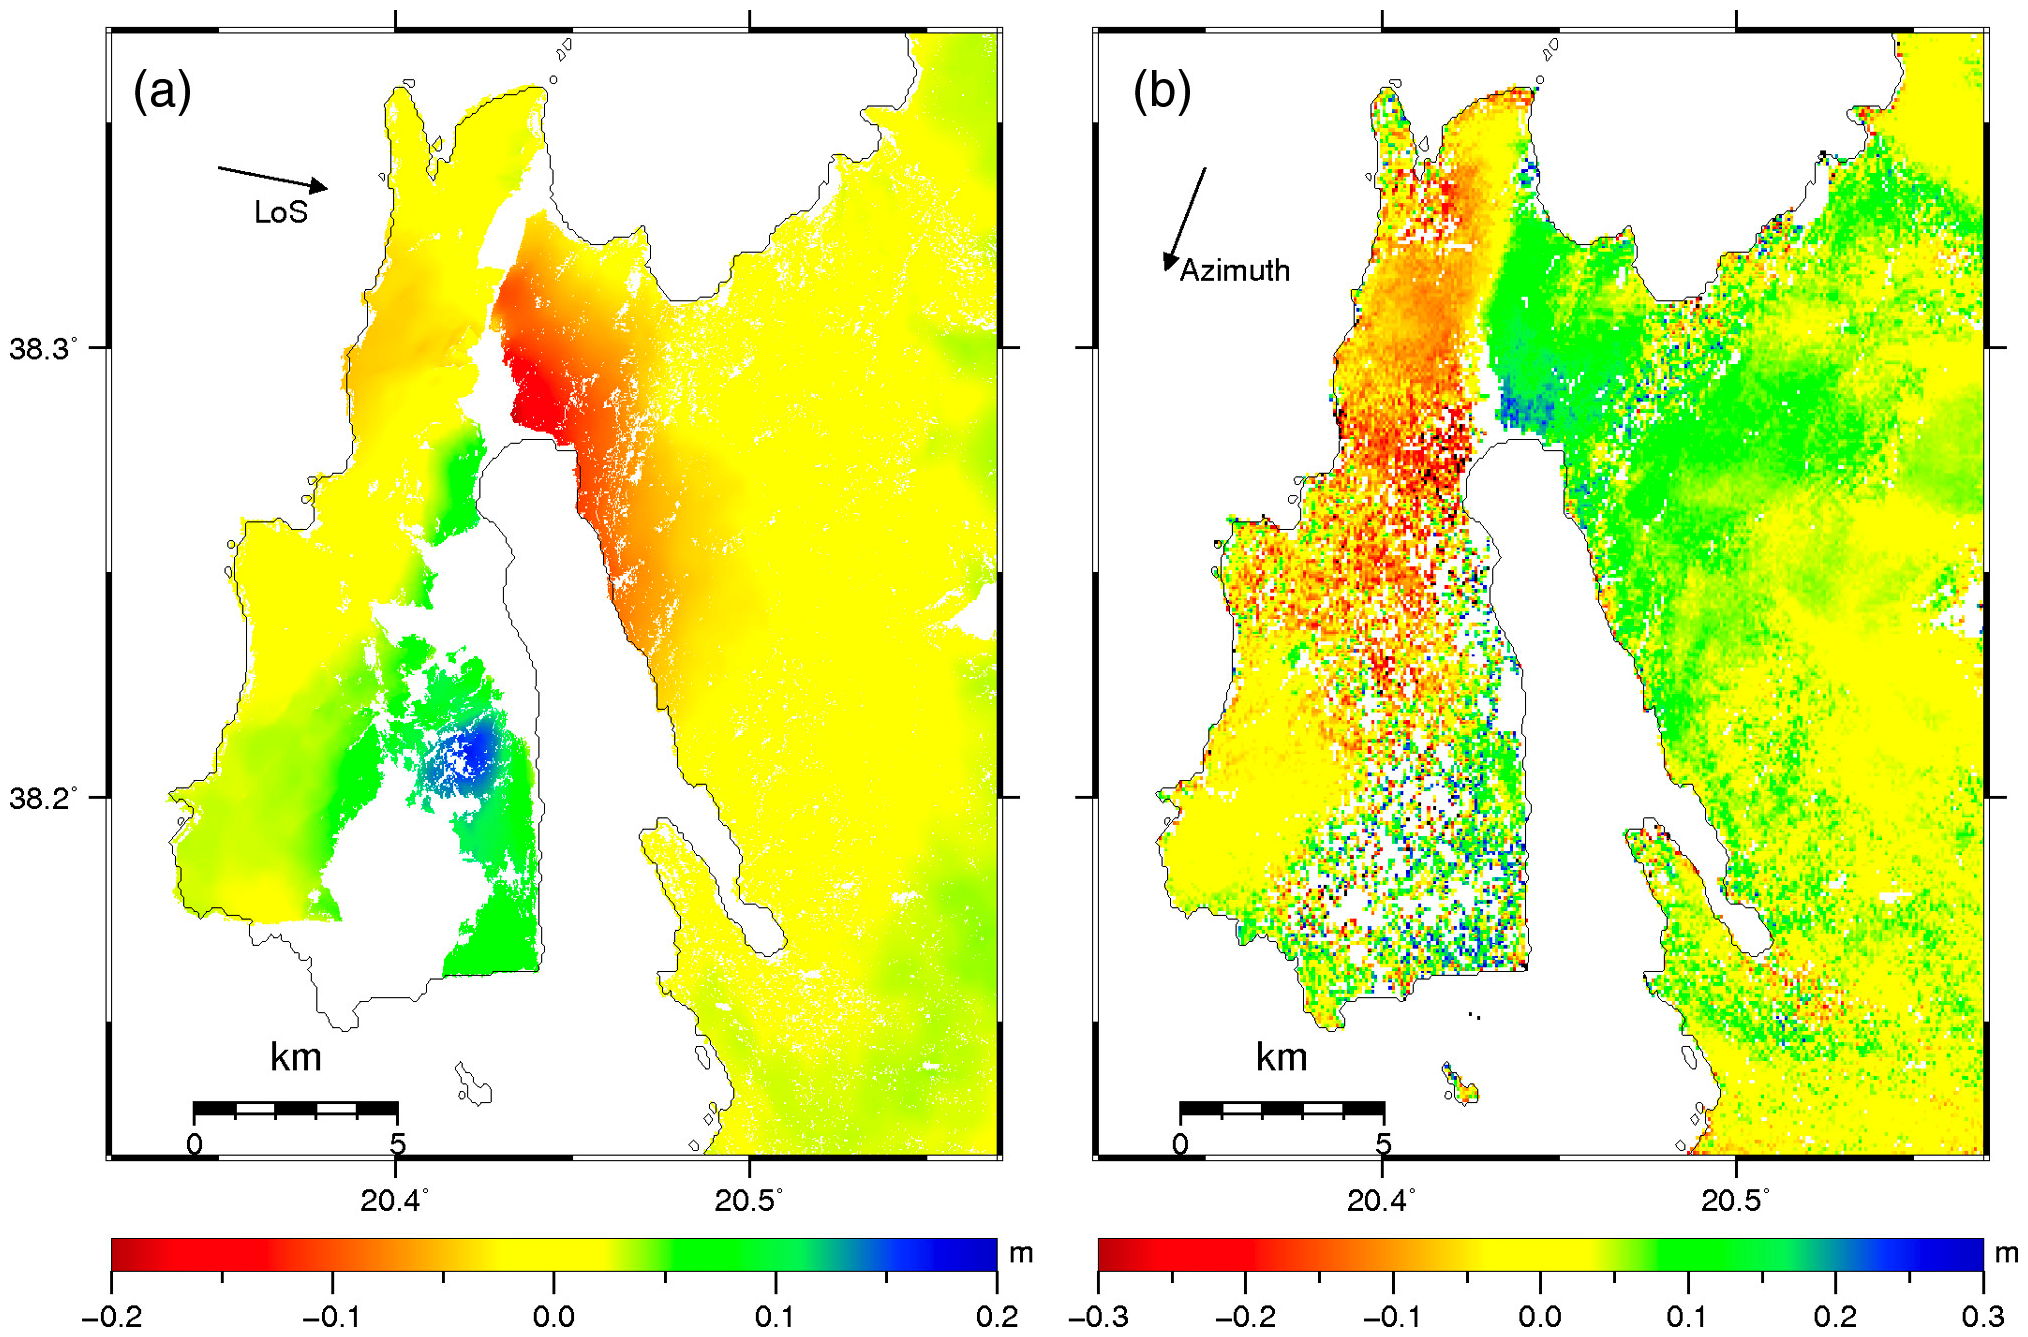
Figure S3. (a) I1 (COSMO–SkyMed) Differential Interferometric Synthetic Aperture Radar (DInSAR) line-of-sight (LoS) displacement. Positive values indicate motion toward the satellite (i.e., uplift and/or eastward motion). (b) Multiaperture interferometry (MAI) azimuth displacement. Positive values indicate motion in the satellite flight path (i.e., approximately southward).
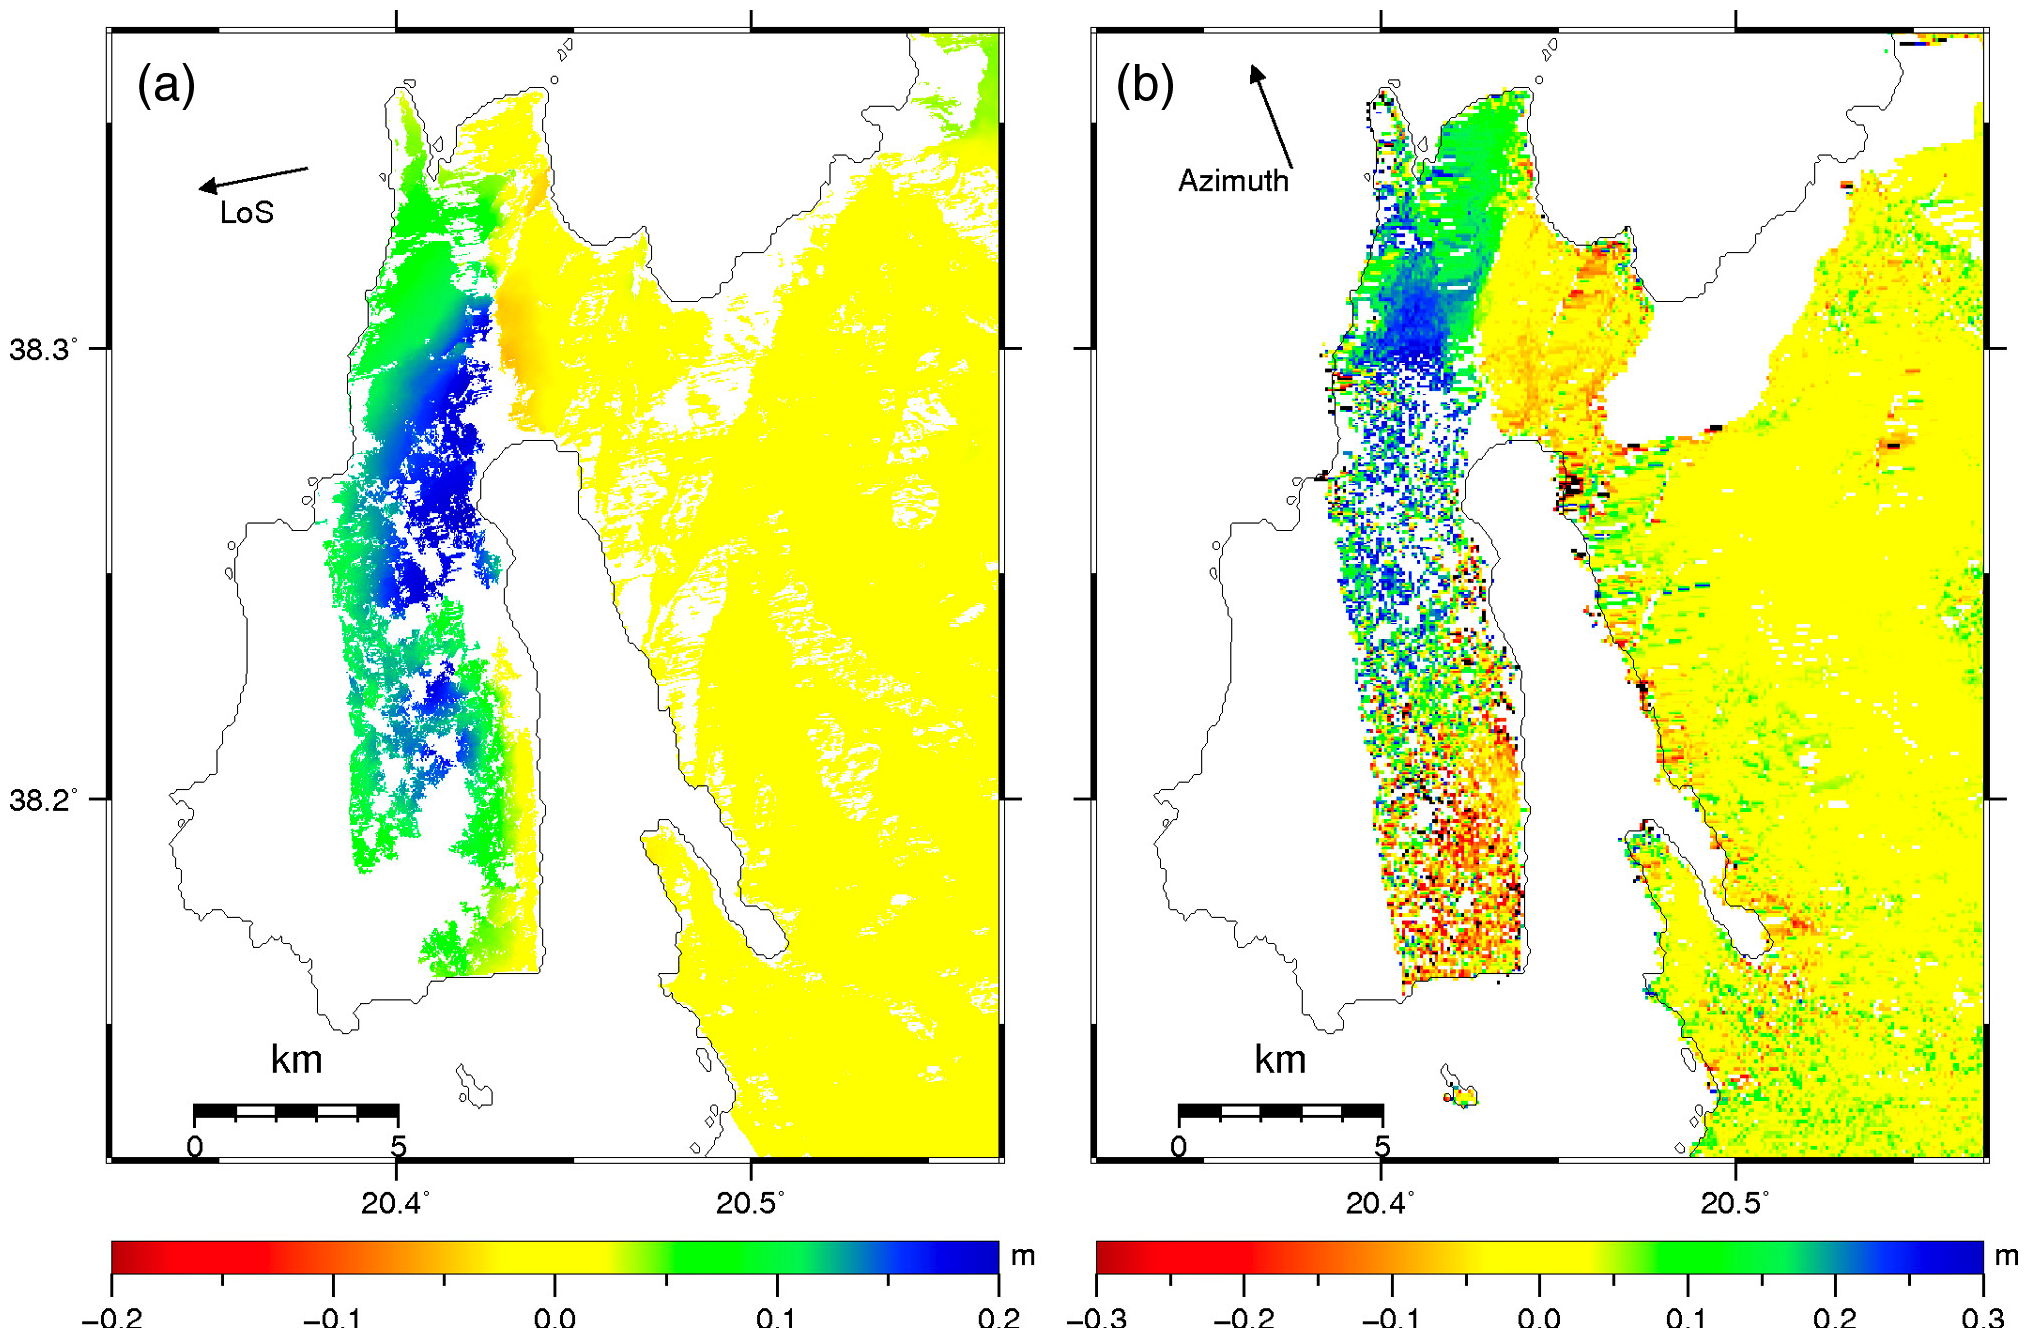
Figure S4. (a) I2 (TanDEM–X) DInSAR LoS displacement. Positive values indicate motion toward the satellite (i.e., uplift and/or westward motion). (b) MAI azimuth displacement. Positive values indicate motion in the satellite flight path (i.e., approximately northward).
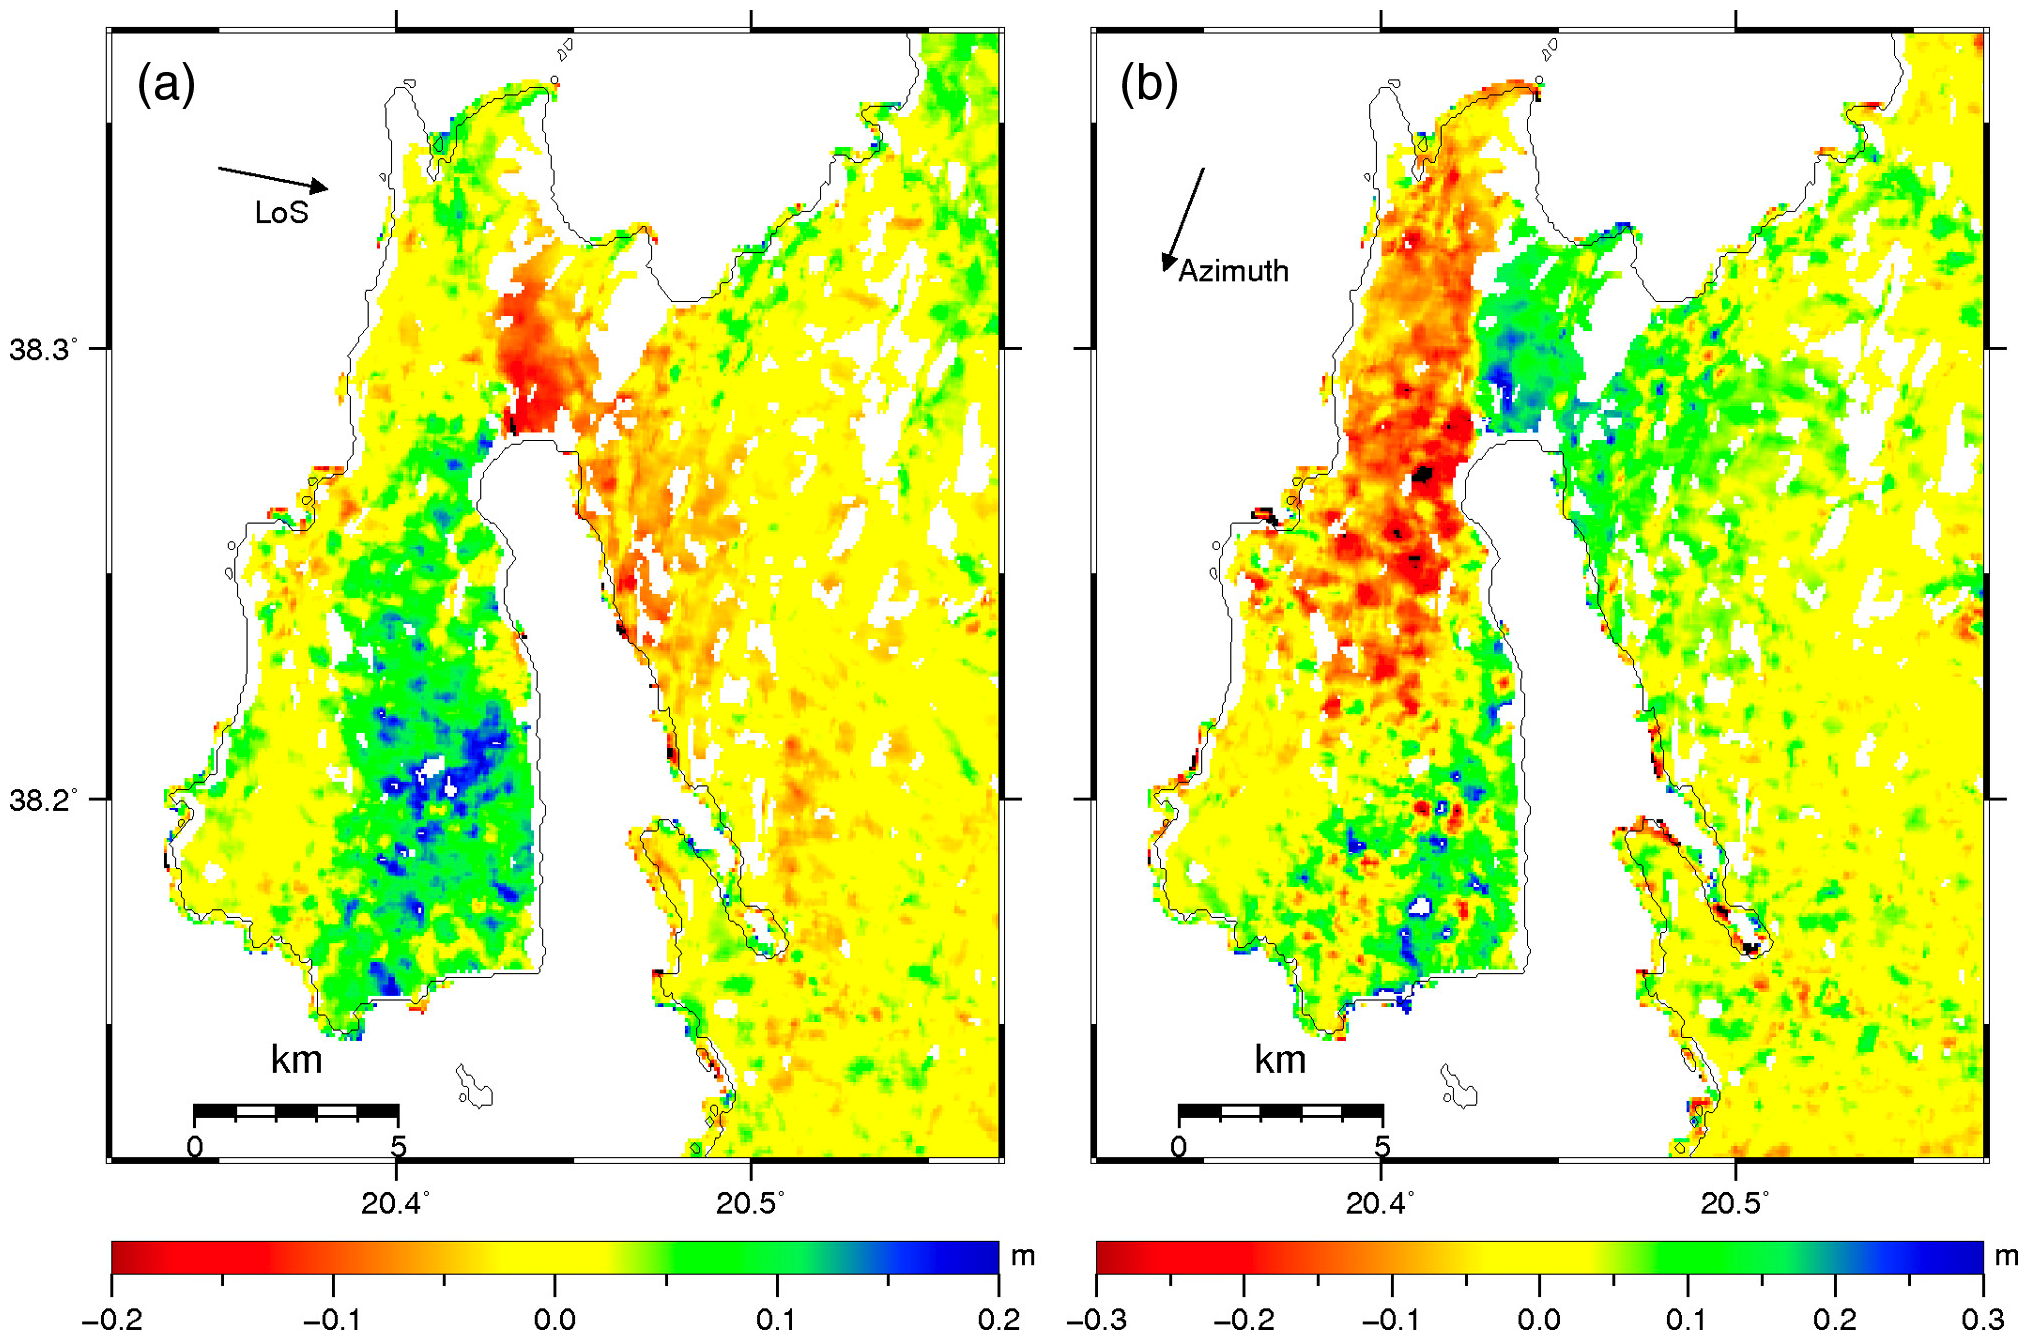
Figure S5. (a) I1 (COSMO–SkyMed) intensity tracking (ITR) LoS displacement. Positive values indicate motion toward the satellite (i.e. uplift and/or eastward motion). (b) ITR azimuth displacement. Positive values indicate motion in the satellite flight path (i.e., approximately southward).
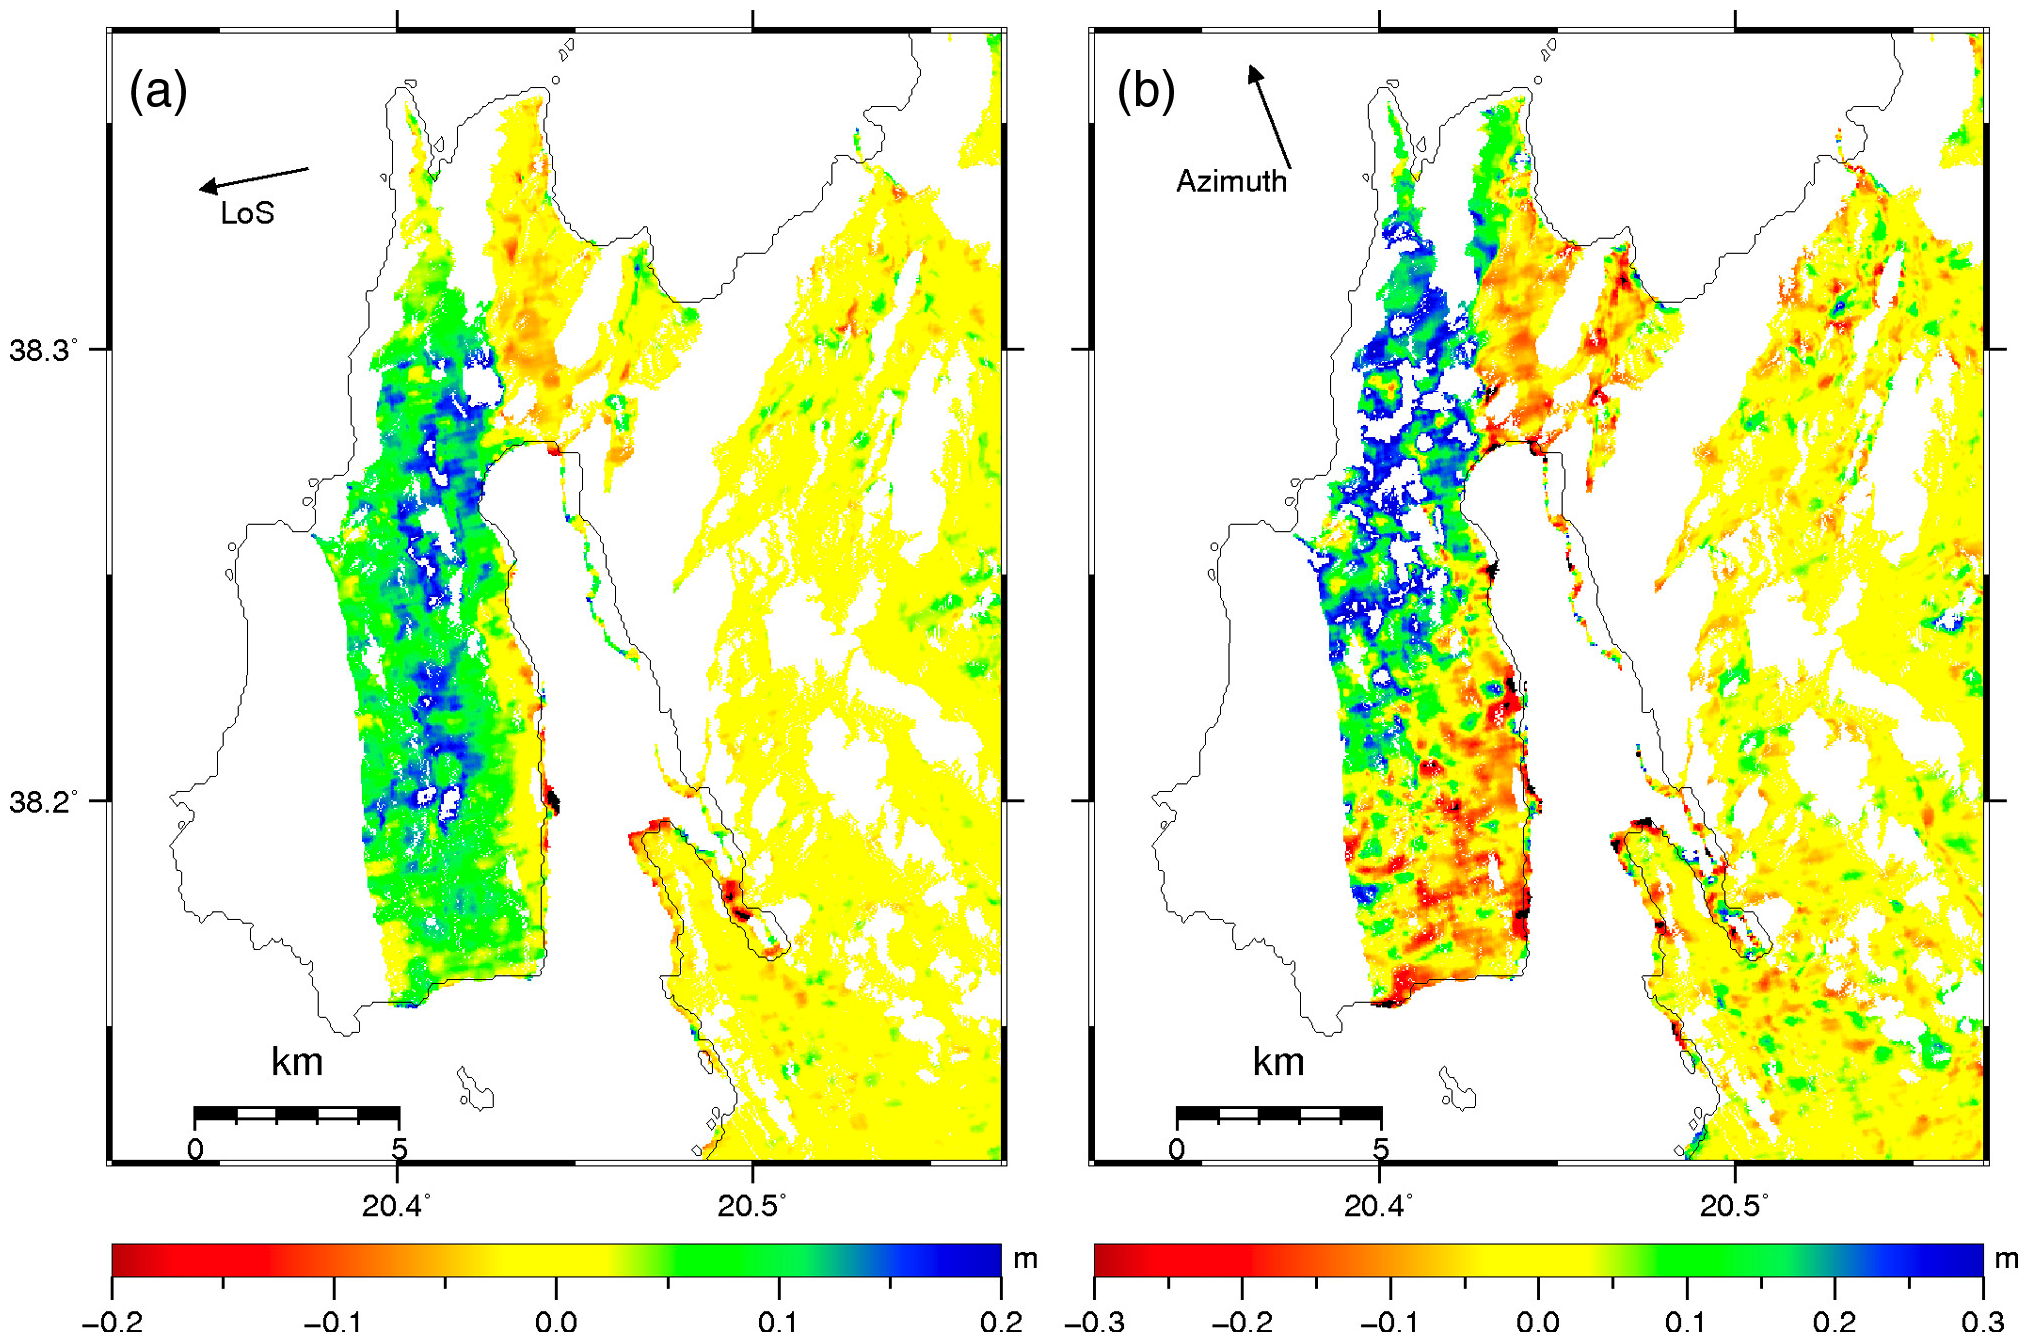
Figure S6. (a) I2 (TanDEM–X) ITR LoS displacement. Positive values indicate motion toward the satellite (i.e., uplift and/or westward motion). (b) ITR azimuth displacement. Positive values indicate motion in the satellite flight path (i.e., approximately northward).
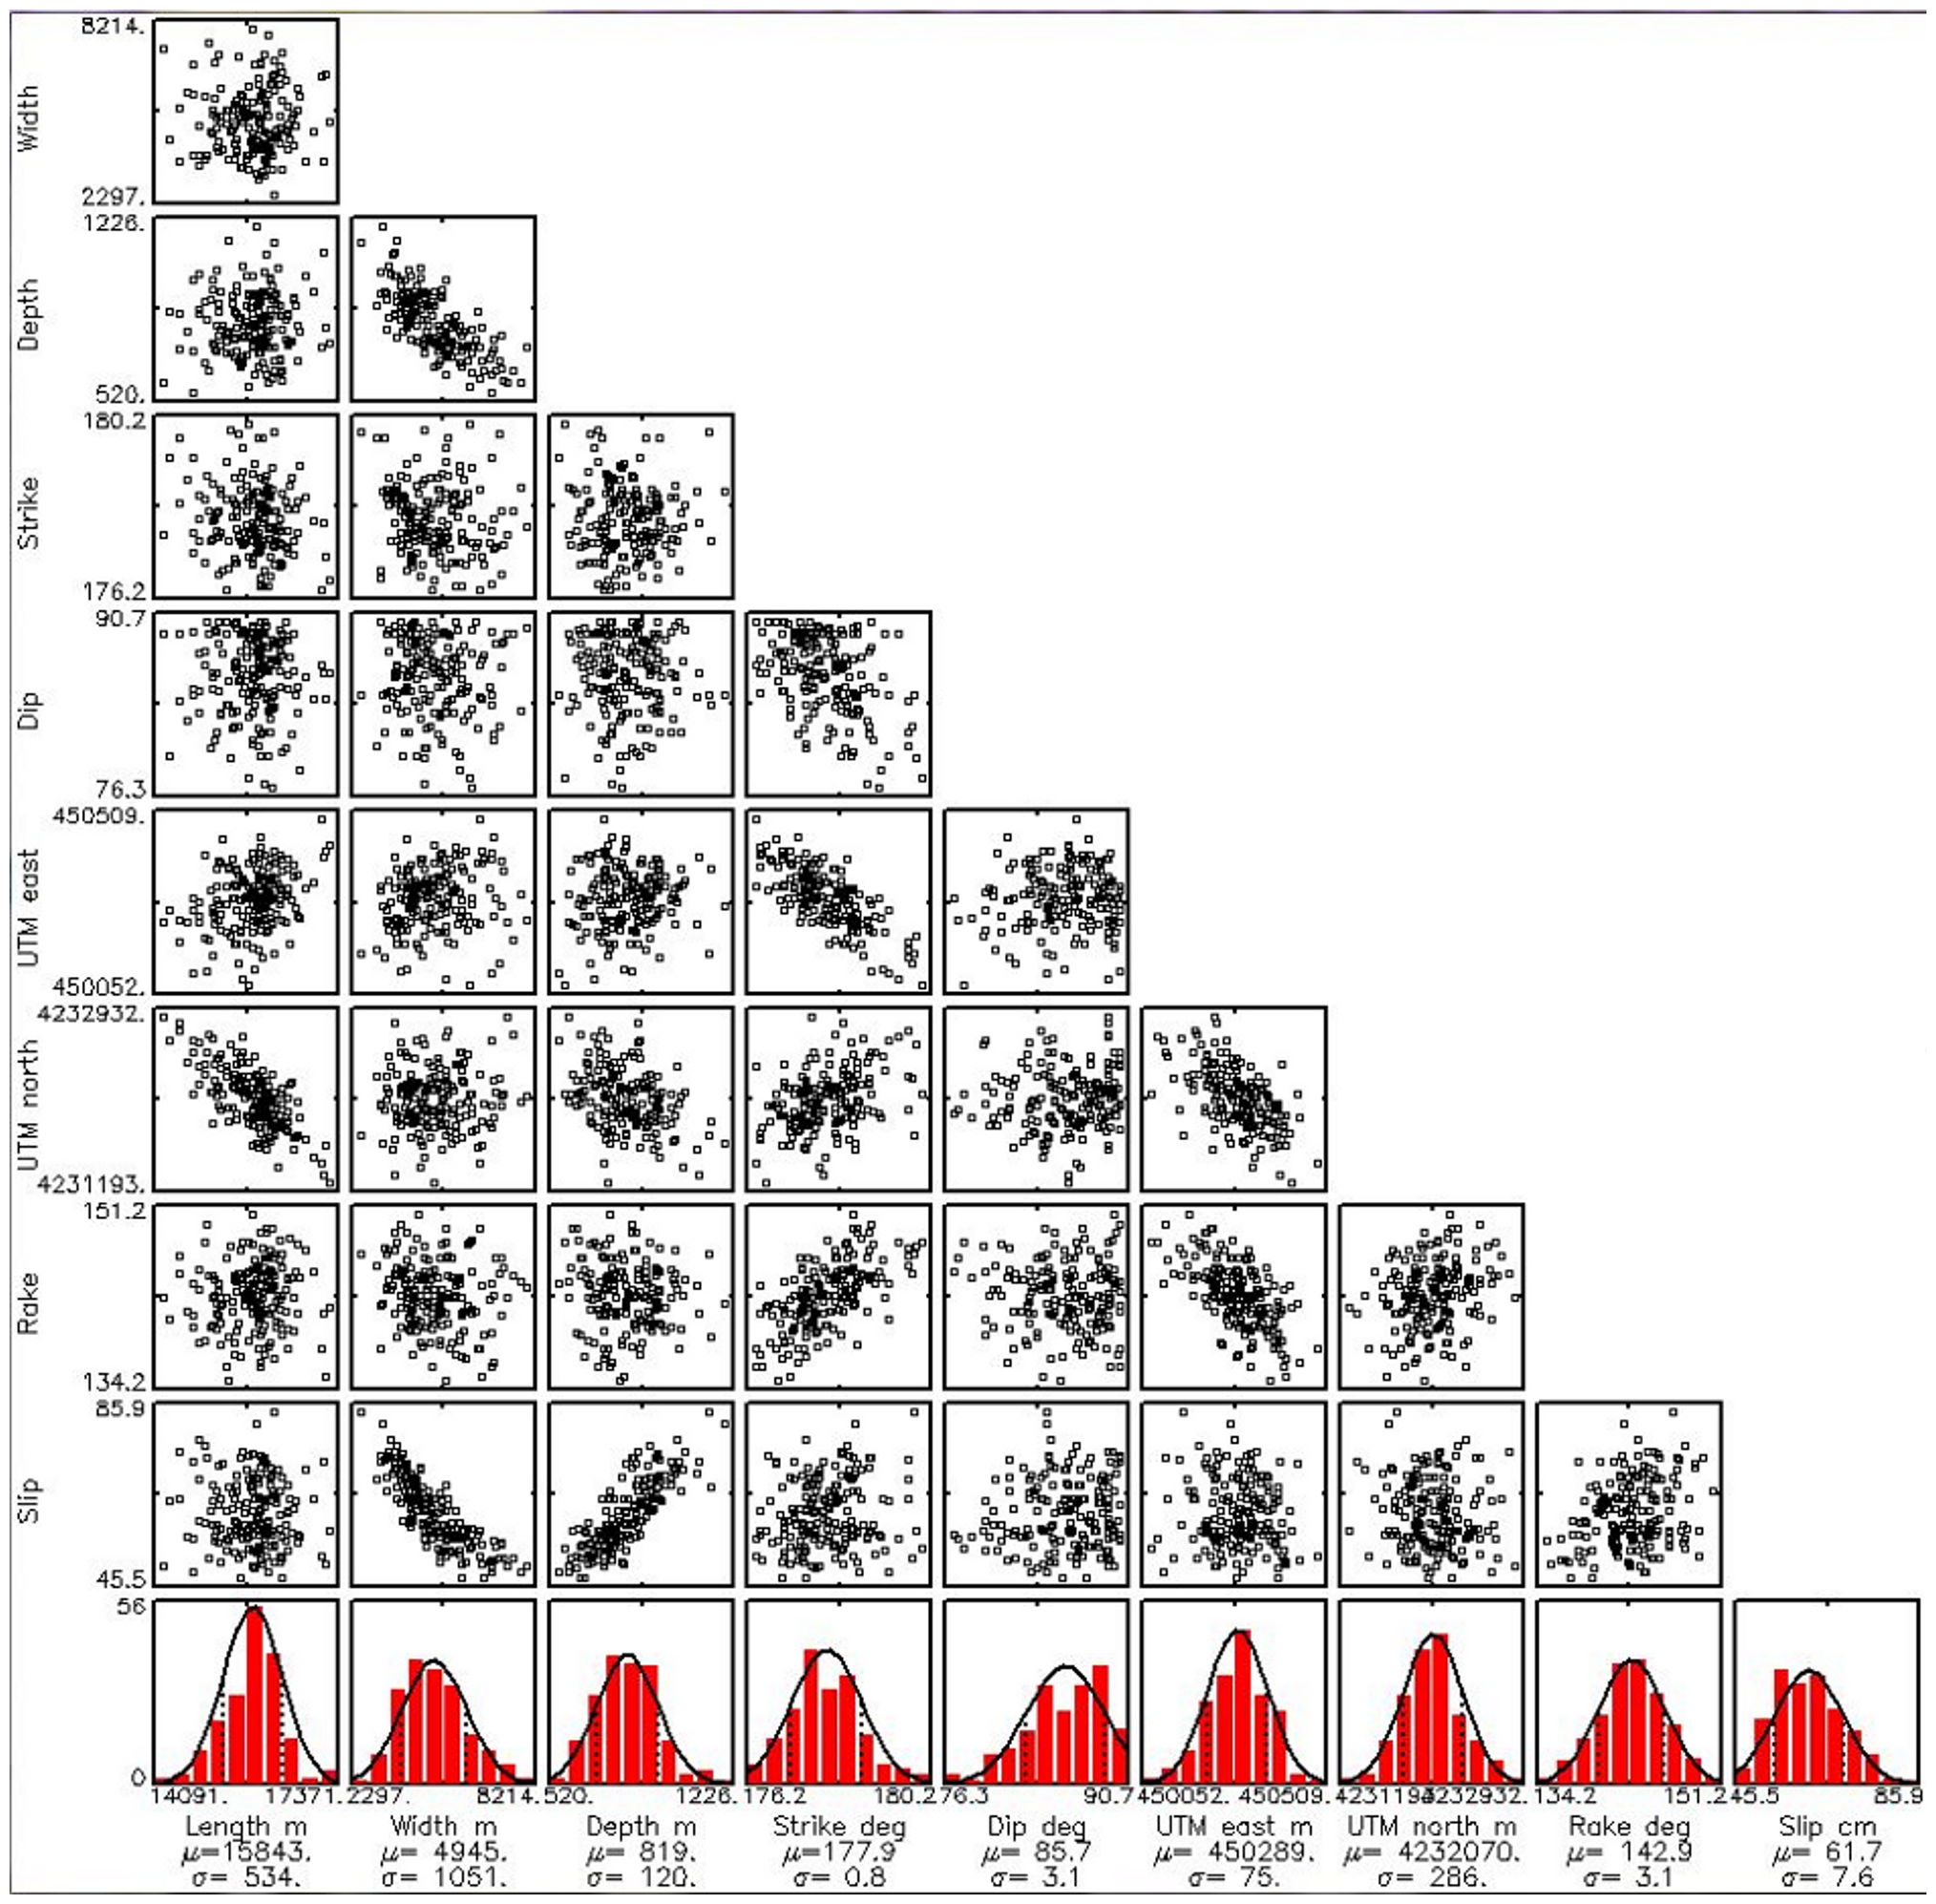
Figure S7. Single-fault model parameter tradeoffs and uncertainties for the nonlinear uniform slip inversion discussed in the Single-Fault Model section of the main article.
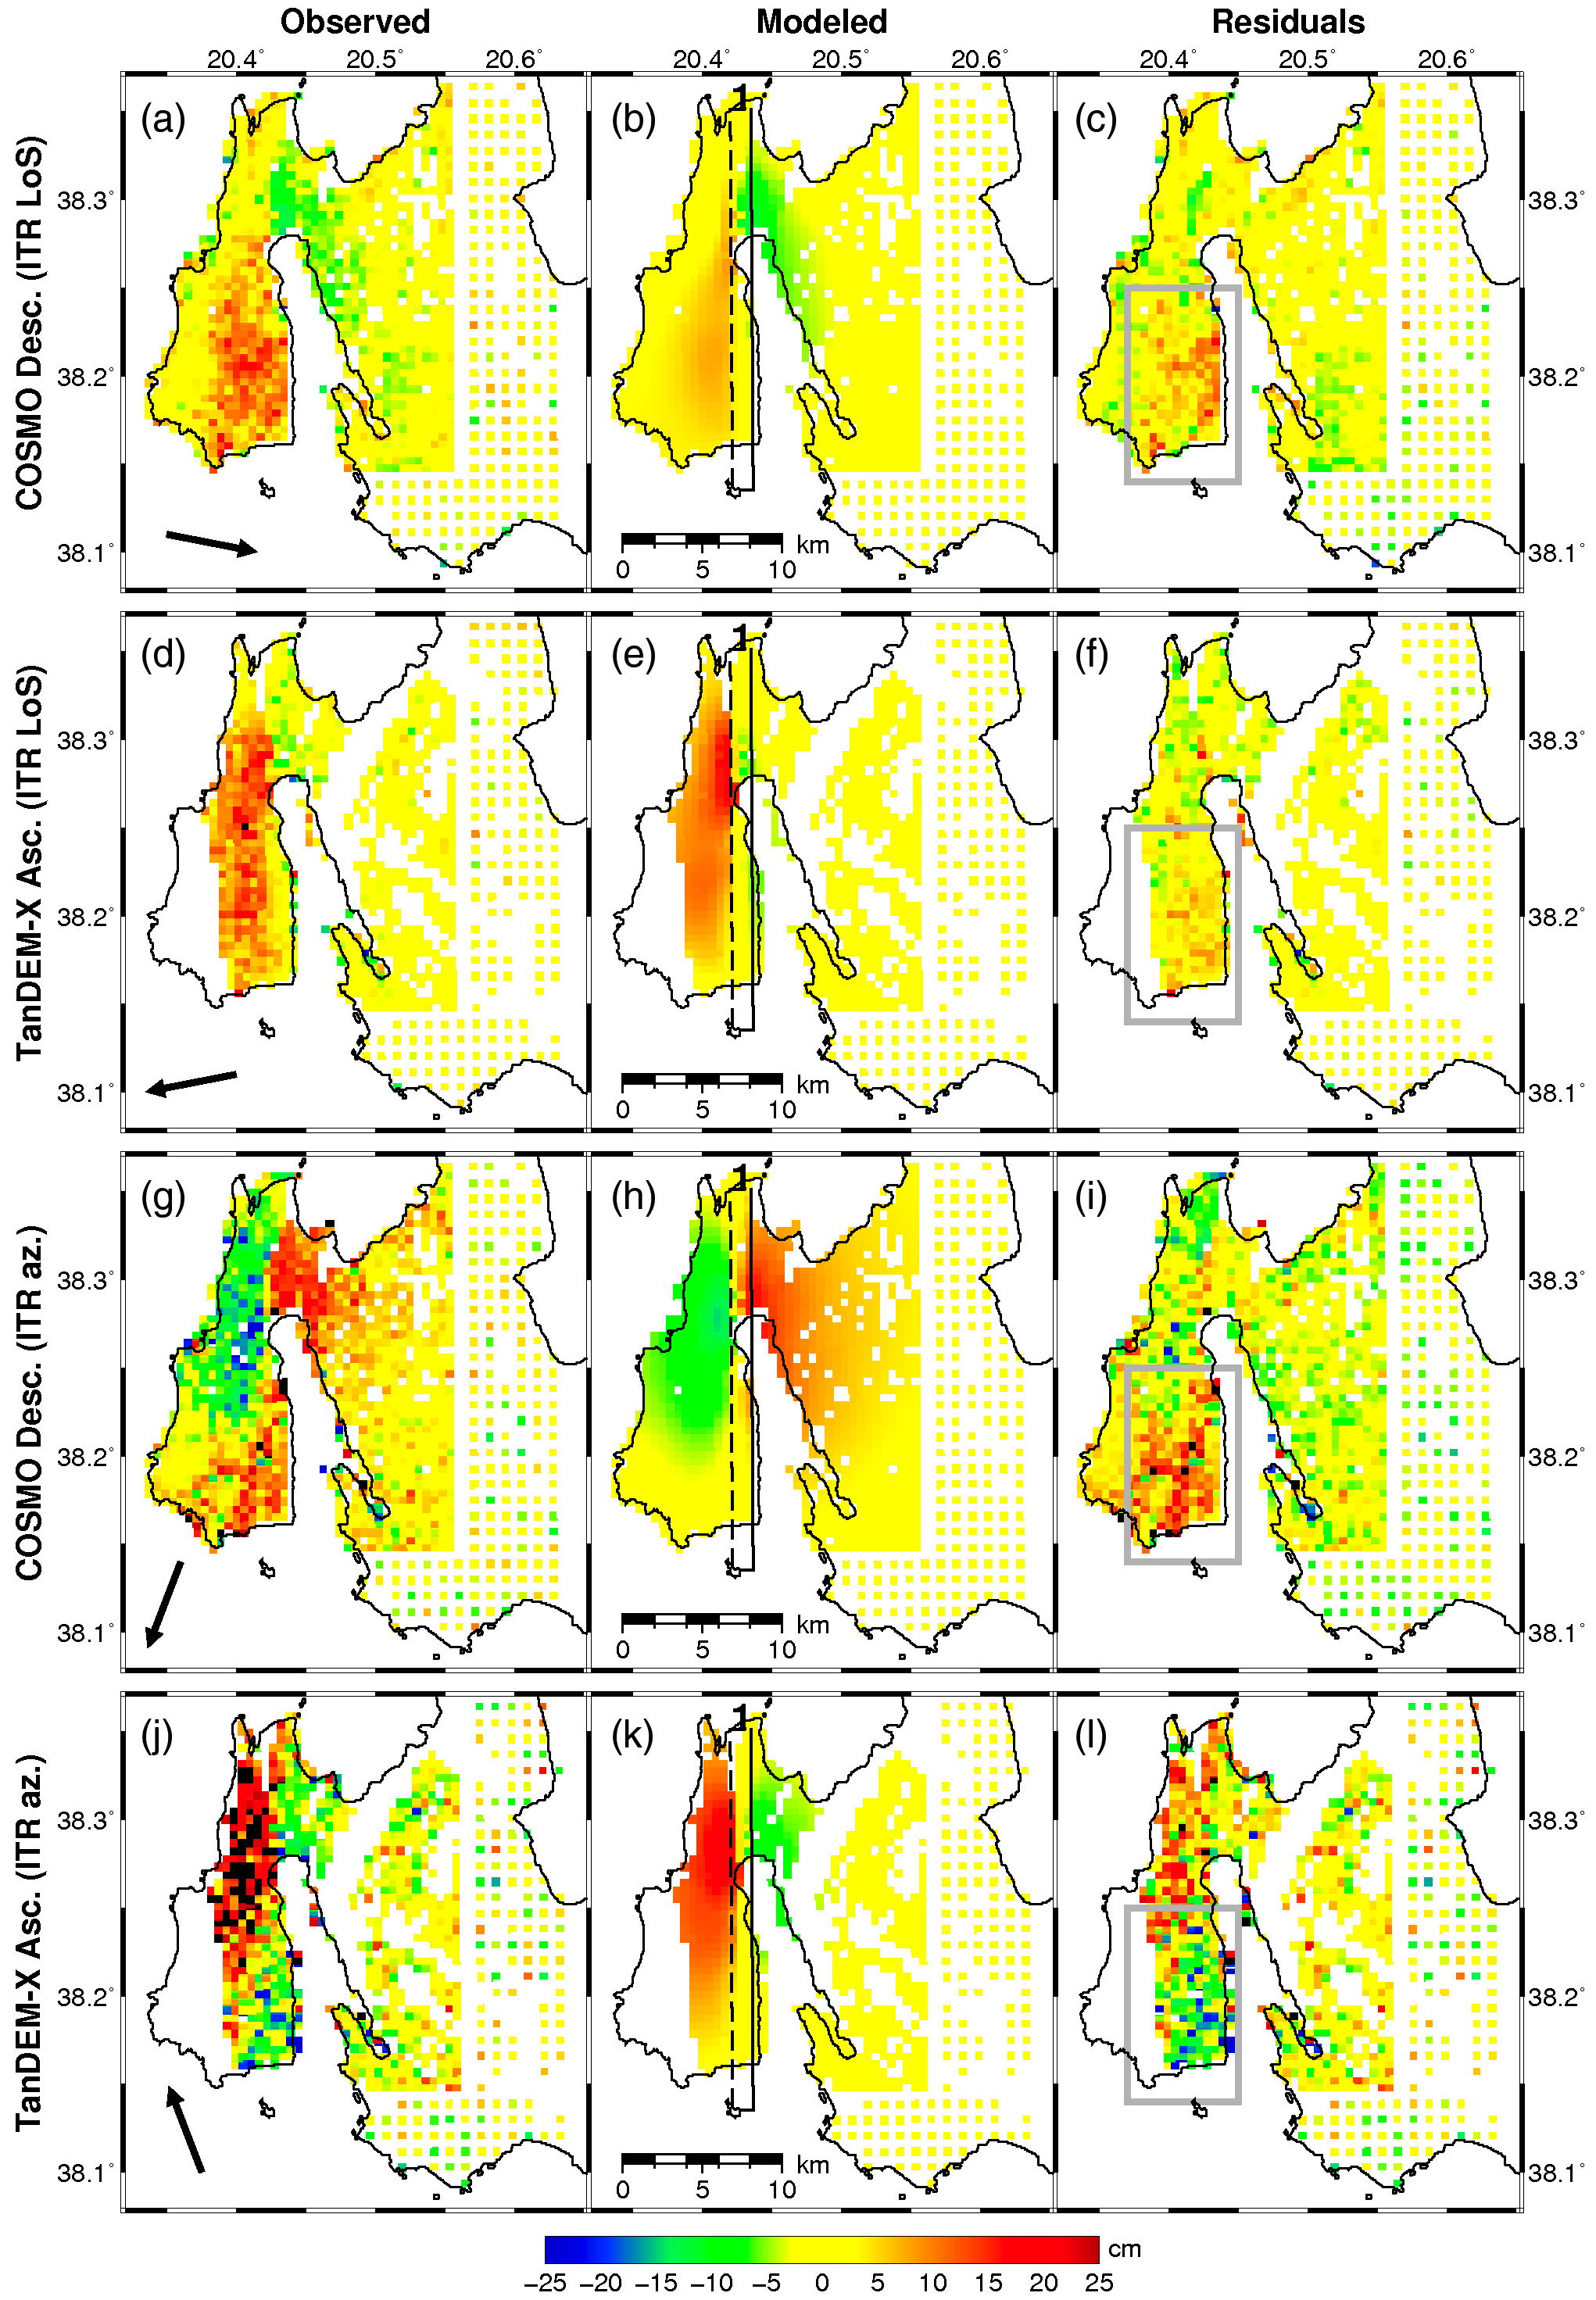
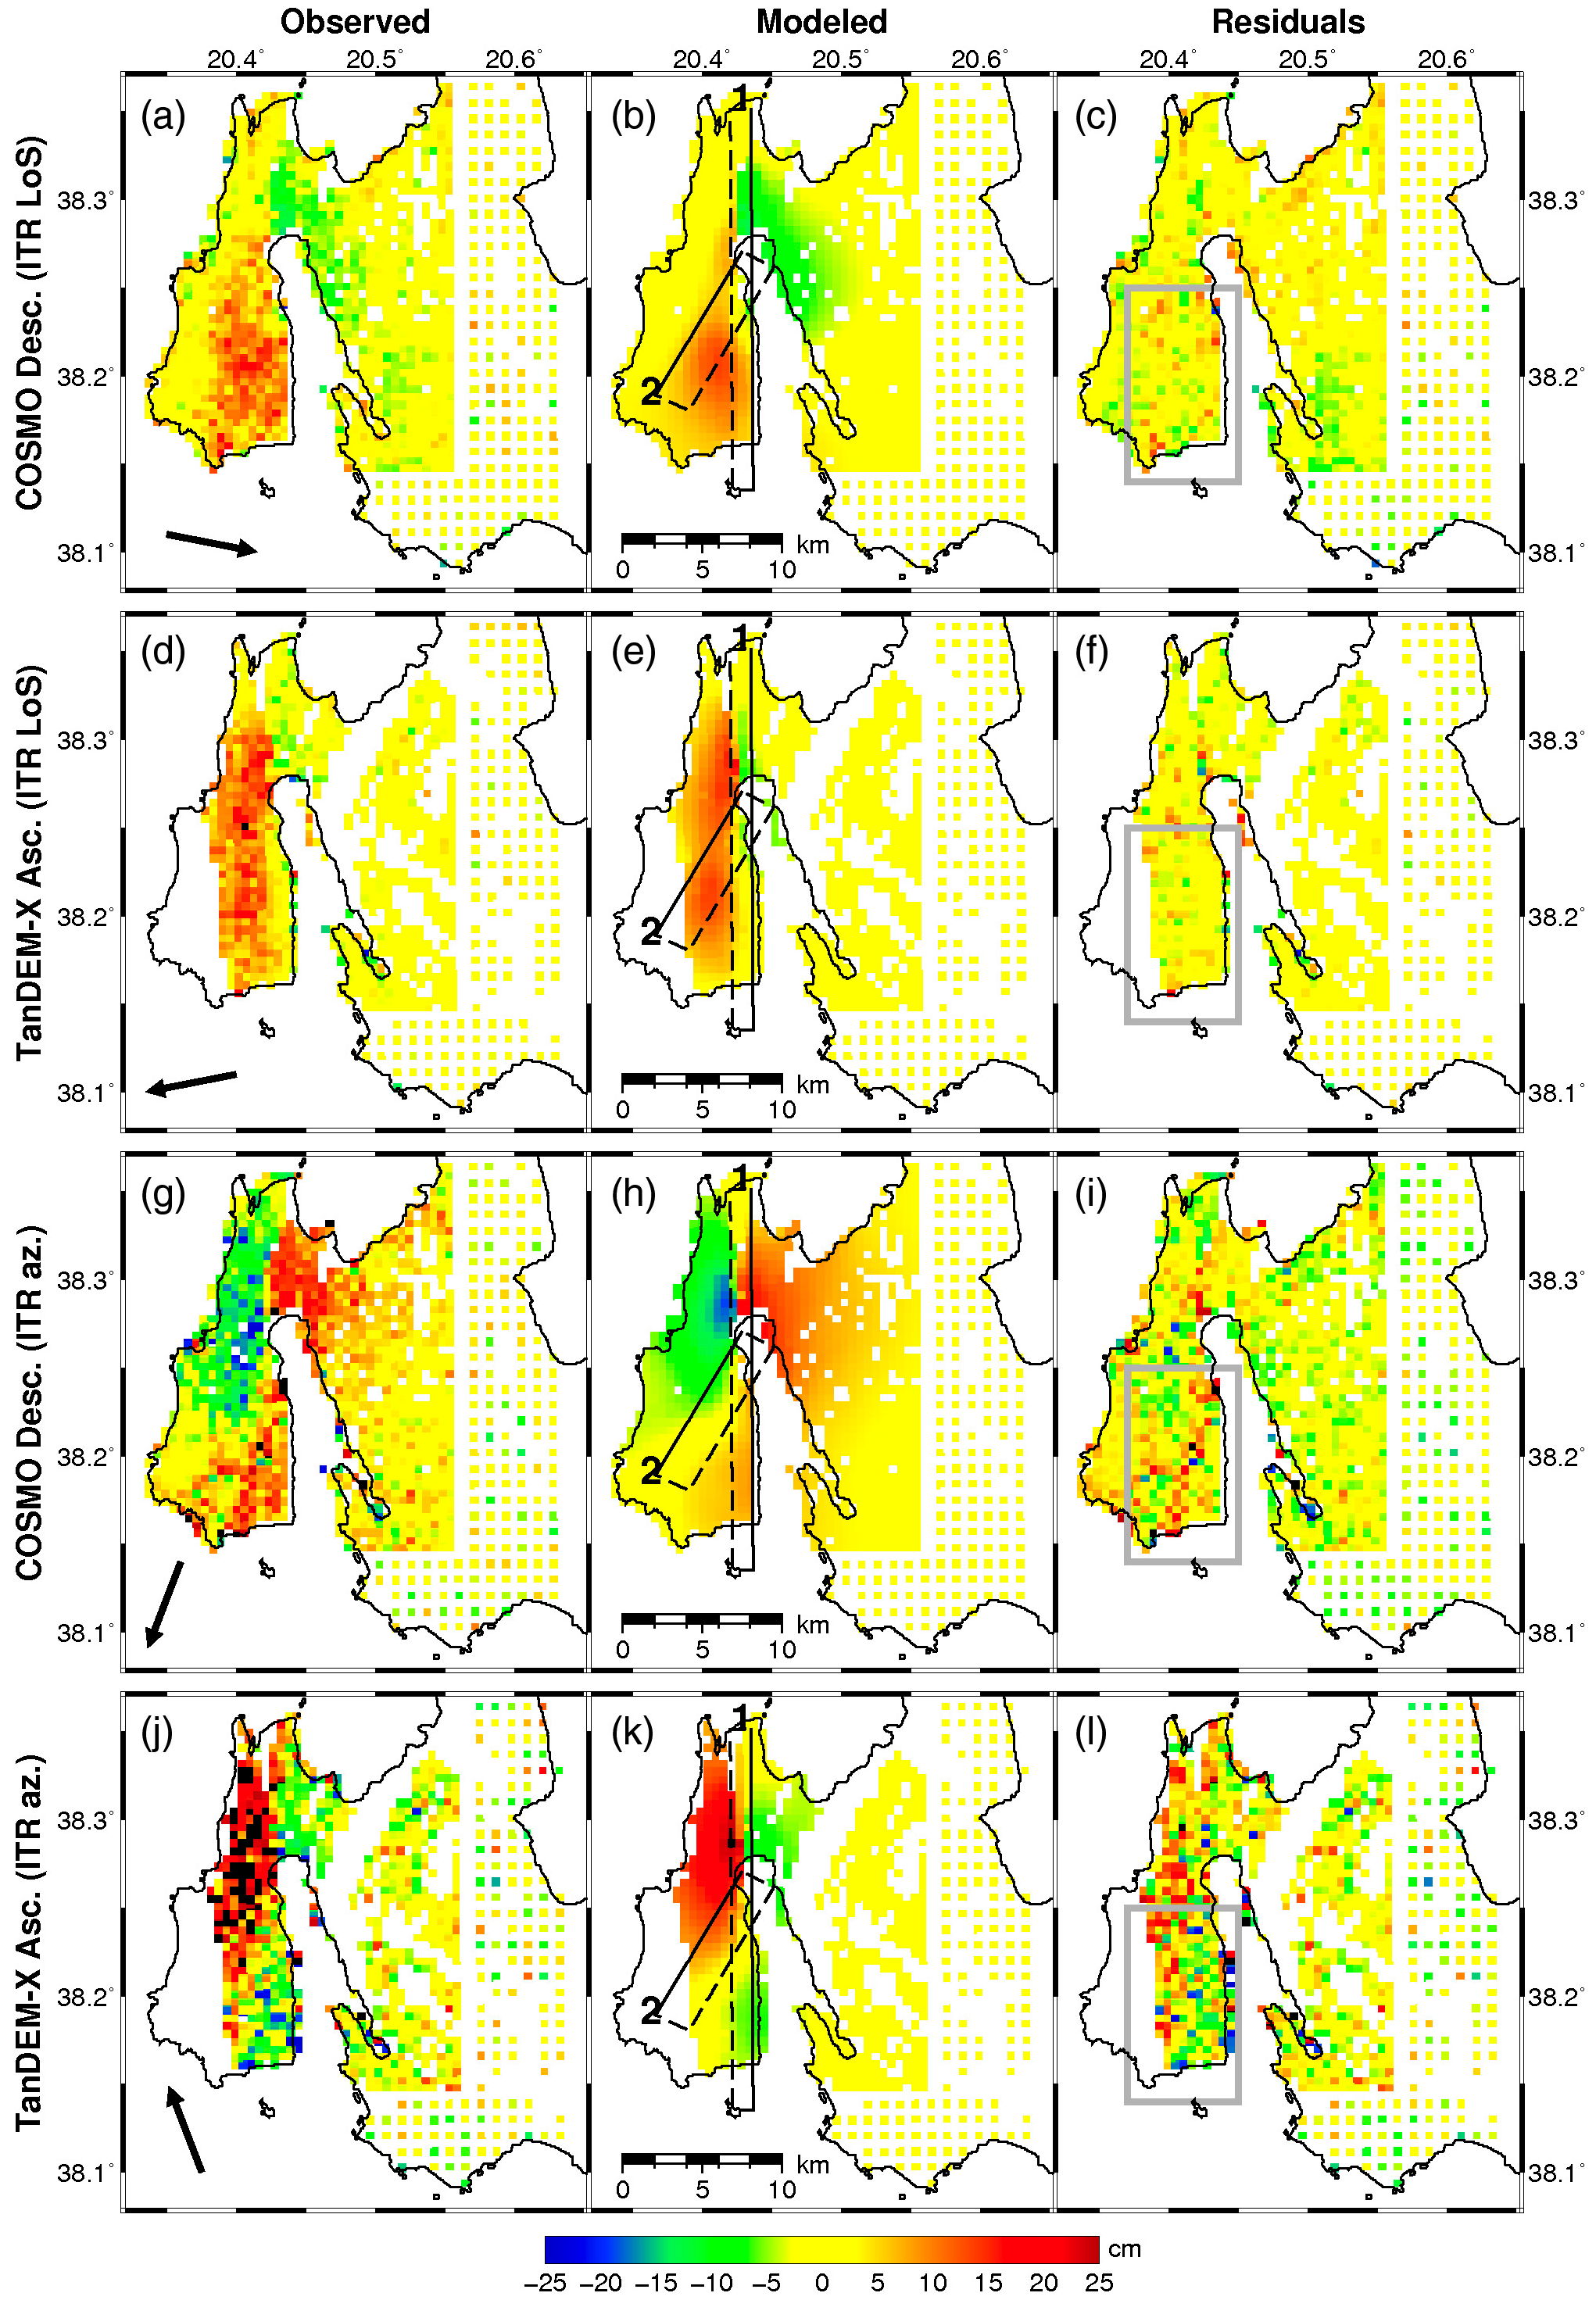
Figure S8. (Left) Observed, (middle) modeled, and (right) residual (observed minus modeled) displacements for the single-fault model discussed in the Single-Fault Model section of the main article. Sensor and measurement techniques (ITR) are reported to the left. The arrows in the first column indicate the direction of positive displacement and represent the ground projection of the LoS vector and of the satellite flight path for ITR LoS and azimuth displacement maps, respectively. The black rectangles in the central column represent the modeled fault plane (fault 1 in the main article).
Figure S9. Same as for Figure S8, but for the two-fault model discussed in the Two-Fault Model section of the main article.
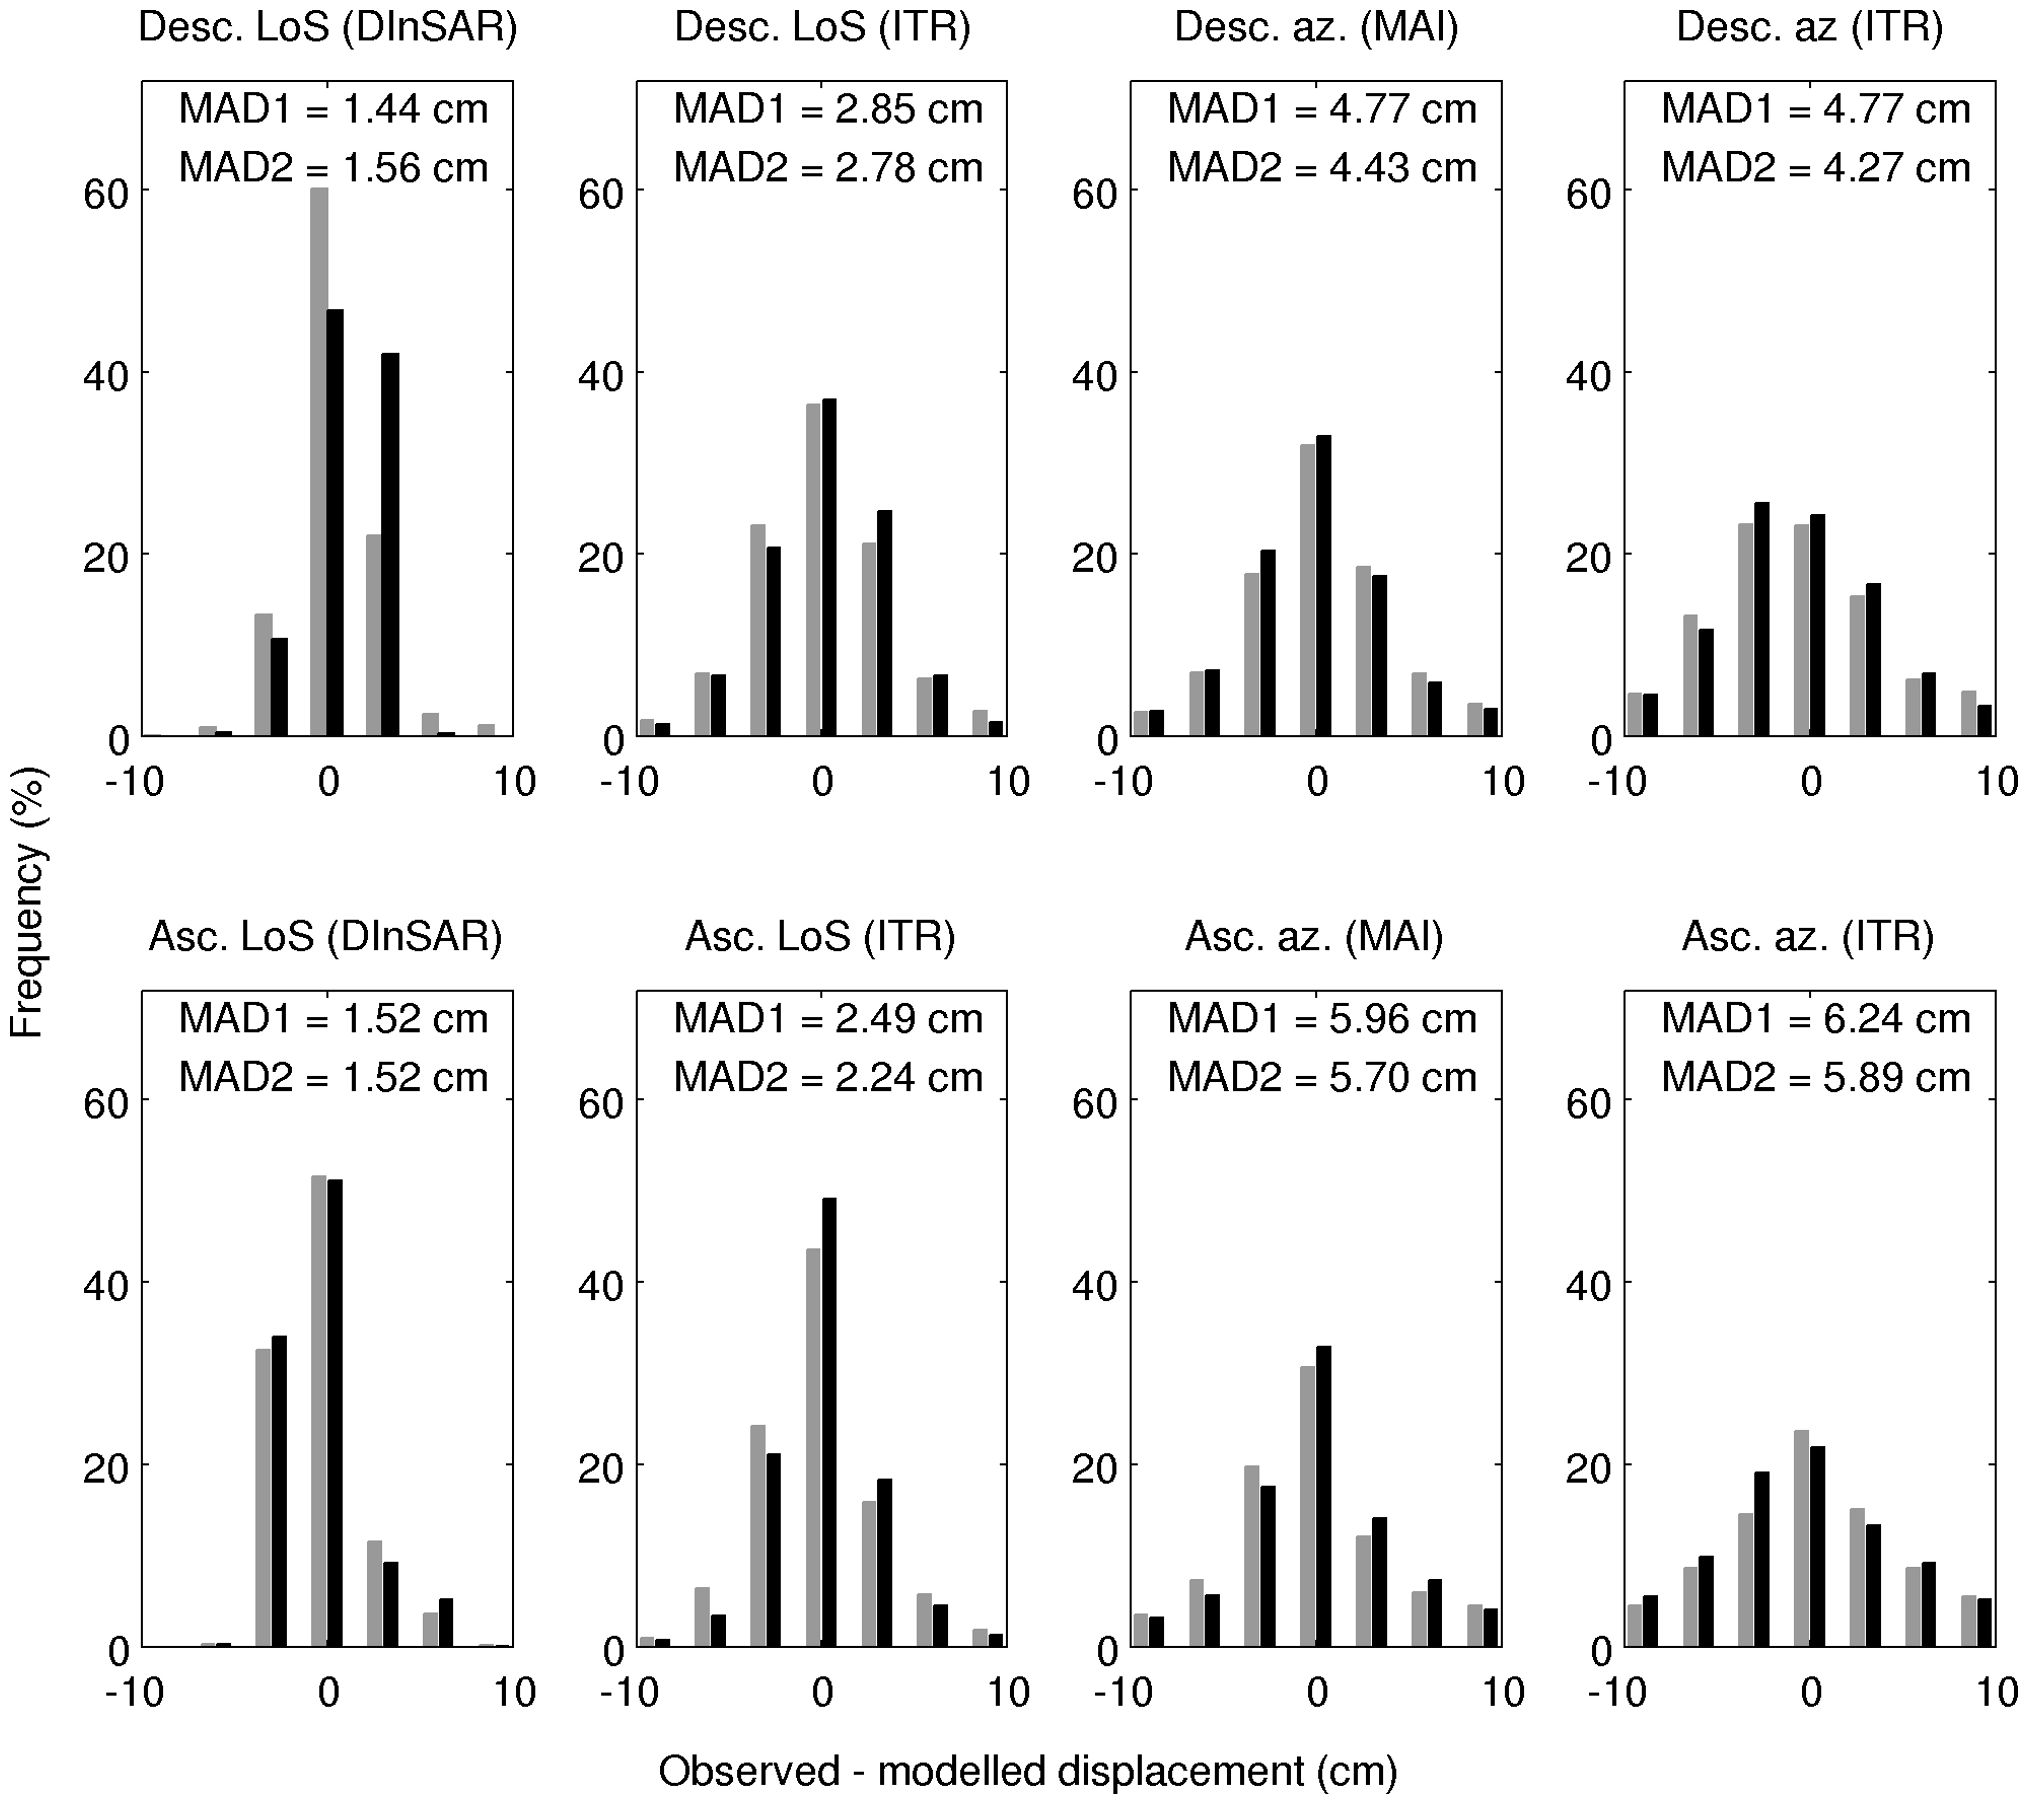
Figure S10. Histograms (frequency of occurrence) of the residuals and median absolute deviations (MADs) between modeled and observed displacements for the eight SAR measurements used in this study. Gray bars and MAD1 values refer to the single-fault model in the Seismic Source Modeling section of the main article. Black bars and MAD2 values refer to the two-fault model.
Table S1. The six independent moment tensor elements from seismological and SAR-based solutions for the source of the 3 February 2014 earthquake.
Table S2. SAR image pairs available on the area of interest spanning the 3 February 2014 event.
Table S3. Differences between east, north and up components of the coseismic displacement gradients between KEFA and VLSM cGPS stations (Fig. 3) due to the 3 February 2014 event.
[ Back ]