This electronic supplement contains location uncertainty estimation, figures of waveform comparison, location maps, and Pg/Lg spectral ratios, and tables of earthquake parameters and Lg-wave amplitude ratios.
The uncertainty of the detected event location would depend on the distribution of seismic stations and actual seismic noise at the time of recording. We estimate the uncertainty of the location in this way: We scale down the signals of the 2013 test with a scaling factor of 6.7×10⁻⁵ and superimpose the background noise of the 2010 event to simulate a small nuclear test with the mean cross-correlation coefficient (CC) level equal to that of the 2010 event detection using the match-and-locate (M&L) method (M. Zhang and L. Wen, unpublished manuscript, 2014). We then use the 2009 and 2013 tests as a template and the constructed waveforms to search for the best-fitting location of the scaled-down 2013 test, following the same procedure of detecting and locating the 2010 event (Figs. S4 and S5). The uncertainty of the detection is regarded as the deviation between the best-fitting location determined following this procedure and the best-fitting location determined by Zhang and Wen (2013) (54 m), plus the uncertainty of the best-fitting location reported in Zhang and Wen (2013) (94 m). An uncertainty of 148 m is thus determined, which corresponds to 94.3% of the maximal mean CC (Figure S6). We thus define regions of 94.3% of the maximal mean CC as our location uncertainty, which corresponds to an ellipse with a 350 m long semi-axis centered in the location of the 2010 event detection (Figure 3 in the main article and Figure S6).
Figure S1. (a) Stacked correlogram for the detected event at 00:08:45.067 UTC, 12 May 2010, (b) locations of the determined 12 May 2010 event (black star) and two template nuclear tests (red, 12 February 2013; gray, 25 May 2009), and (c) the template nuclear test waveforms (red traces, 12 February 2013) plotted in comparison with the continuous waveforms (black traces) along the predicted arrival times of the detected event on 12 May 2010. The gray dashed line in (a) indicates the mean cross-correlation coefficient (CC) threshold (0.25) of detection. In (c), each trace is labeled with station name on the left and CC value on the right, and the total mean CC computed using the match-and-locate (M&L) method is labeled under the subtitle. The seismogram comparison between the other template (25 May 2009) and the continuous waveforms is shown in Figure 2 of the main article.
Figure S2. Displacement seismograms of the 2010 nuclear test band-pass filtered in (a) 1–5 Hz, (b) 5–10 Hz, (c) 10–15 Hz, and (d) 15–20 Hz. The predicted Pg phases begin with red lines, and the Lg-wave is marked between two blue lines corresponding to the group velocities of 3.50–2.60 km/s.
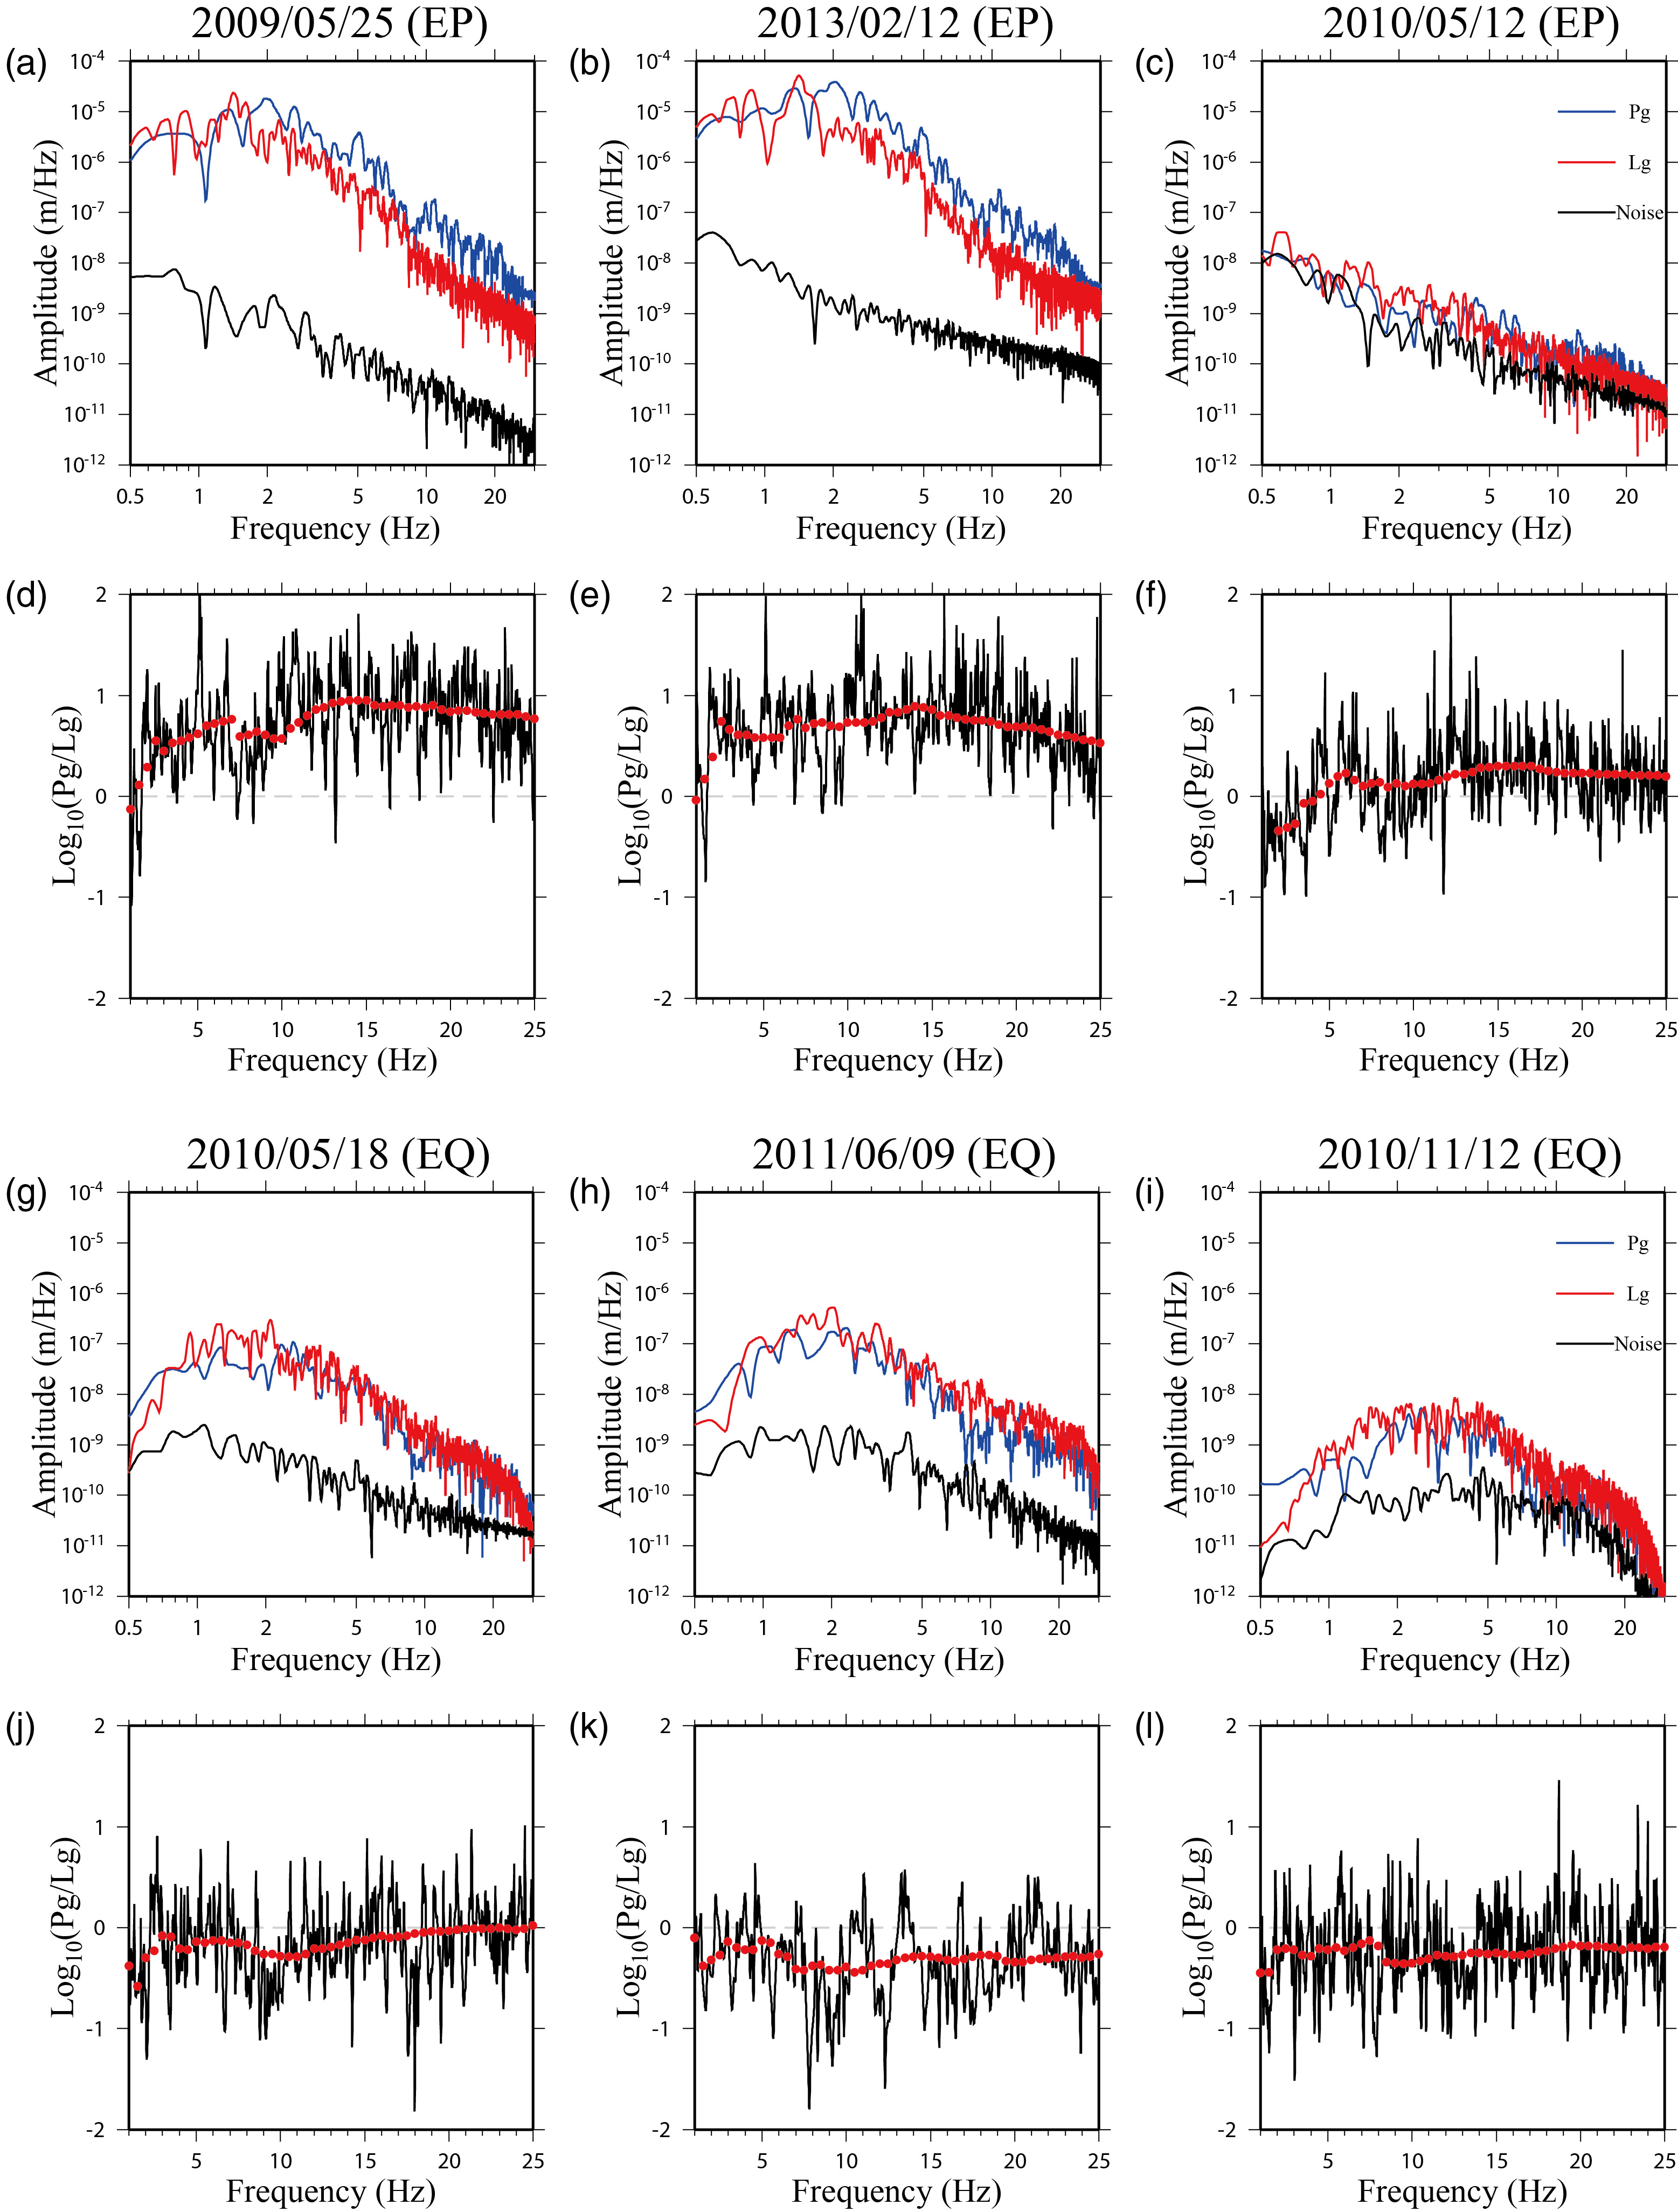
Figure S3. (a–c) Pg (blue trace), Lg (red trace), and noise (black) spectra of the seismic data recorded for the 2009, 2010, and 2013 nuclear tests at borehole station SMT. (d–f) The logarithmic spectral ratios Pg/Lg and their smoothed values (solid circles) corresponding to (a–c). The smoothed spectral ratios are marked only if the Pg and Lg spectral signal-to-noise ratio is larger than 2. (g–l) Same as (a–f), except for the three nearby earthquakes (Figure 1a and Table S2). EP and EQ stand for explosion and earthquake, respectively.
Figure S4. (a) Stacked correlogram for the scaled-down 2013 test (seismograms of the 2013 test are scaled-down with a scaling factor of 6.7×10⁻⁵ and superimposed with the background noise before the 2010 test), (b) locations of the determined scaled-down 2013 event (black star) and two template nuclear tests (red, 25 May 2009; gray, 12 February 2013), and (c) the template nuclear test waveforms (red traces, 25 May 2009) plotted in comparison with the continuous waveforms (black traces) along the predicted arrival times of the detected scaled-down 2013 test. The gray dashed line in (a) indicates the mean cross-correlation coefficient (CC) threshold (0.25) of detection. In (c), each trace is labeled with station name on the left and CC value on the right, and the total mean CC computed using the match-and-locate (M&L) method is labeled under the subtitle. The seismogram comparison between the other template (12 February 2013) and the continuous waveforms is shown in Figure S5.
Figure S5. Same as Figure S4, except that the template event is the 12 February 2013 test.
Figure S6. (a) Schematic map showing the mean CC value as a function of potential location of the 2013 test when detecting the scaled-down 2013 test using the 2009 and 2013 tests as a template. The scaled-down 2013 test is determined to be at the location of the maximal mean CC (gray star). The determined locations of the 2006, 2009, and 2013 nuclear tests are marked by red points and labeled with their dates. The inner small black ellipse represents the 95% confidence ellipse for the 2013 test location determined by Zhang and Wen (2013). The uncertainty of the determined scaled-down 2013 test is denoted by the white circle with a 148 m radius, which corresponds to 94.3% of the maximal mean CC (outer large black ellipse). (b) Schematic map showing the mean CC distribution when detecting the 2010 test using the 2009 and 2013 tests as a template. The 2010 test is determined at the location of the maximal mean CC value (red star labeled as 2010/05/12 for the 12 May 2010 event). The black ellipse represents its uncertainty based on 94.3% of the maximal mean CC. The previous three nuclear tests are marked by red points and labeled by their dates. Only the regions with mean CC larger than 87.5% of the maximal mean CC are presented. The background gray contour lines represent elevations and are labeled with elevation value. “The west portal” and “the east portal” suggested by Pabian and Hecker (2012) are denoted by black squares.
Table S1. Source parameters for three earthquakes
Table S2. Lg-wave amplitude ratios (2010/2009)
Pabian, F. V., and S. S. Hecker (2012). Contemplating a third nuclear test in North Korea, Bulletin of the Atomic Scientists, http://thebulletin.org/contemplating-third-nuclear-test-north-korea (last accessed July 2014).
Zhang, M., and L. Wen (2013). High-precision location and yield of North Korea’s 2013 nuclear test, Geophys. Res. Lett. 40, 2941–2946.
[ Back ]